

Please watch the video! The monthly analysis begins at 0:00, the weekly analysis at 2:27, and the daily analysis at 4:36. Ramblings about the next post begin at 13:09.
The best measurable projections using Gartley’s AB=CD patterns are shown in the daily charts. Here is the bullish projection:
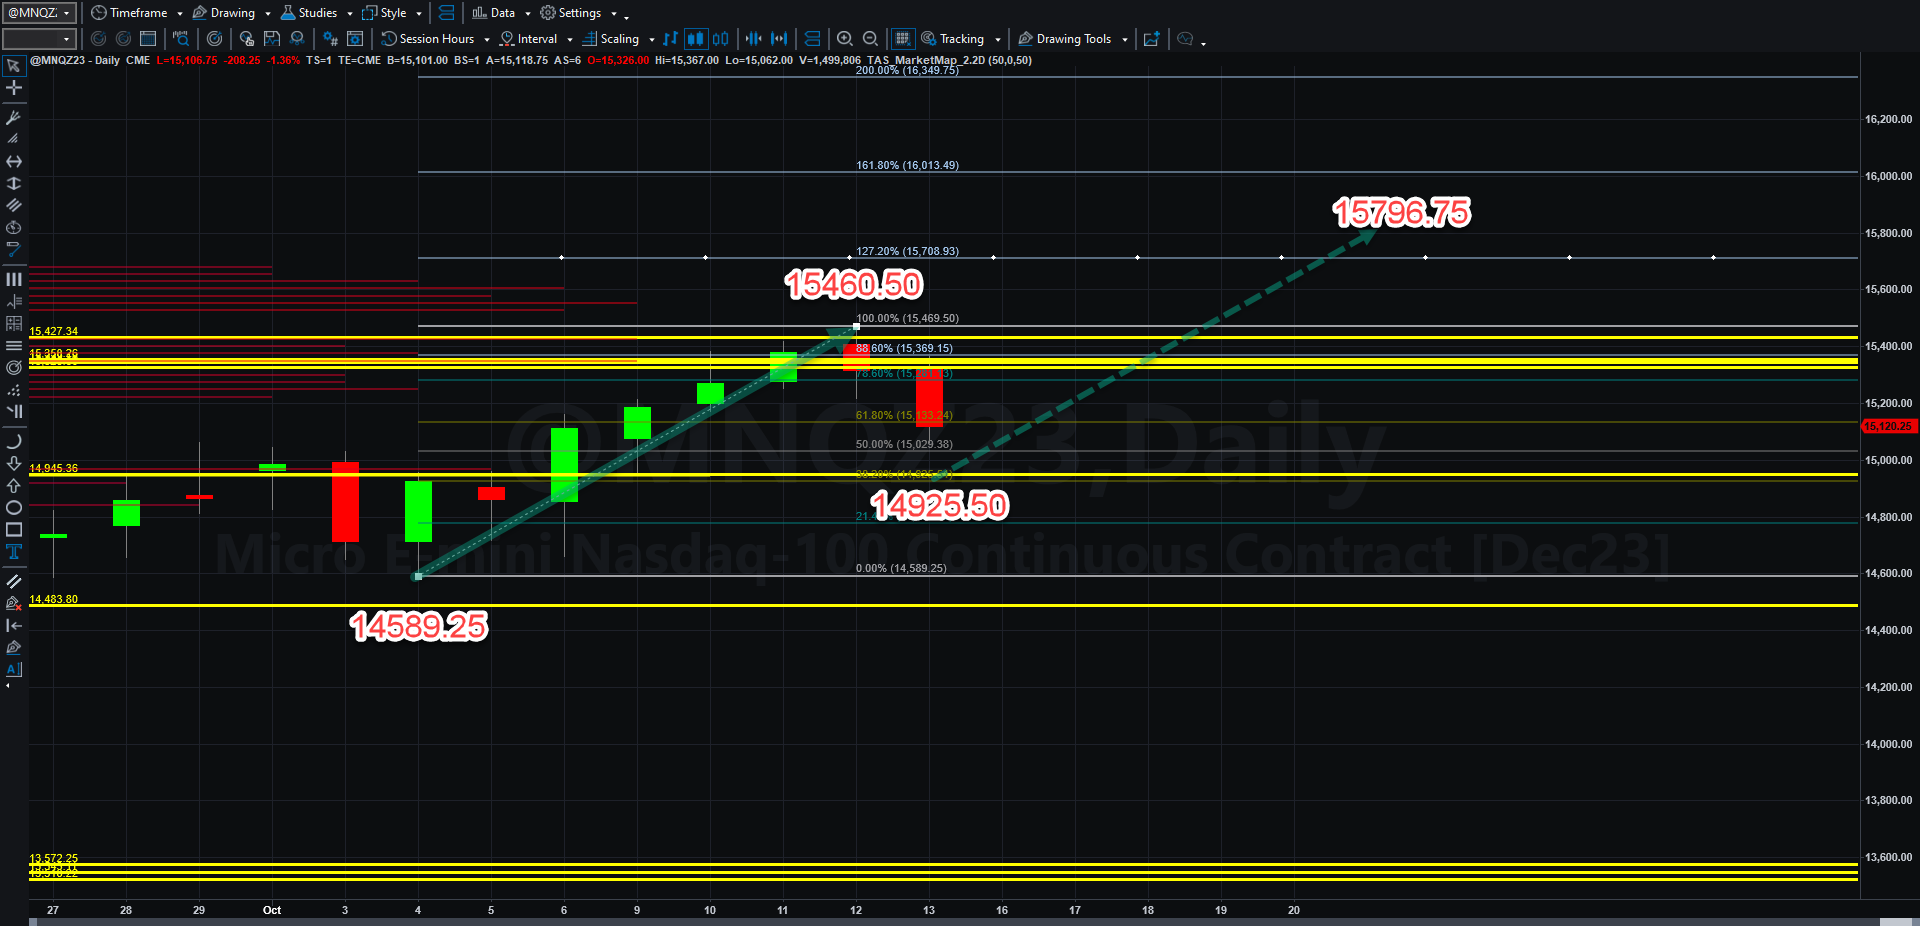
If the Fed changes its mind and becomes dovish again (and there are quite a few Federal Reserve governor speeches along with Chairman Powell next week), individual investors and institutions could wade back into these markets no matter how overvalued they might be. The market casino will still be open.
Here is the daily bearish projection:
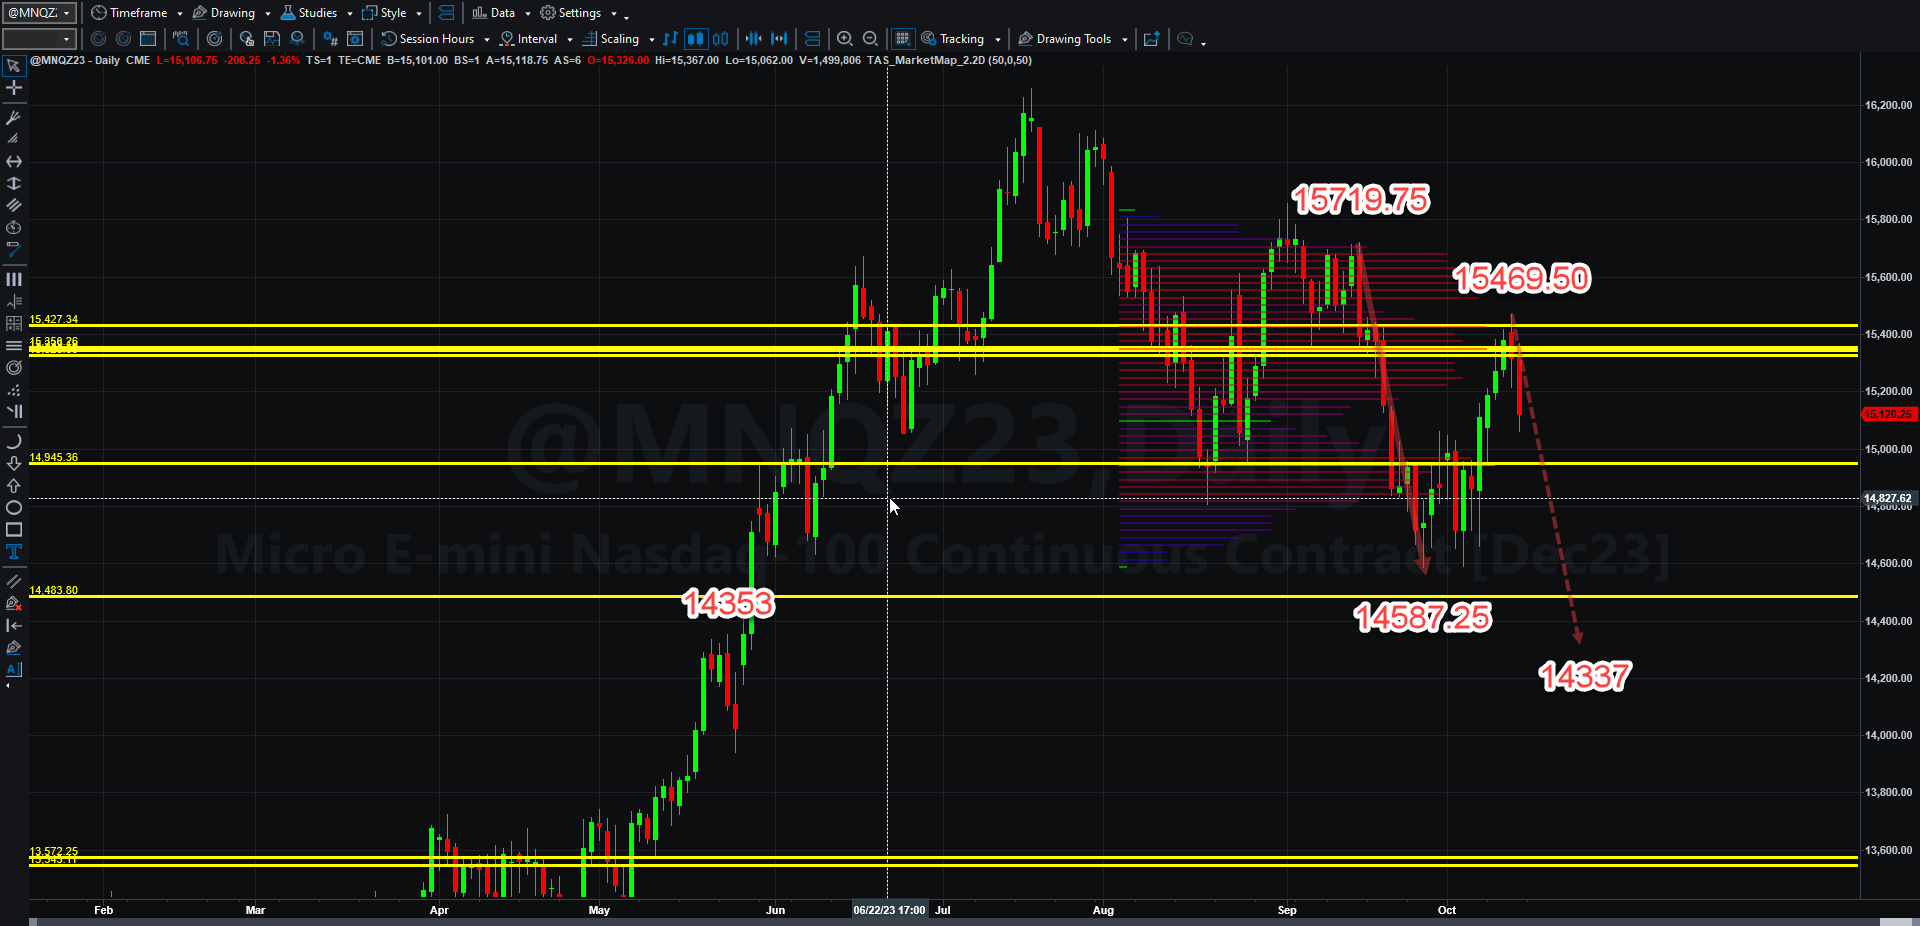
What is critical to understand is that if price support down not hold around 14587.25, MNQZ23 could easily see a retest of 14353 and begin to break down into a huge gap in commerical holdings that might not find support until 13572.25. Will that happen? I have no idea, but the conditions are right for such a correction if sellers become active and aggressive.
That is basically the very abbreviated weekly review, but I think it covers what could happen at least from a technical analysis perspective. We will simply have to watch and be prepared for what one’s trade plan can take advantage of.
Have a great weekend everyone! Thank you for supporting this Substack blog.

