

Watch the video (which of course is for MNQZ23, which I did not introduce). The monthly analysis begins at 0:00 and the daily analysis runs from 4:07 to the end.
If volume continues to favor buyers ( as it appears to be save for the bearish ratio calculation of lagged (price x volume) momentum, the binary indicator and volume both tend to favor a bullish outcome which may resemble previous weeks’ weekly chart projections:
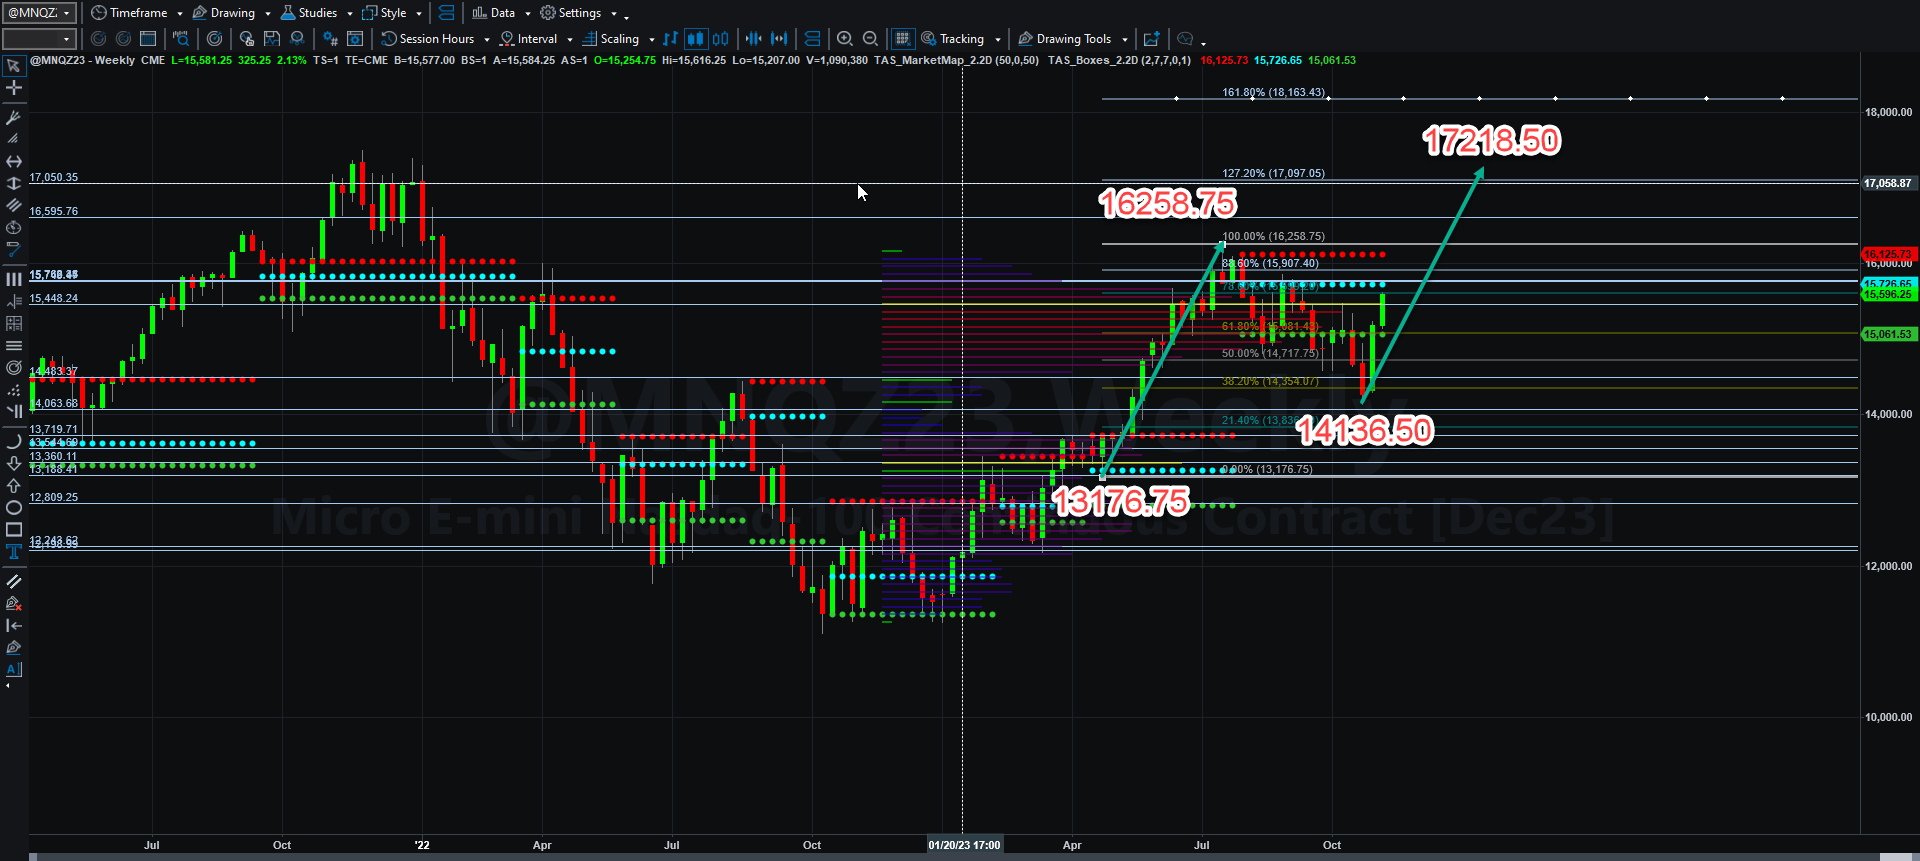
Will this happen? Again, I have no idea, but if buyers get aggressive against a backdrop of paused Federal Reserve rate hikes, the “freer” money will flow to equities as there is no Congressional spending cap until January 2025 and the printing presses will continue to run.
We will know what the core inflation rate is like on Tuesday at 0830 EST. That may be the principal driver of price action for the next few weeks as the Fed determines if it needs to raise interest rates.

The most recent Michigan Inflation Expectation levels are still elevated at 4.4%. Money supply is collapsing and that leads to credit tightening over time and business slowdowns and earnings reduction. Job openings are declining in aggregate, and if earnings forecasts begin to decline, the possibility of recession gets stronger.
All we can do at the moment is to watch what happens with economic data, watch the charts and see how volume profile and price momentum work out, and see if the patterns I have discussed emerge.
That is all for me today. If you have any questions, leave them in the comments! Thank you for supporting the Buffalo Trader’s Writing Desk!

