


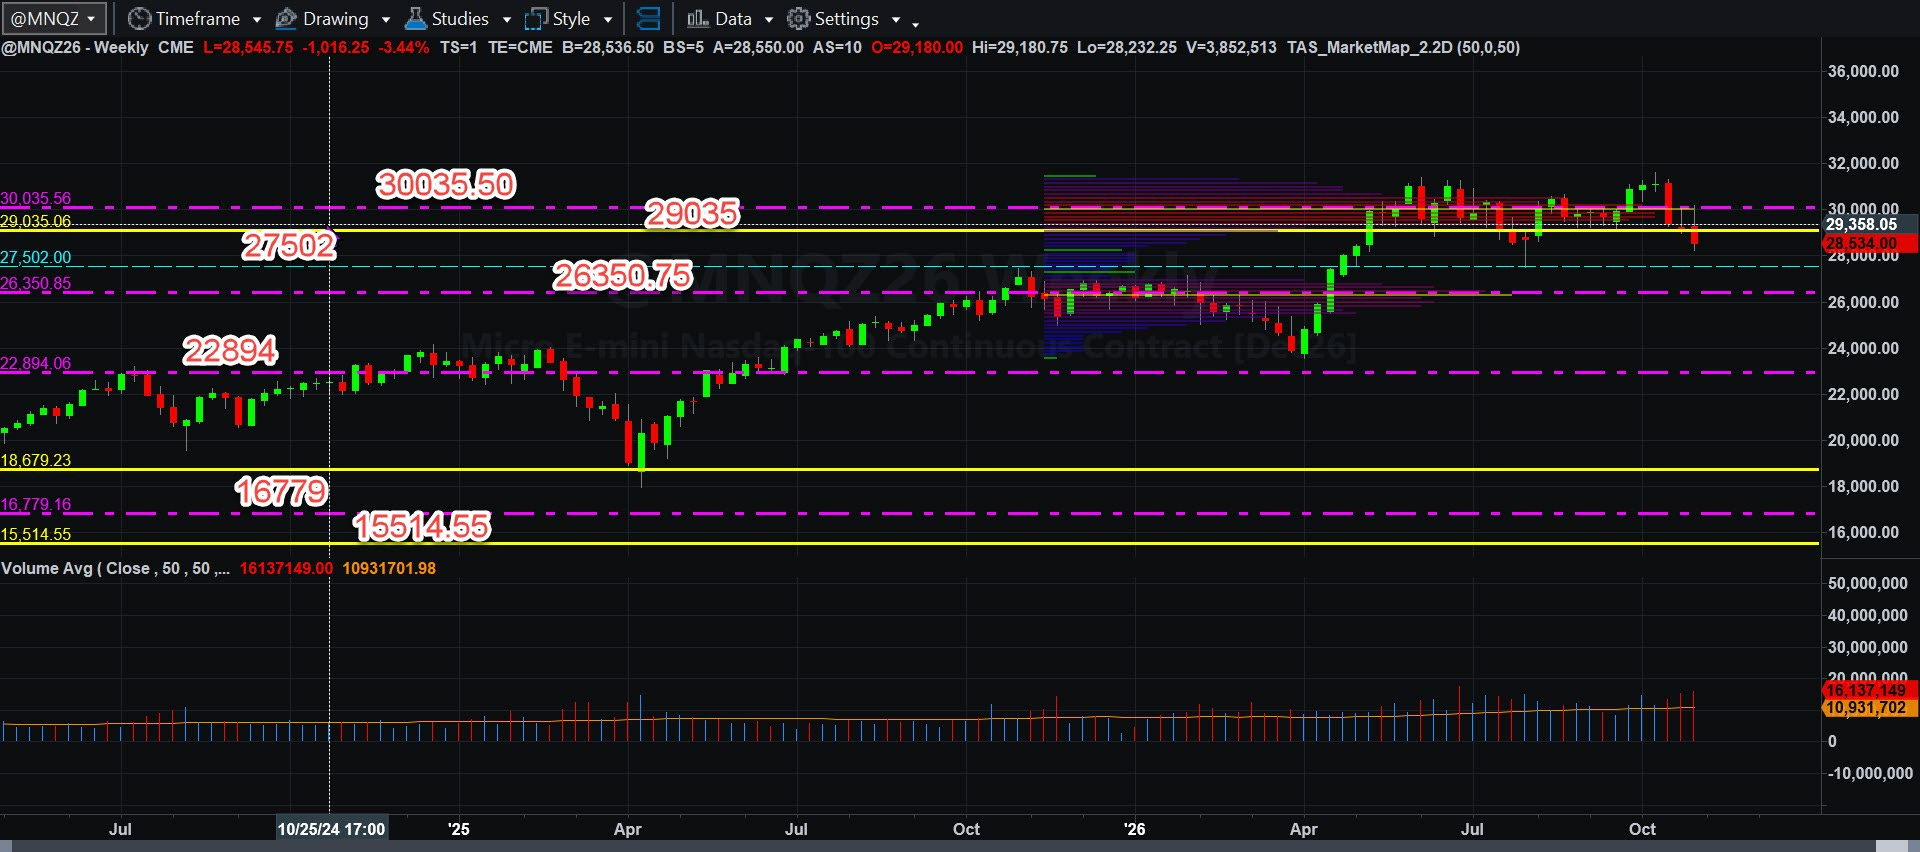
Remember this chart from the November 1 post? We did blow out 27,502 to the downside. Selling volume looked sufficient according to my model and I shorted MNQ26 for one measured move this morning, and left the building at that point. The chart below shows where support is on the daily chart for now (we have not closed the day as yet).
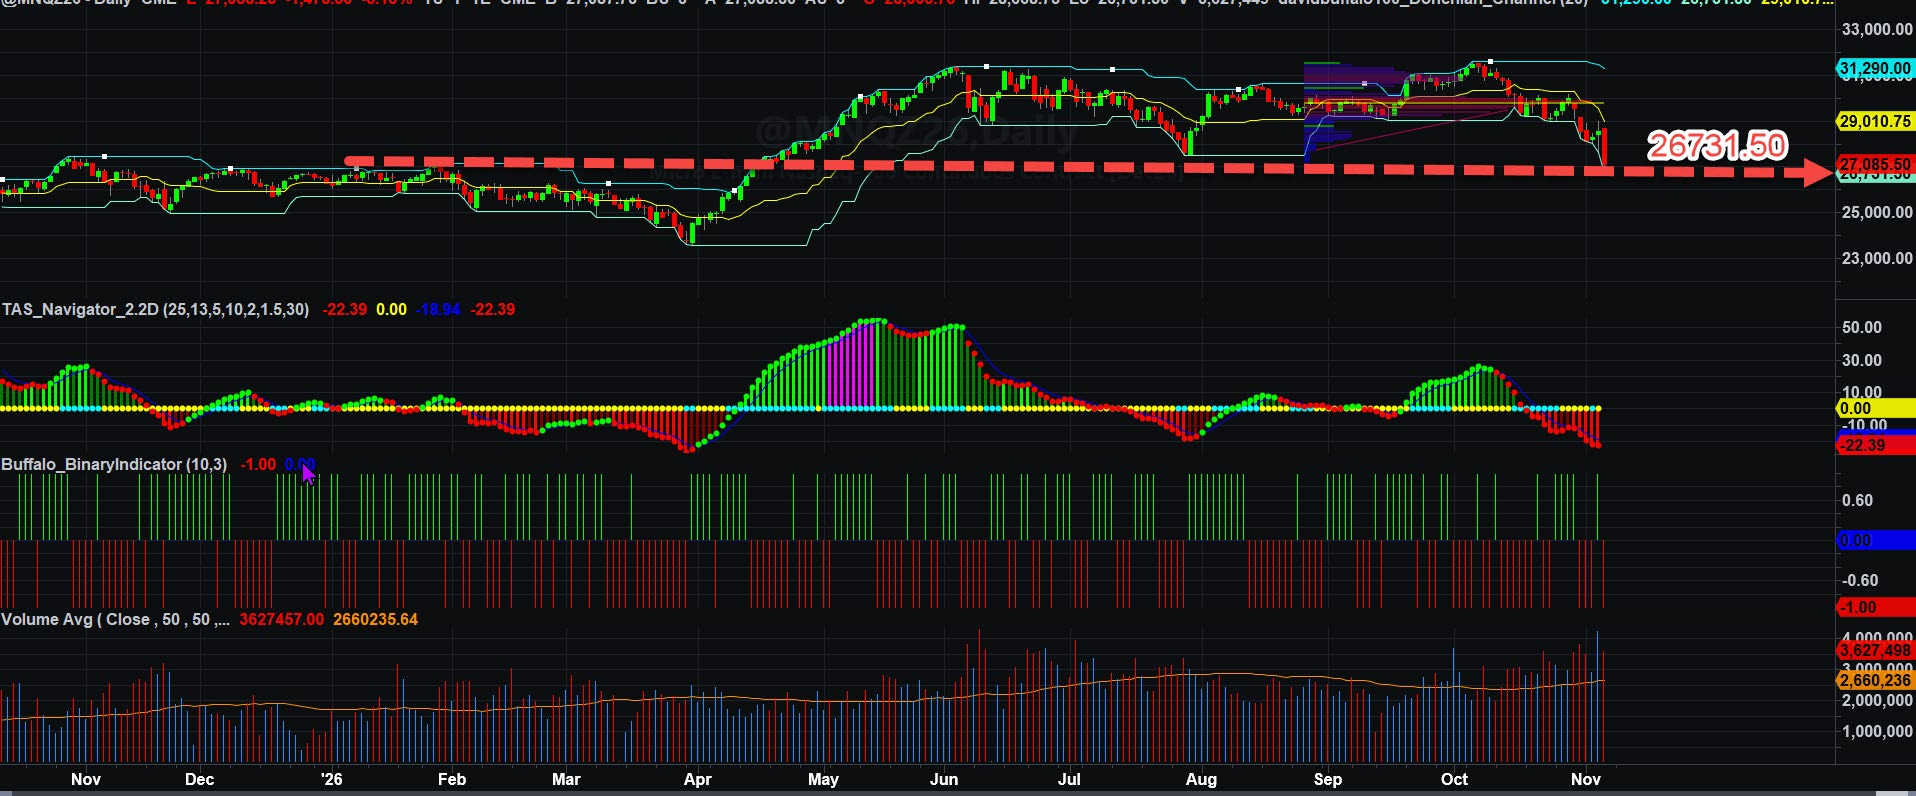
We are very nearly at “top-bottom” support, based on previous trading action, at 26,731.50. Should that level be breached with force of selling volume, we could see a new low around 26,350.75. If there is even more pressure, a 25-handle might not be out of the question, and the deep VWAP control point low of 22894 might come into play in the coming weeks. Do I know this as an absolute certainty. OF COURSE NOT. All I am saying is that you should be prepared to hedge or whatever else you have to do to tech names showing this kind of weakness and be prepared if something goes awry.
No one knows what will happen next, but the charts and their associated data components leave clues.
That is all I have for now. This selling will pass, but we need to see how the AI components of this market hold up against their financials and future debt accumulation and future revenue projects as they hit, or miss!
Have a great rest of your week! Thanks for supporting the Buffalo Trader’s Writing Desk.