


In the past few sessions, I have discussed the risks and potential rewards that might come from Bitcoin through the Bitcoin continuous futures price charts.
Since the early 2020s, Bitcoin has been sucked into the world of high leverage and ETF concentration by large institutions that hold huge positions in the “decentralized currency.” As Japanese bond yields rise and the yen carry trade unwinds, institutions that leveraged their purchases by borrowing formerly cheap yen will likely be forced to liquidate. That liquidation likely includes large positions in Bitcoin, which is now also an institutional asset owned by “whales” on a leveraged basis.
This kind of mess could very well be a precursor to a major institutional crisis in private credit, and that fear could spread across financial sectors, including AI, which is mired in private-credit problems and bloated revenue estimates. Bitcoin would be caught up in it too. There are two pieces you need to read. One is free, from QTR’s Fringe Finance, and one you need to pay for, from DeCarley Trading. Carley Garner looks at it from the perspective of the forex disasters of the early 2000s.
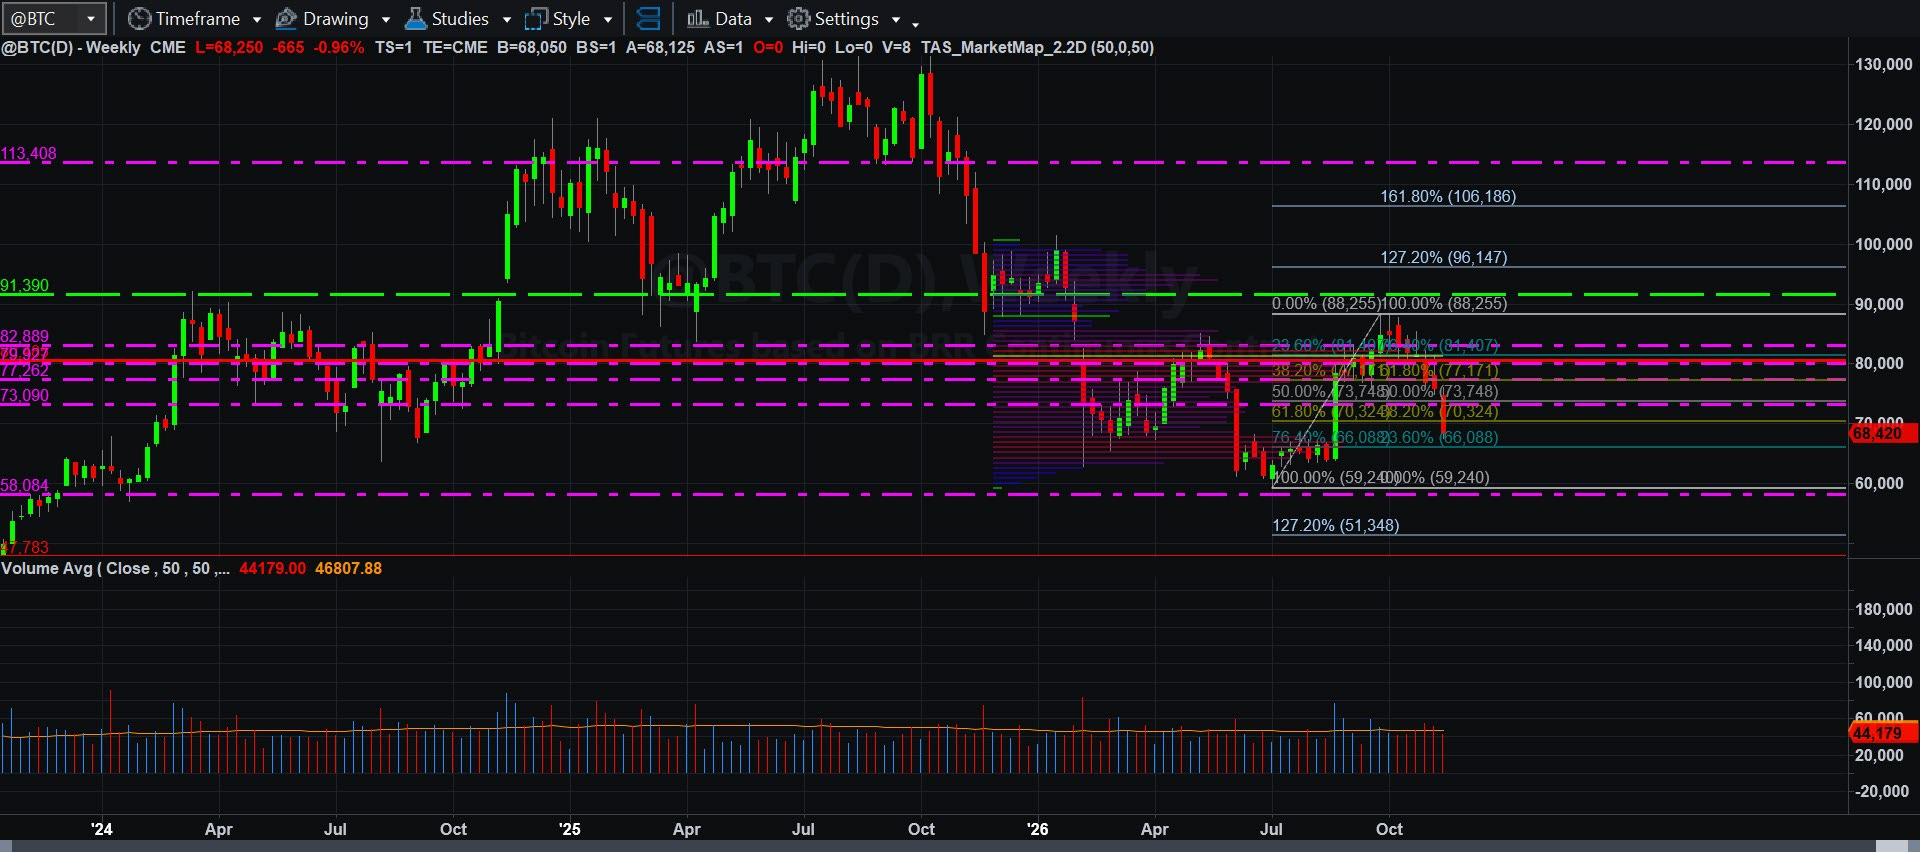
What I am here to show you is the potential damage that could be created as the Bitcoin futures market closed today at $68,420. Fortunately, it did NOT close at the low, but things still look a bit weak.
I will only focus on the monthly chart for now, and as you may remember from the video I created from a week or so back, the dotted magenta lines are weekly volume-weighted average price (VWAP) control points, and the solid lines are the monthly volume-weighted average price control points.
For clarity, I will post a chart without markings and one with, so that you can see how those key points line up. I got a complaint about the large markings, so I will add more chart real estate so that you can see everything.
Monthly BTC Futures Continuous Chart
Monthly BTC Futures Continuous Chart With Markings
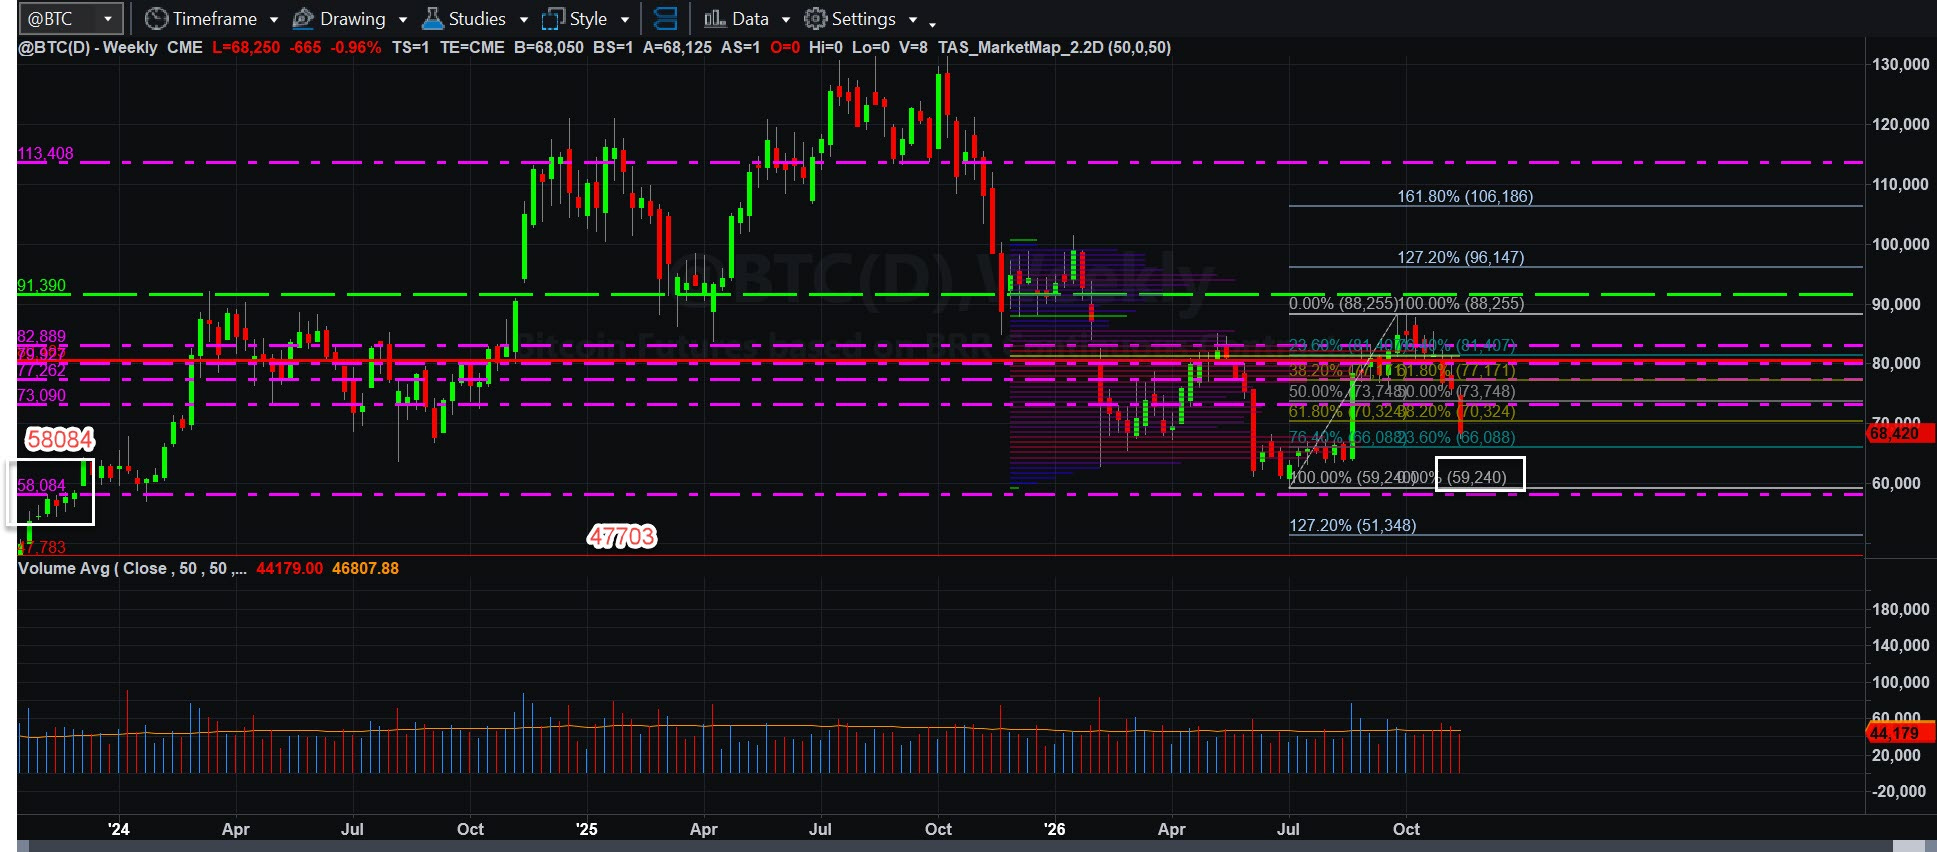
We have taken out quite a few support price levels in this week’s trading. Since Bitcoin trades 24/7, the manic nature of the rumor mill could continue to put pressure on Bitcoin, and support, if not found at $59,240, could be found at the weekly VWAP control point of $58,084. Below that, there’s no significant concentration of volume at a monthly (or weekly) VWAP control point until $47,703. If panic ensues, there could be another significant step down.
One reason I can’t see price going much lower than that is that the monthly VWAP control points are based on a 50-period simple moving average. Since Bitcoin futures began in 2017, we would need to see the pull back to gather enough data to establish a new support point. Will we see something rather cataclysmic as we saw in November 2022? I have no idea, but as we all know, Bitcoin has its own brand of volatility, and anything could happen. We will simply have to watch. These are times that might test the mettle of Bitcoin maximalists, but such is the nature of financial markets.
I have a lot to do this weekend, but if anything else pops up, I will add more commentary. I have more video to produce and another review of MNQZ26 on deck for completion.
Thanks again for supporting the Buffalo Trader’s Writing Desk! If you liked what you read, give us a like, and if you want more, consider becoming a paid subscriber!
Have a great weekend, everyone!