

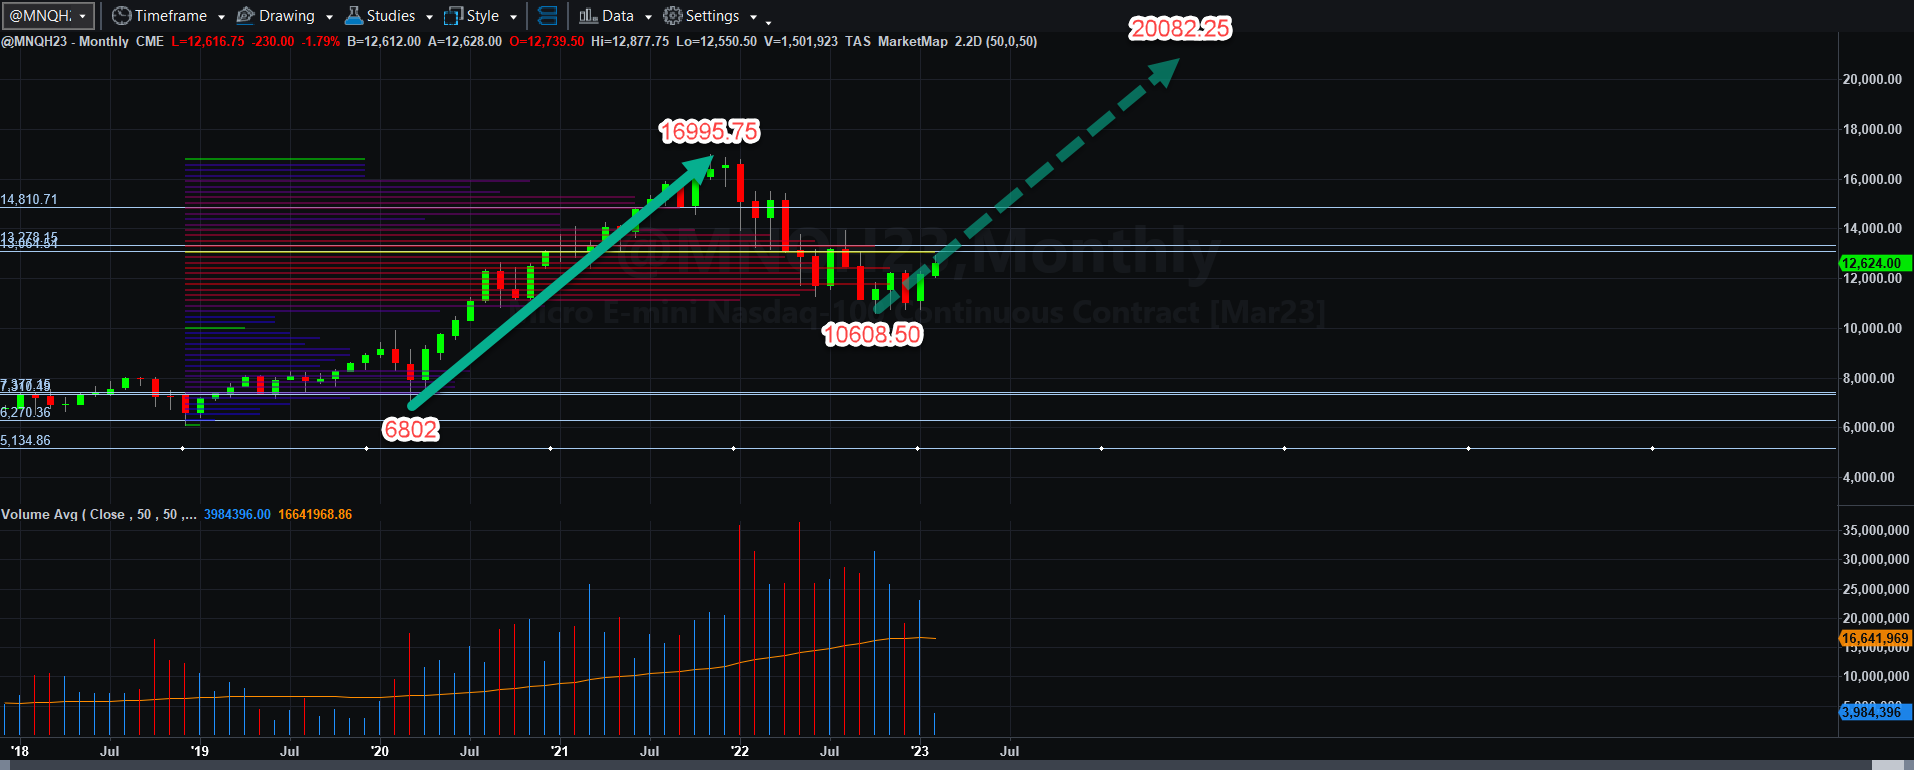
MNQH23 Monthly Bullish Pattern (based on perfect symmetry and only a projection in this case):
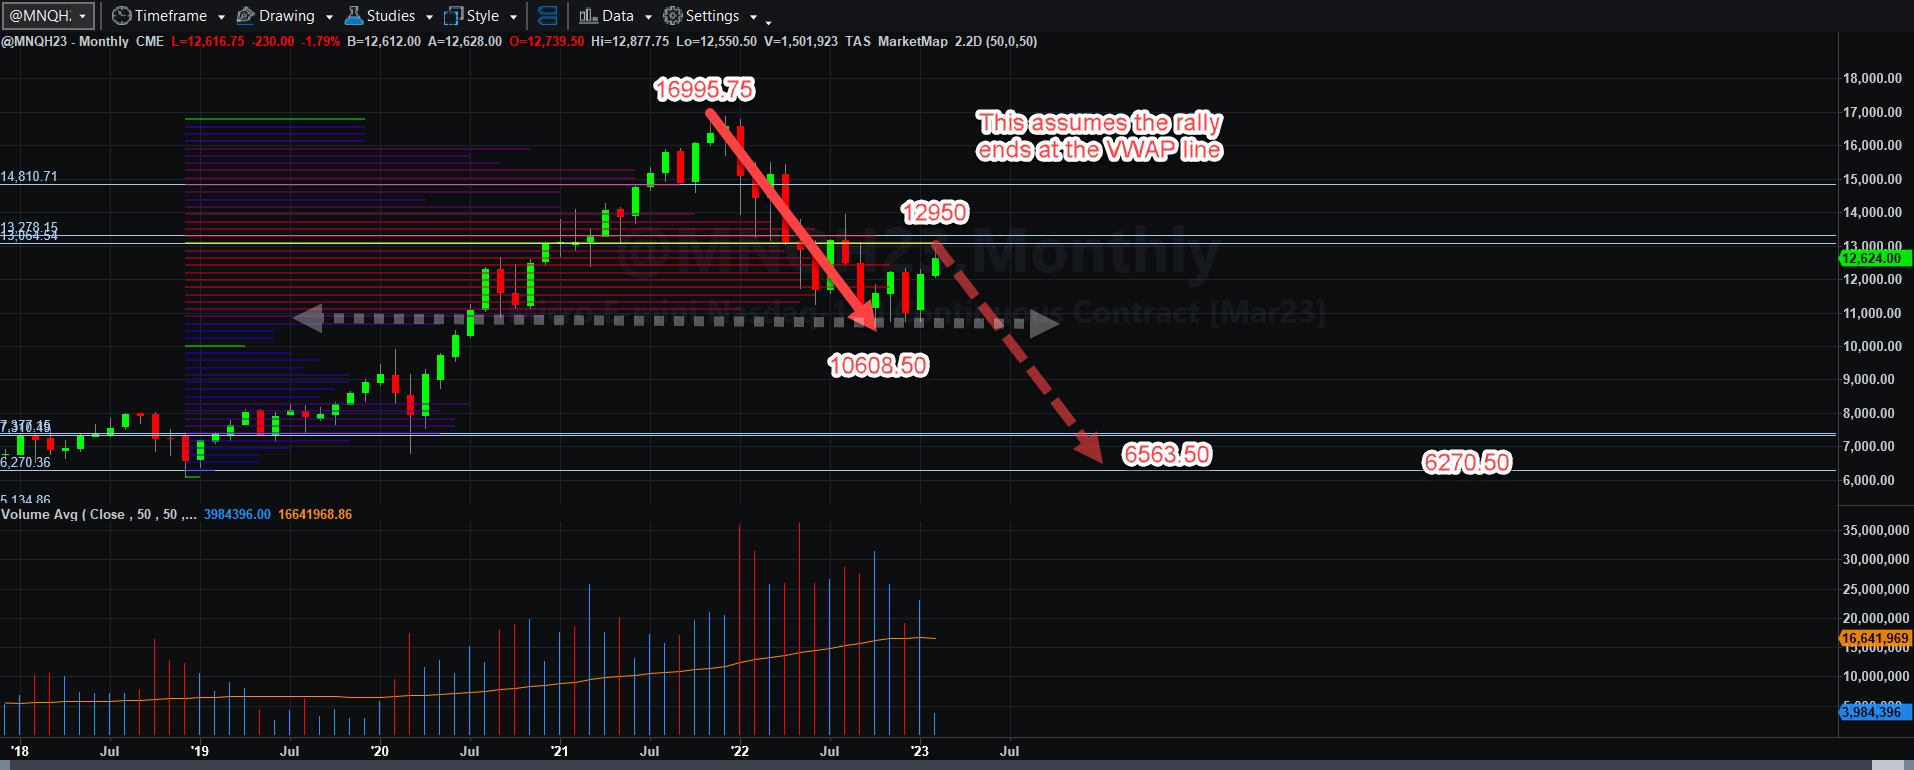
MNQH23 Monthly Bearish Pattern (based on perfect symmetry and only a projection in this case):
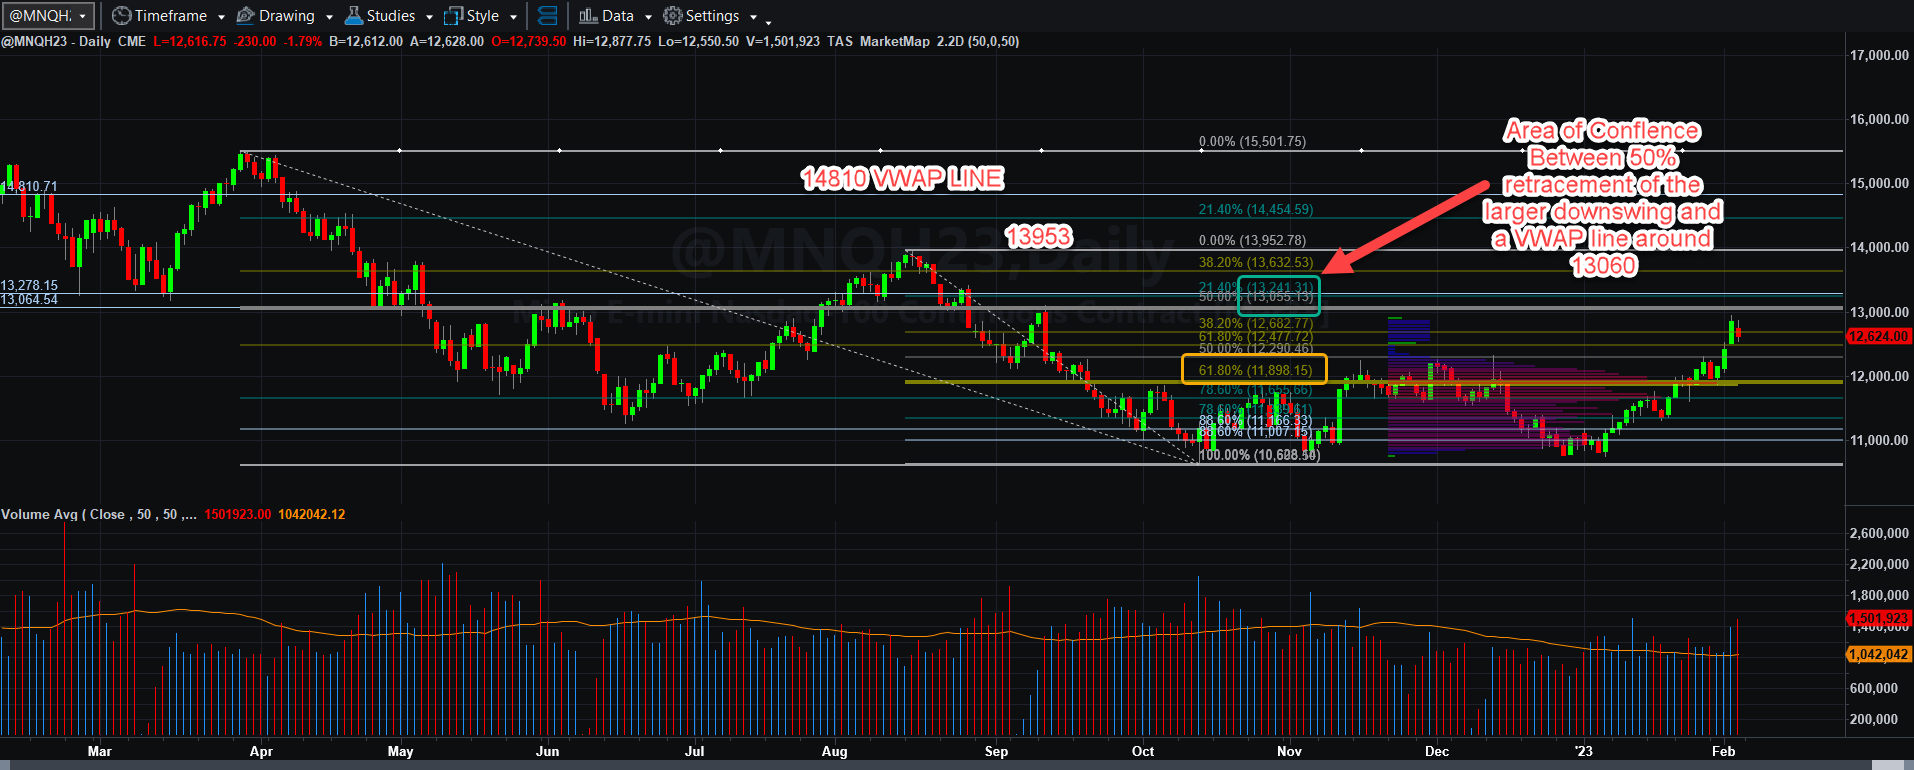
MNQH23 Daily Bullish Pattern (based on perfect symmetry and only a projection in this case):
At this time, I am not going to discuss the bearish case on the daily chart, but as the week progresses and if we get a reversal, I will cover it in more detail.
If you watched the video, you will see that the VWAP lines around 13000 to 13300 could be critical areas of potential resistance should the rally that began in earnest in January is to hit a stall point. Significant commercial interests held or traded contracts there. If we cannot make it through that level again, I could envision being stuck in a trading area between approximately 13300 and 10680.50 until some kind of Federal Reserve, economic news, or world events shatter trading in that range one way or the other.
From Shadowstats.com, inflation calculated as it was before it was sanitized in the early 1980s ran at 15.23% in November 2022 and 14.52% in December 2022 (new data reflecting January 2023 will be out this week sometime). An energy tax of 17% has been added to natural gas and electricity generation, so all that will be reflected in all manufacturing processes and farm produce costs, as all of it requires energy to be used AND ULTIMATELY PAID FOR by consumers.
With a Fed Funds rate of only 2.25%, there is no accounting for a true risk-free rate of return that reflects price inflation at a producer or consumer level. Consumer debt is the highest ever and disposable income for American family is diminishing at the greatest speed since the Great Depression.
Even if we hit record-high employment, if wages do not rise and manufacturing, energy, and food prices continue to climb at double digits, the economy will hit a wall, if it has not already. That is why the idea of the endless printing press leading to wealth and prosperity for investors is a fantasy in the end. At the extreme, rising rates used to create the illusion of wealth will swamp the Federal government with interest payments, and the Federal government will invariably collapse from its own debt. That time is not that far off.
At some point, particularly when it comes to energy and commodities when other nations prefer to use a commodity or other asset-backed currency to pay for their goods, the U.S. Dollar will become less liquid and our debt less valuable, and a decrease in our standard of living will become increasingly evident, particularly if we lose strategic reserve currency status.
All I can say for now is that if bulls drive MNQH23 through the 13300 level, we could ultimately see 14100 to 14800, and if we blow through 10608.50, we could easily see at least a 9-handle in this contract’s future, and even lower if inflation or other economic malady grabs hold of our economy.
Day by day I will be analyzing it and you will read it here. Thank you for supporting this blog! Have a great week everyone!

