

This is basically the only chart, a daily chart, I will produce for MNQH23 today, as the monthly and weekly charts show a basic standstill from last week.
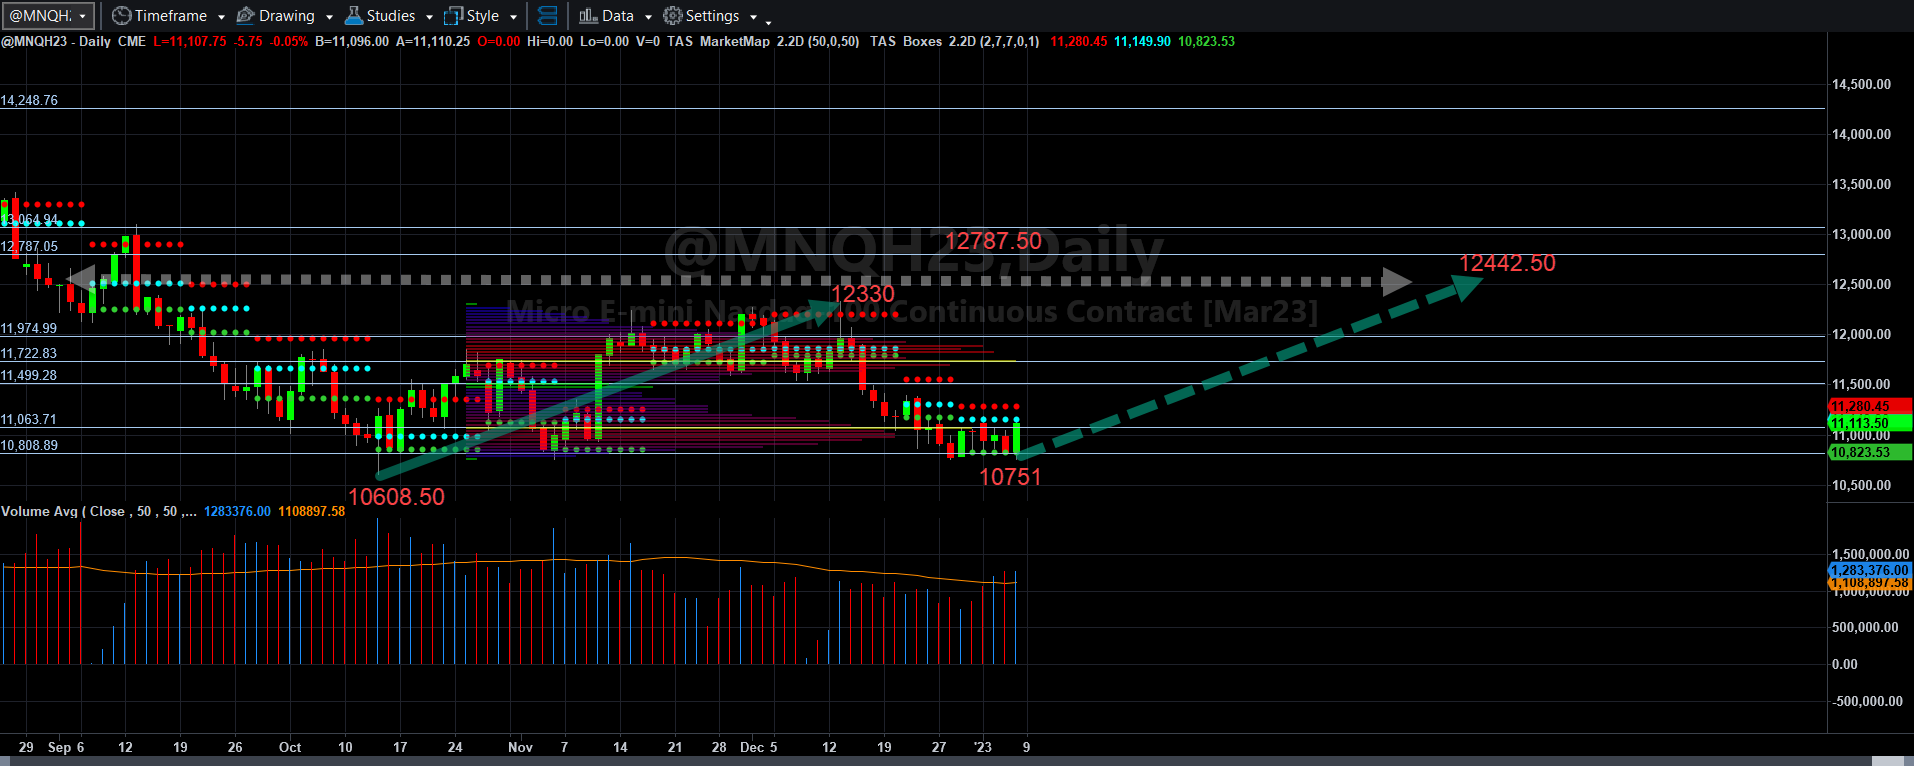
The key thing to realize here is that for the first time since November 15, 2022, we had a net bullish volume that exceeded the 50-day moving average. At least it appeared that the jobs data (accurate or not, which we will find out from St. Louis or Philidephia Feds when revised), did get buyers interested in buying, and in buying above the support low of 10608.50 which is a critical level needed to hold any rally together.
I am still not convinced yet that a strong rally will take us back above 13000 until we see earnings data, but I think this market if it does not break below 10608.50 has a shot at 12442.50 which would be a symmetrical AB=CD target high, and could even get back to 12787 if buyers became determined with MNQH23.
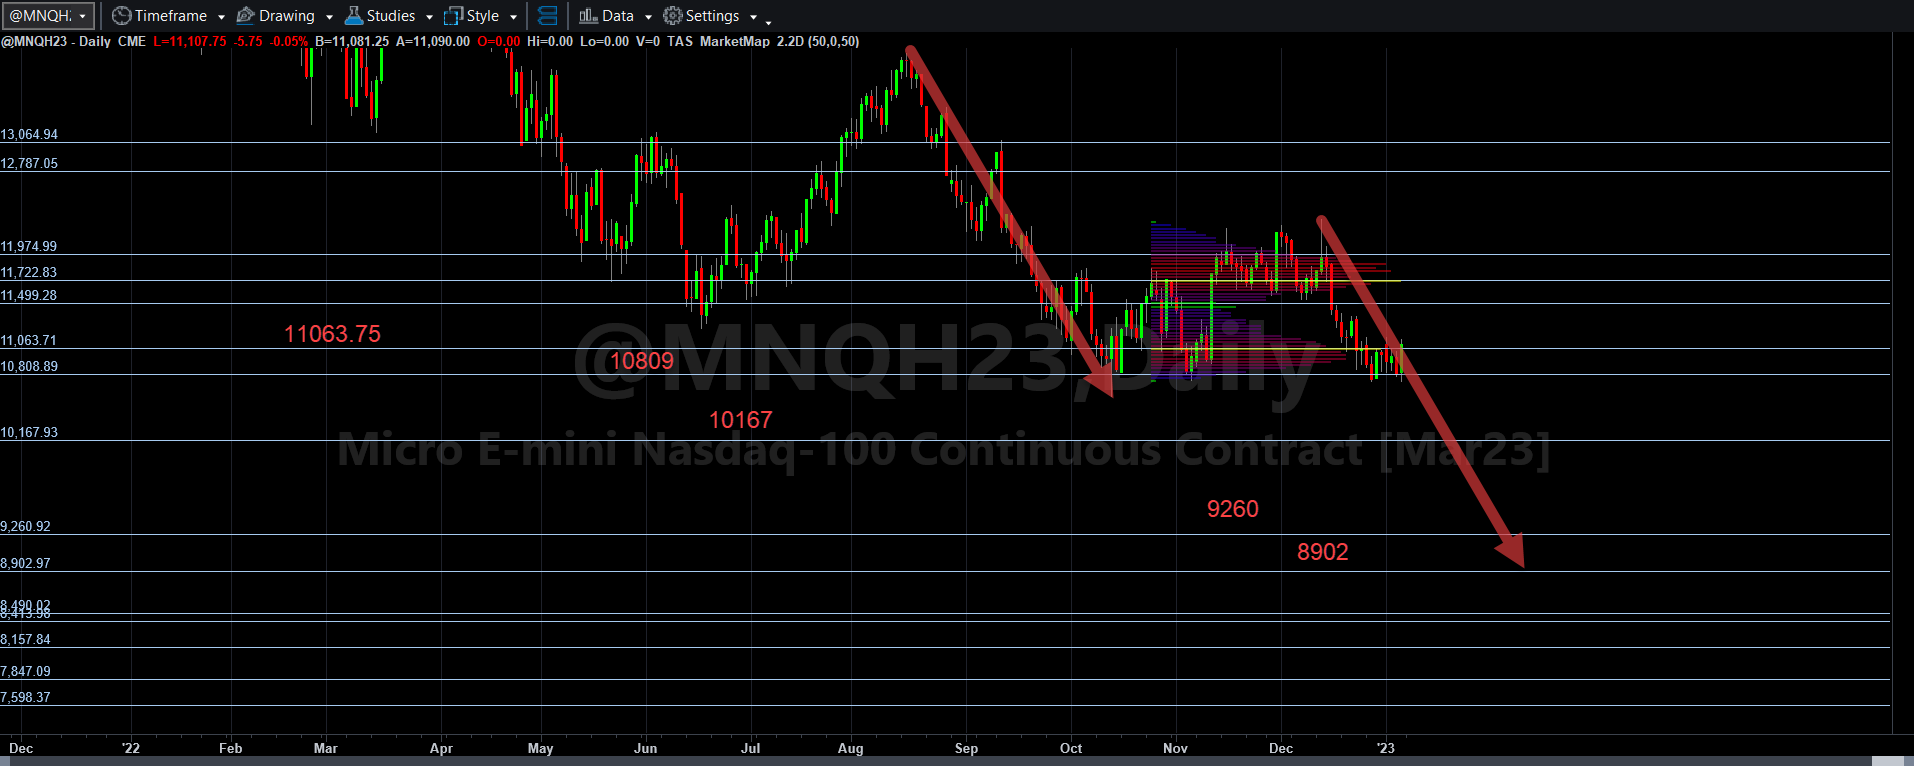
If not, then that area around or below 9000 is a potential target. The VWAP line gaps below 10608.50 are pretty large on a daily VWAP line basis. Take a look at this chart:
I have a ton of things to do this weekend, so I will not be spilling analysis out much today, but a general summary of issues that cause me concern about upsides of the U.S. stock market over the next year are decently expressed by someone I do not often agree with, Marc Faber. Here is a video he produced yesterday in conjunction with Wall Street Silver.
I have constantly ranted on the two things he discusses, monetary and interest rate policy, and the entire concept of valuations. One thing that I can do is write about, with some data to back it up, is why I believe as Faber does that is the market is quite overvalued on any reasonable earnings or enterprise value basis, and it has been for as long as the time from basically 2013 to present (even though I may have to modify the earliest date based on better data).
Interest rate policies and Federal debt accumulation policies have been used to favor money center banks, institutions, and corporations, to inflate assets in “casino” fashion since 2008. This kind of thing cannot continue as we are now printing money to pay current obligations and those payments are inflationary because the money being printed is completely worthless.
What I will try to do is to produce some historical basis to confirm my contentions and hopefully to come up with potential targets as to what might constitute a fair value for long-term or long-swing timeframe long-only investors to get interested in the markets again. Technical analysis can help with timing, but if you have an idea of value, one can monitor one’s investments and decide when to rotate out of stocks and sectors when they become technically weak and from a value basis too expensive. I have not held large positions in stocks since 2013 and have traded at the margin otherwise. I have primarily traded stock index futures since that time, and forex and forex futures as I had access to do so.
I will be writing more about this soon. Last week was only a modestly profitable week for me, but I shall push forward to keep the rock moving up the hill. Stay tuned for more, including surveys.