

Price, Price Spread, Lagged Prive/volume Spread, and Binary Price/Volume Indicator
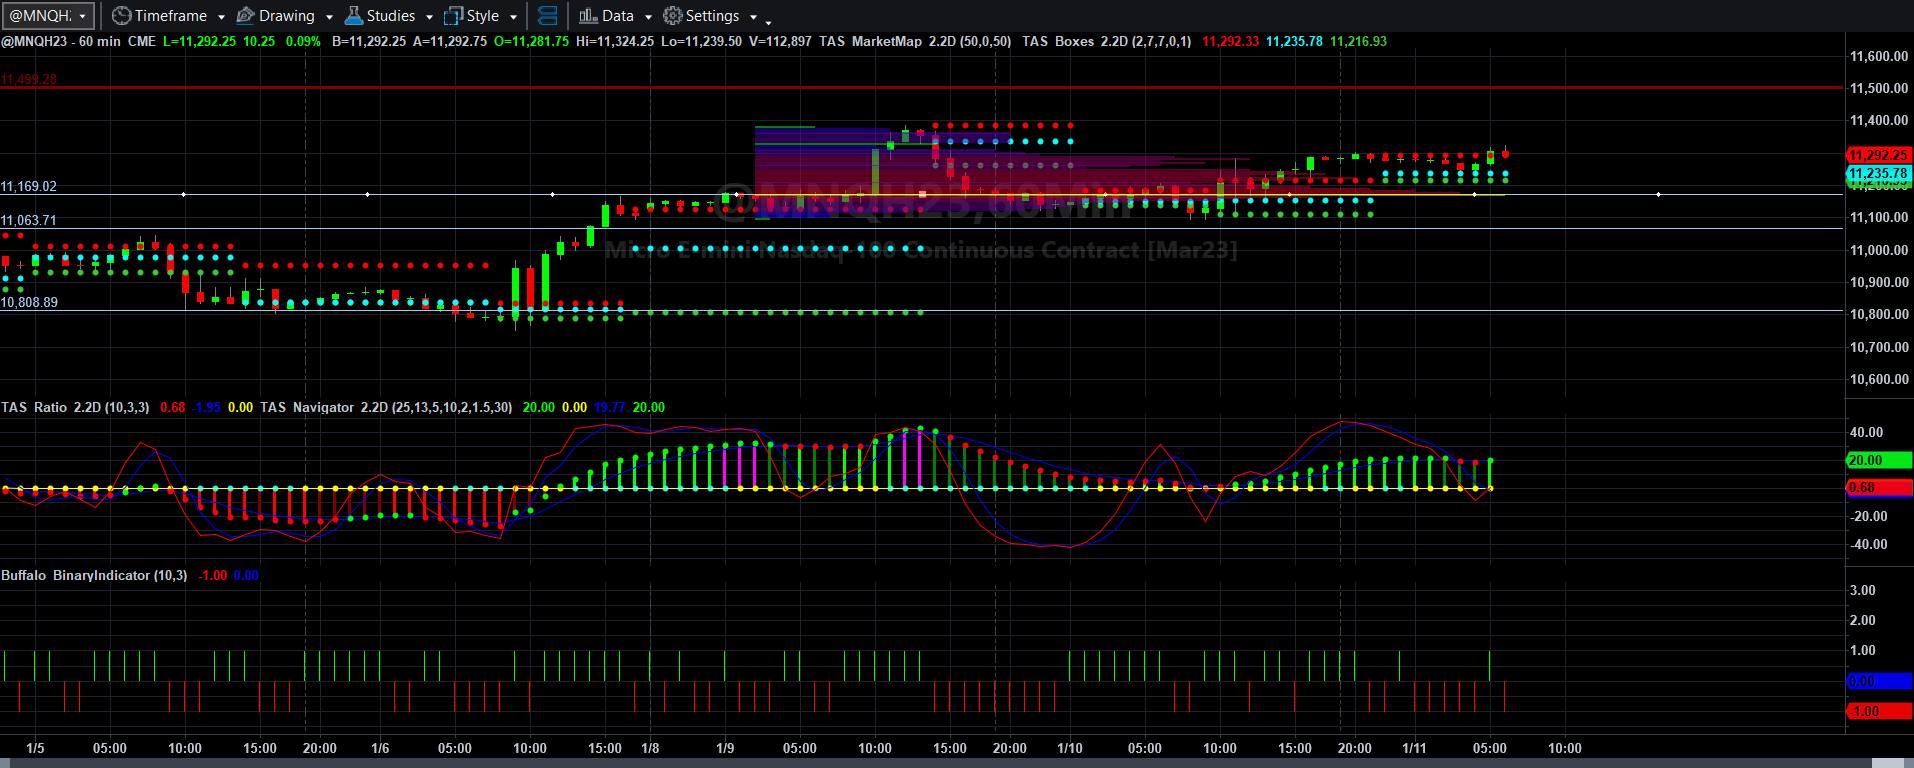
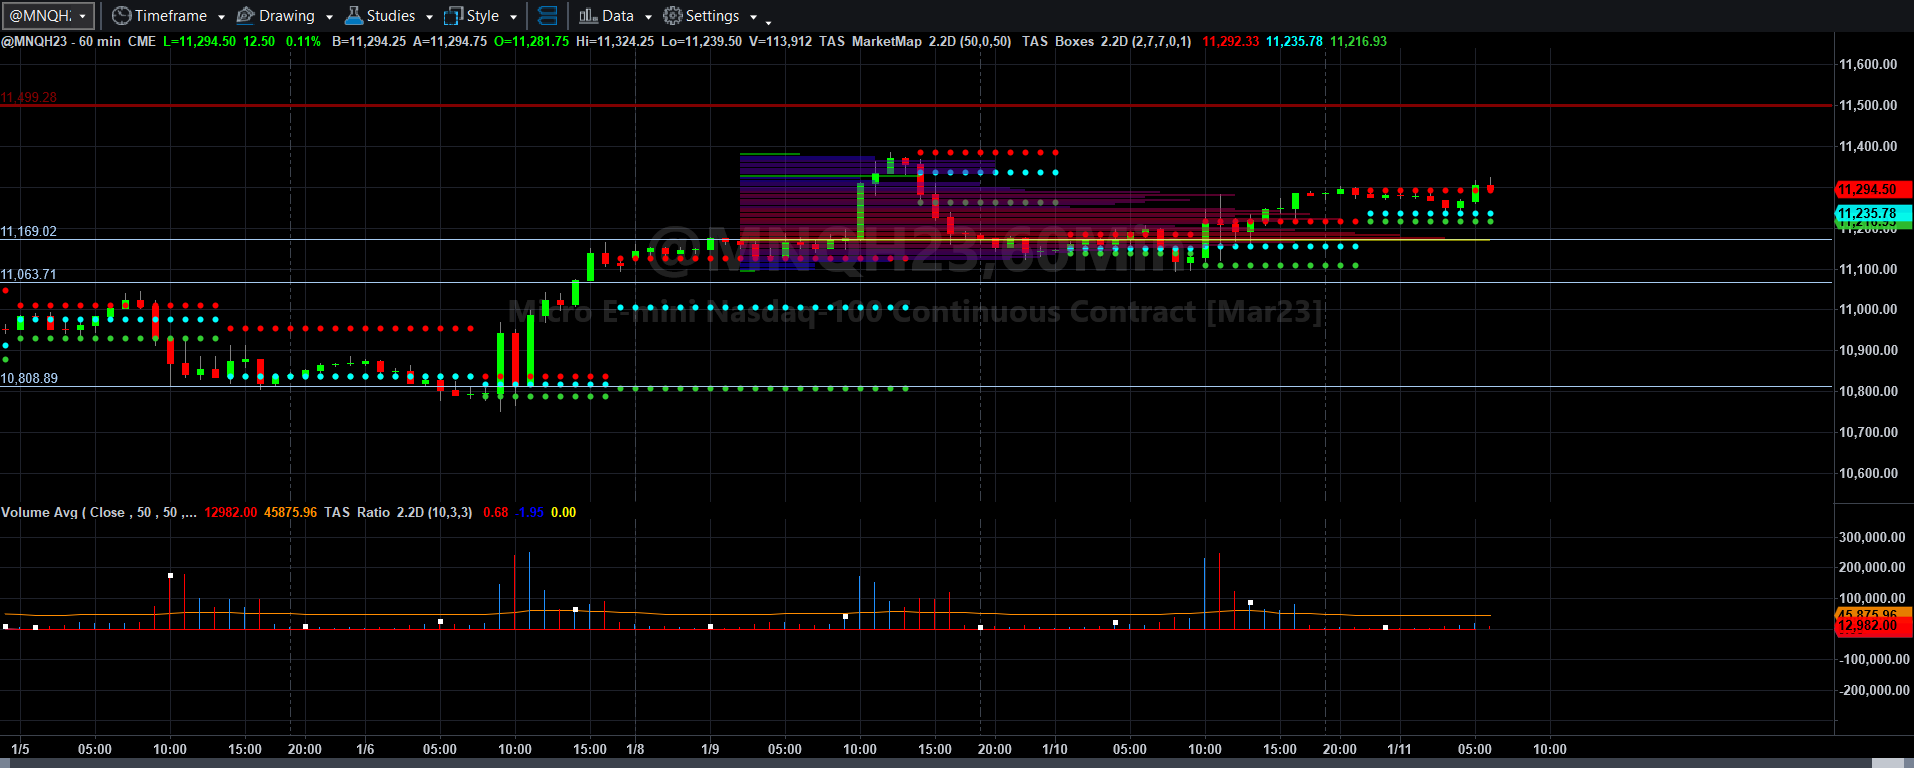
Price, Lagged Price Volume Indicator, and Total Volume With 50-period Moving Volume Average
Fibonacci price scale with targets
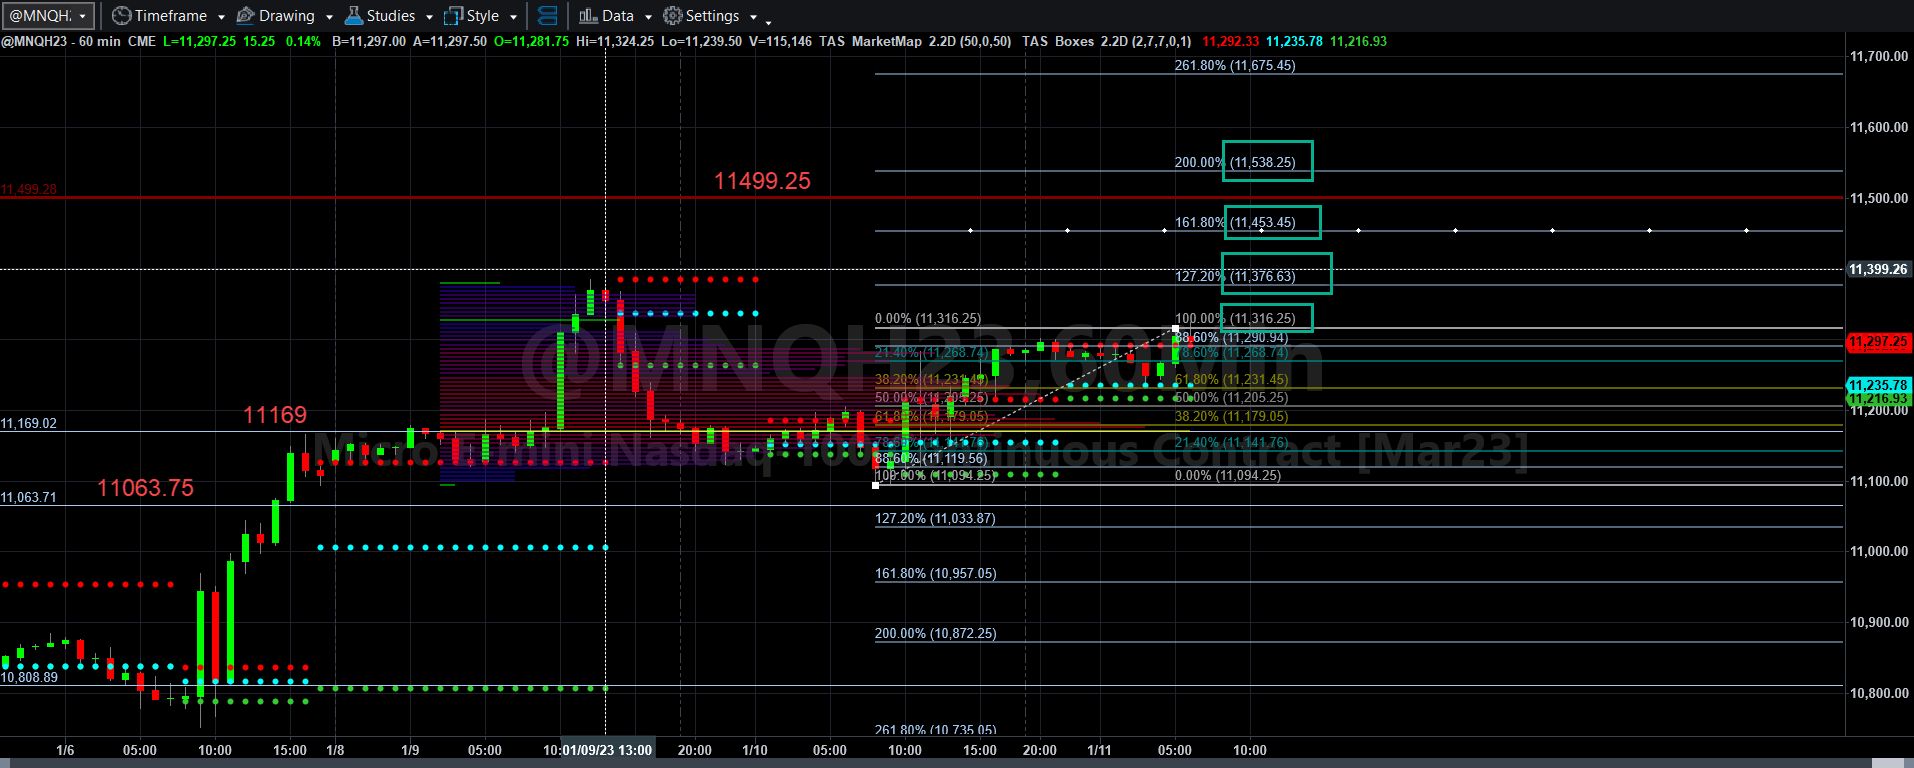
It turns out that my concerns about a selloff stopped near a VWAP line around 11063.75, and that line seems to be holding support. As such the rally that begin yesterday has swung into action during Europe’s late morning.
If MNQH23 can remain above the 11169 VWAP line, then chances are good that 11316.25 is bested and a target of 11376.50 and even 11453.50 can be had if buyers become aggressive. If not we could literally fall back to the VWAP line at 11169 VWAP line and rechallenge the lows around 11094.25. Whether it falls back to 11034 or 10957 would depend on how aggressive sellers become. That might have to wait until tomorrow’s economic data comes out. (and it could run the gauntlet and rally much higher. If the 11499.25 VWAP level can be taken out, then another at 11773 can be attained if a sustainable rally ensues. Only time will tell.
I was long profitably yesterday after the mini-selloff happened. Today, I will trade on either side of the market this morning, but if nothing shows by 1100 EST, I will be off to other business.
More is coming soon.
Economic data courtesy of Econoday dot com
MBA Mortgage Applications
7:00 AM ET
Atlanta Fed Business Inflation Expectations
10:00 AM ET
EIA Petroleum Status Report
10:30 AM ET
4-Month Bill Auction
11:30 AM ET
10-Yr Note Auction
1:00 PM ET