

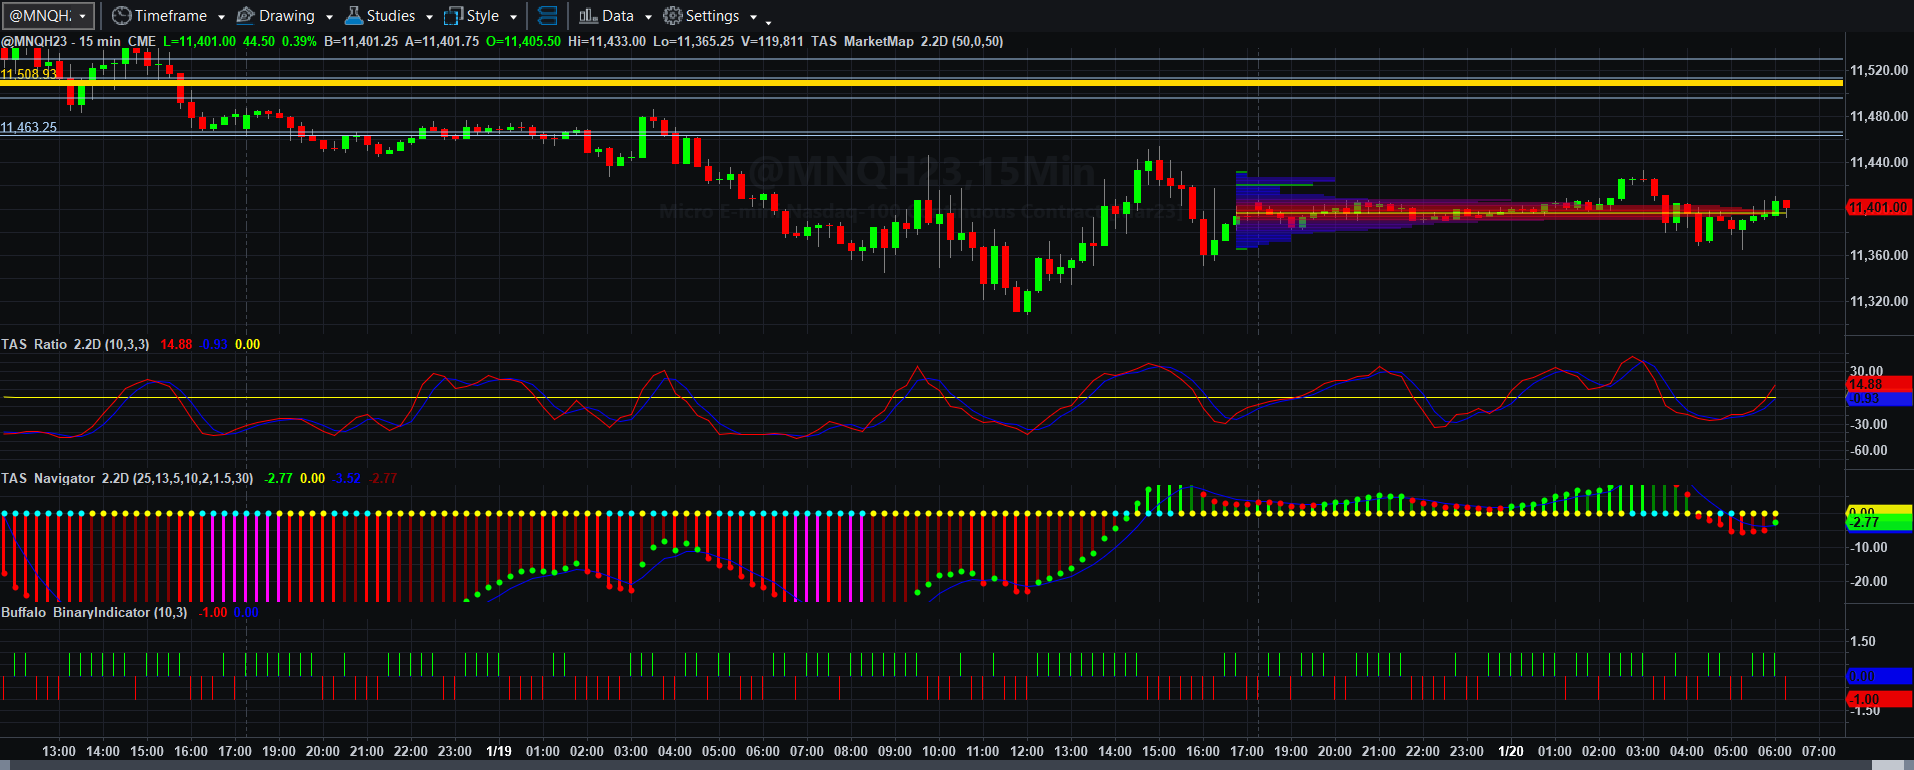
Price, Price Spread, Lagged Prive/volume Spread, and Binary Price/Volume Indicator
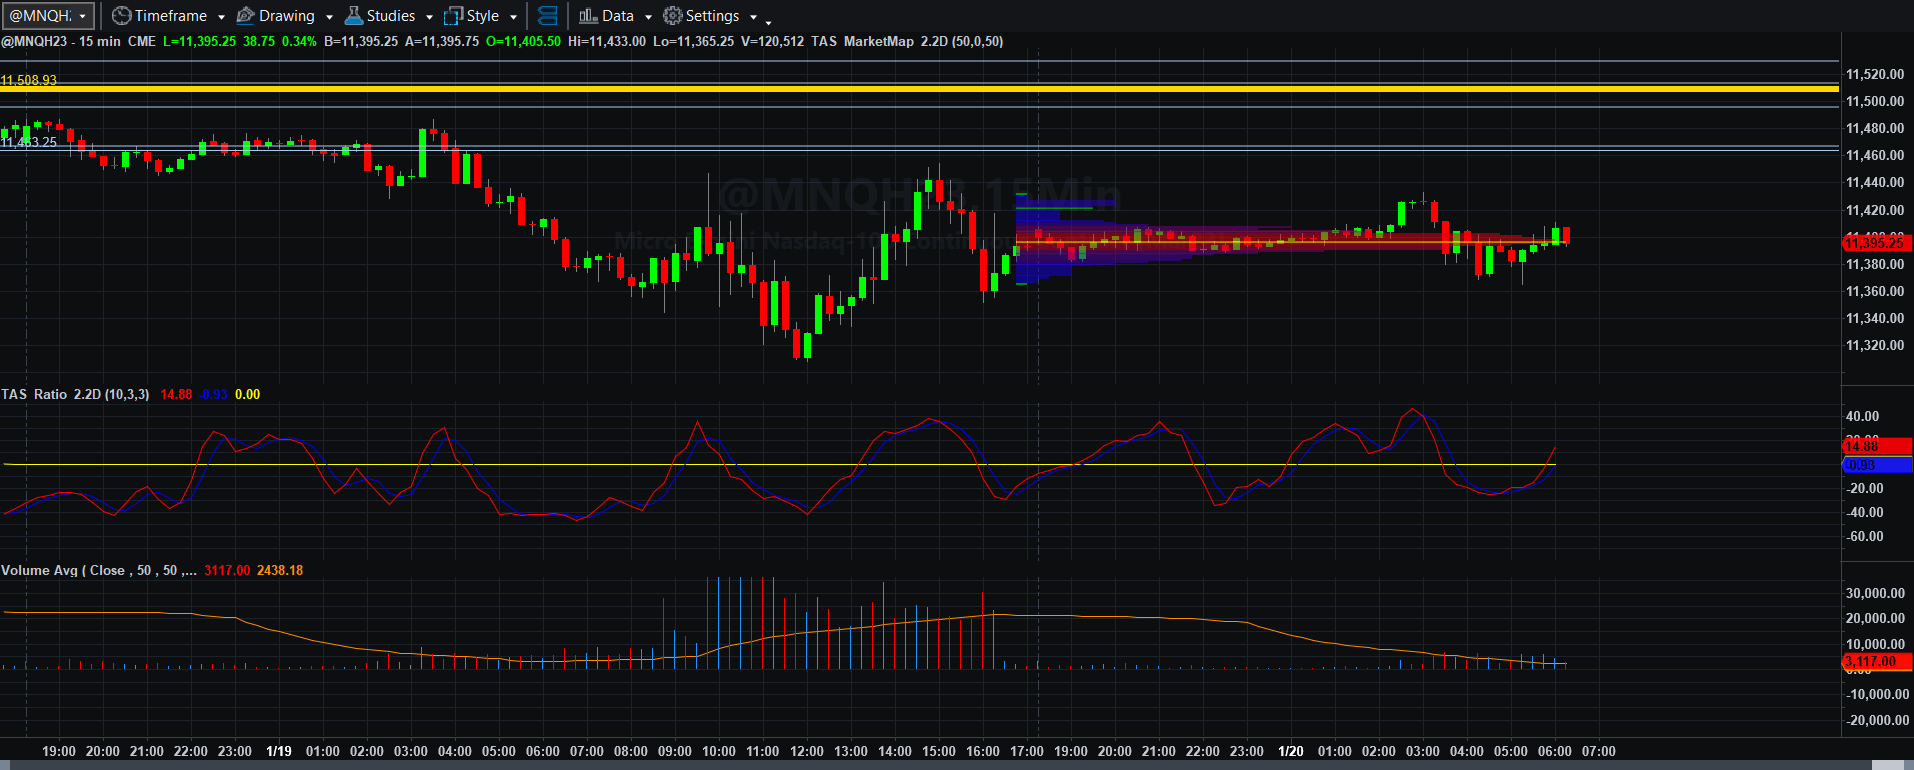
Price and Total Volume With 50-period Moving Volume Average
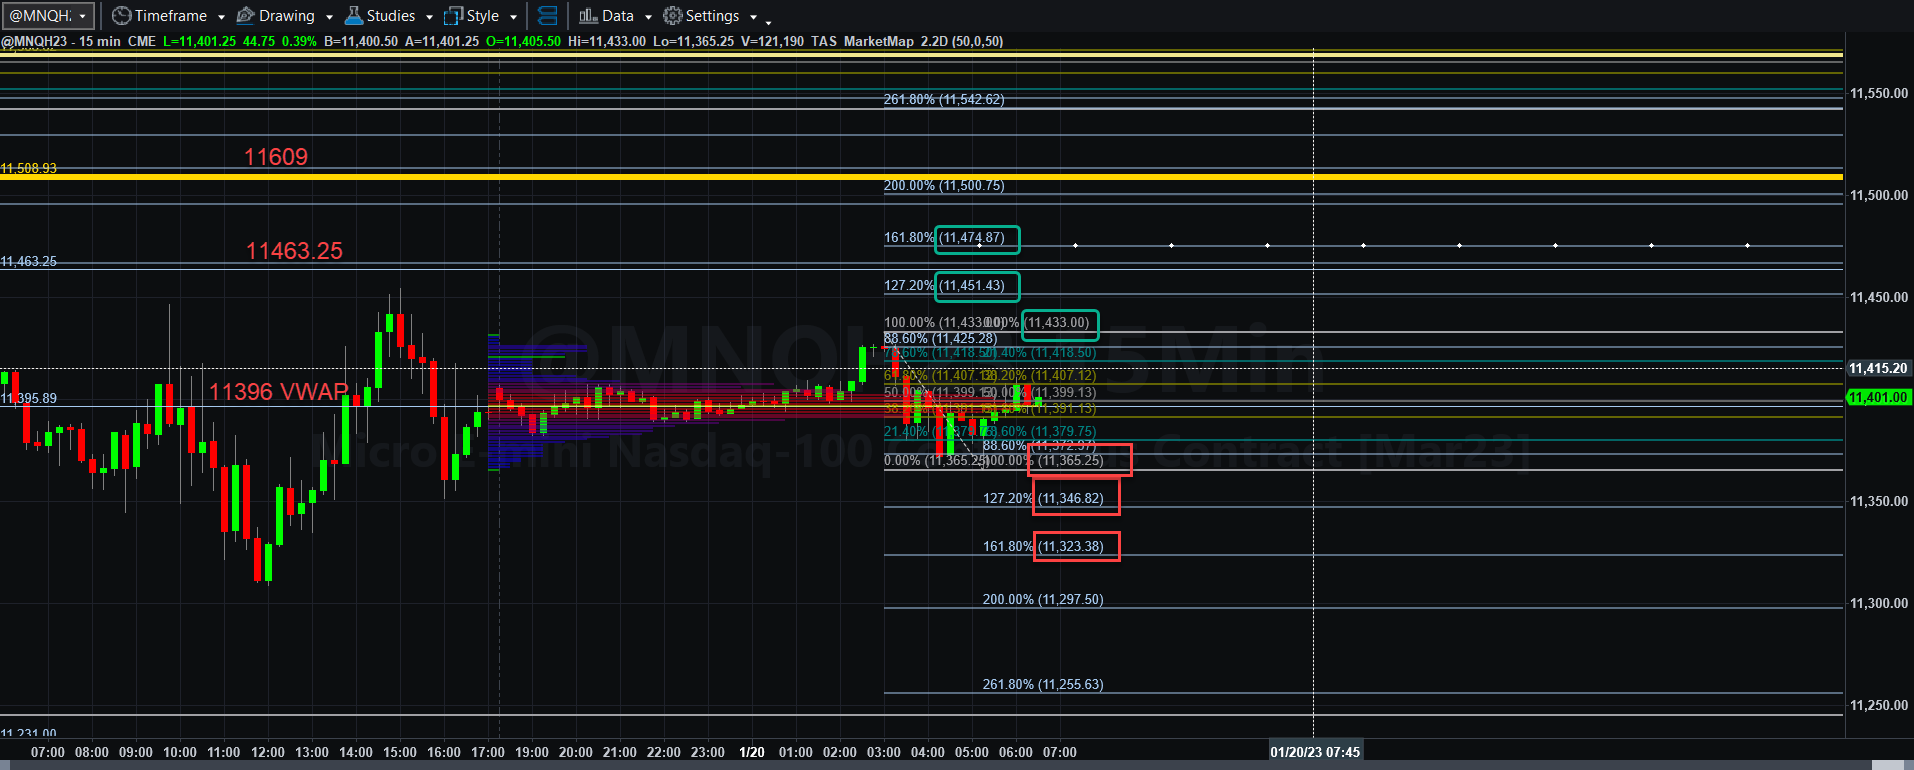
Fibonacci Price Scale With Targets
Ran into technical problems this morning, and ran 15-minute charts as I rebooted the platform. As it turns out this morning, the hourly and 15-minute charts show jointly similar swing highs and swing lows, so the targets are not too far out of the ballpark for daily estimates.
With all the worries about potential inflation (and in the case of PPI the false notion, in my opinion, of deflation), Federal budget concerns, tech company layoffs, and every other crazy event in the current US economy, traders decided to dump stocks, and the MNQH23 projected lows of yesterday that I pointed out got hit. Overnight, Asian traders continued to sell, only to be somewhat rebuffed by European traders that managed to put a floor on selling, at least temporarily. Things are neutral to slightly bearish in volume and price momentum. Today is a light news day, so we will have to see how traders react at the 0930 EST market opening.
If MNQH23 can remain above the 11396 VWAP line, then there is a decent shot that 11433 and 11451.50 can be target highs, perhaps even getting to 11475 and beyond by Monday. If not, and sellers take control again, it could be a short trip back to 11365.25, 11347, and even 11323.50 by Monday.
Since today is Friday, traders may just square up positions after a crazy week and walk today, not rocking the boat as much as on previous days this week. We will simply have to watch.
I was long yesterday after the initial swing down, captured the profit, and left the market. If I see something I like, I will trade it, but if not, hands off the keyboard for me.
More will be coming soon.
Economic Data Courtesy of Econoday dot com
Patrick Harker Speaks
9:00 AM ET
Existing Home Sales
10:00 AM ET
Baker Hughes Rig Count
1:00 PM ET
Christopher Waller Speaks
1:00 PM ET