

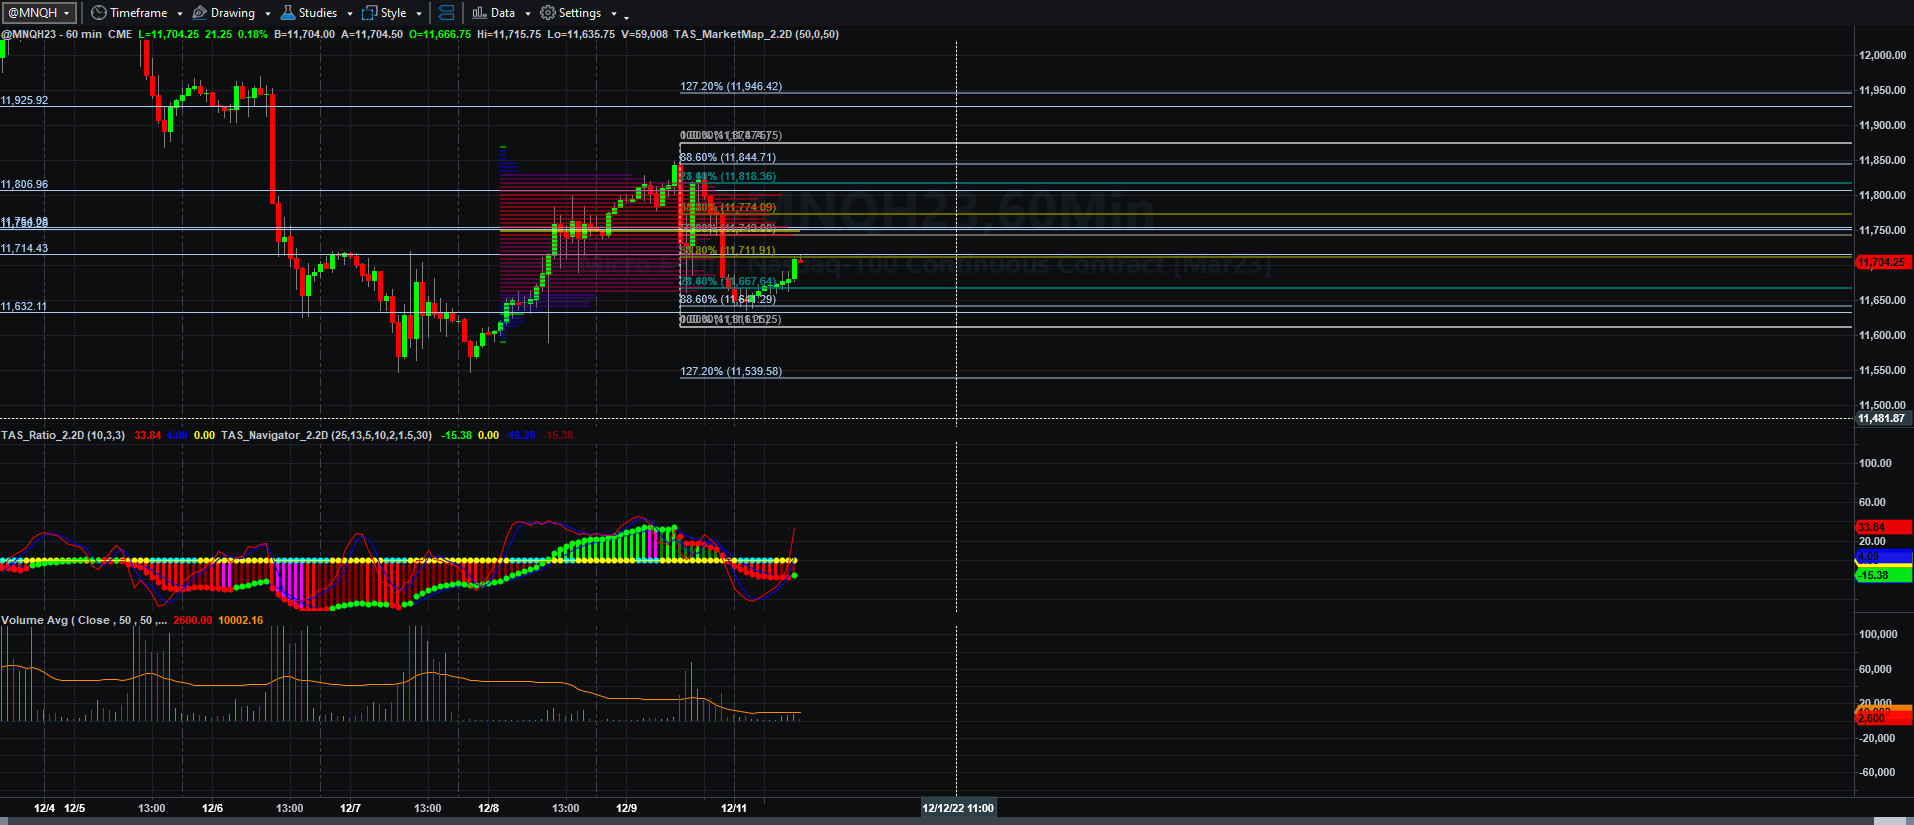
Hourly Chart with Volume and spreads (ratio on top of the price spreads):
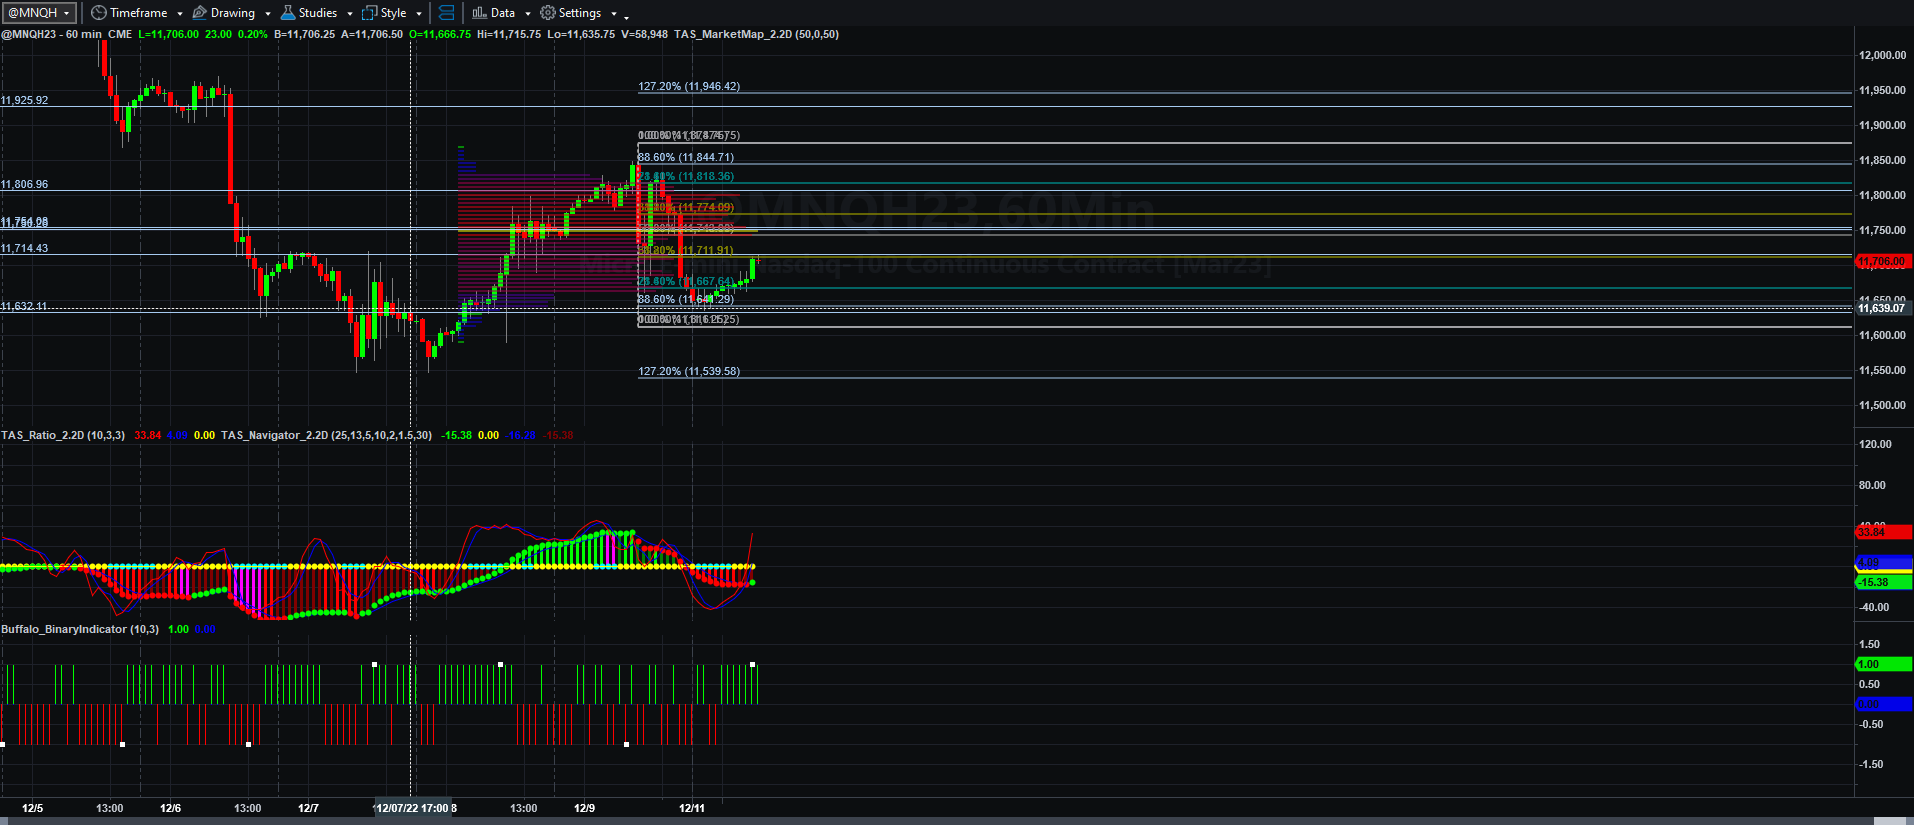
Hourly Chart with Binary Indicator and ratio/price spreads
Hourly Charts with Price Levels and Fibonacci Price Scale
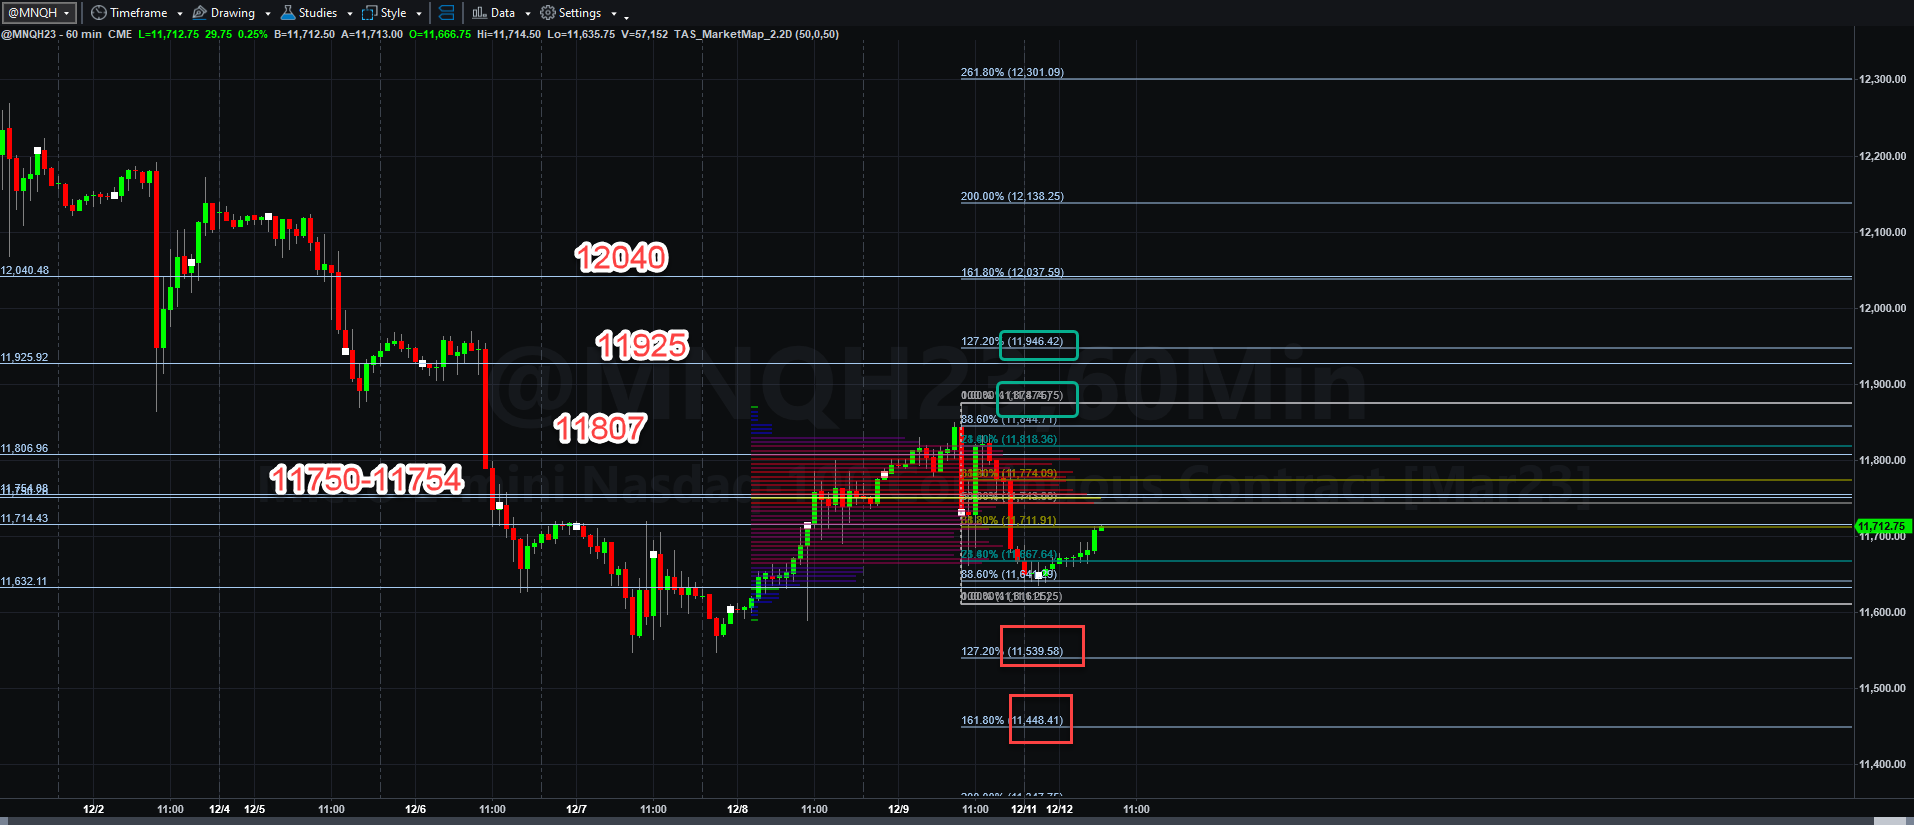
The hourly chart shows that a ton of very closely nested VWAP lines from the past couple of months could cause a roadblock to rallies if buyers do not get busy and worth through them. If MNQH23 can get through a cluster of VWAP lines around 11750 and11754 It has a decent shot of taking out 11807 and the old high of 11874.75 to rally to perhaps 11925 and 11946.25 where another cluster of VWAP lines exist. If that can be done, then there should be clear sailing into the 12-handle should the Fed act dovishly in its rate decision. What are the odds of that? I have no clue, and neither do the “experts”.
If it cannot break through the cluster at 11750-11754. MNQH23 likely falls back to the lows at 11611.75 back to 11539.50 and perhaps even 11448.50 if sellers predominate.
Trading volume needs to pick up if any strong rally takes hold. Once again, we will have to observe if that happens. Otherwise, last week’s spate of failed breakouts in either direction will take trading tough. Unless a trade looks perfect by means of my trading plan, I will stand aside and return the next morning. I have much to do otherwise.
More will be coming soon.
Economic Data provided courtesy of Econoday dot com.
6-Month Bill Auction
11:30 AM ET
3-Yr Note Auction
11:30 AM ET
Raphael Bostic Speaks
12:00 PM ET
3-Month Bill Auction
1:00 PM ET
10-Yr Note Auction
1:00 PM ET
Treasury Statement
2:00 PM ET