

ALL CHARTS FOR MNQH23 ARE HOURLY CHARTS.
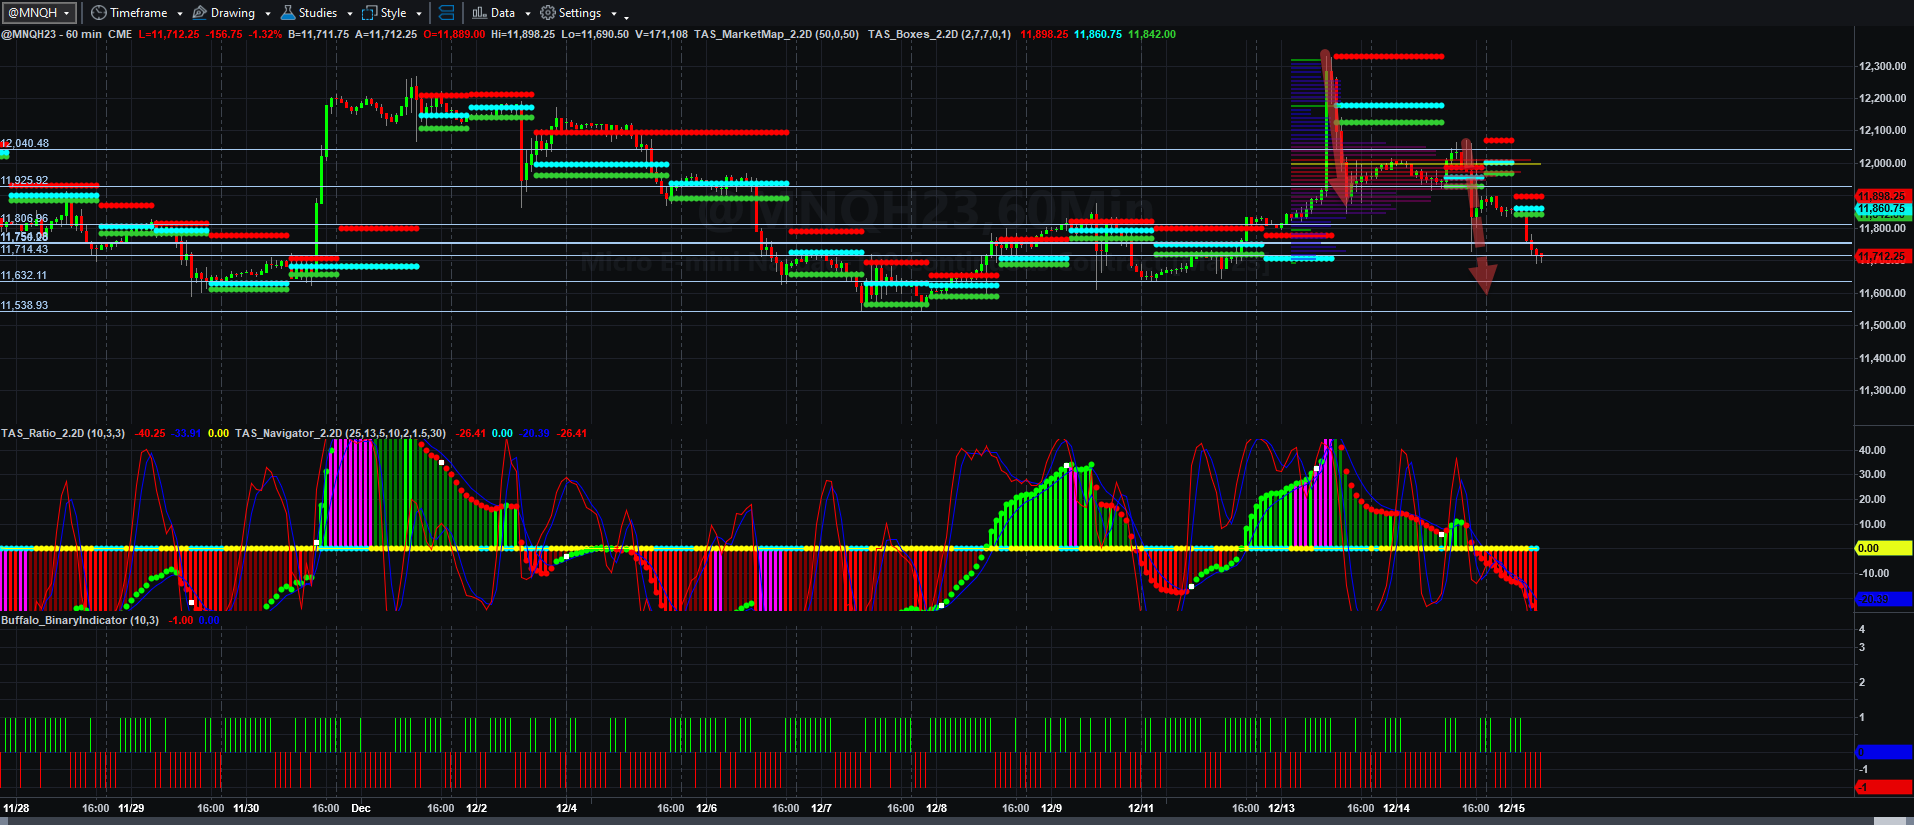
Below you see the volume profile with Fibonacci patterns, price volume spread (lagged) on top of price spread, and Binary Price Volume Indicator:
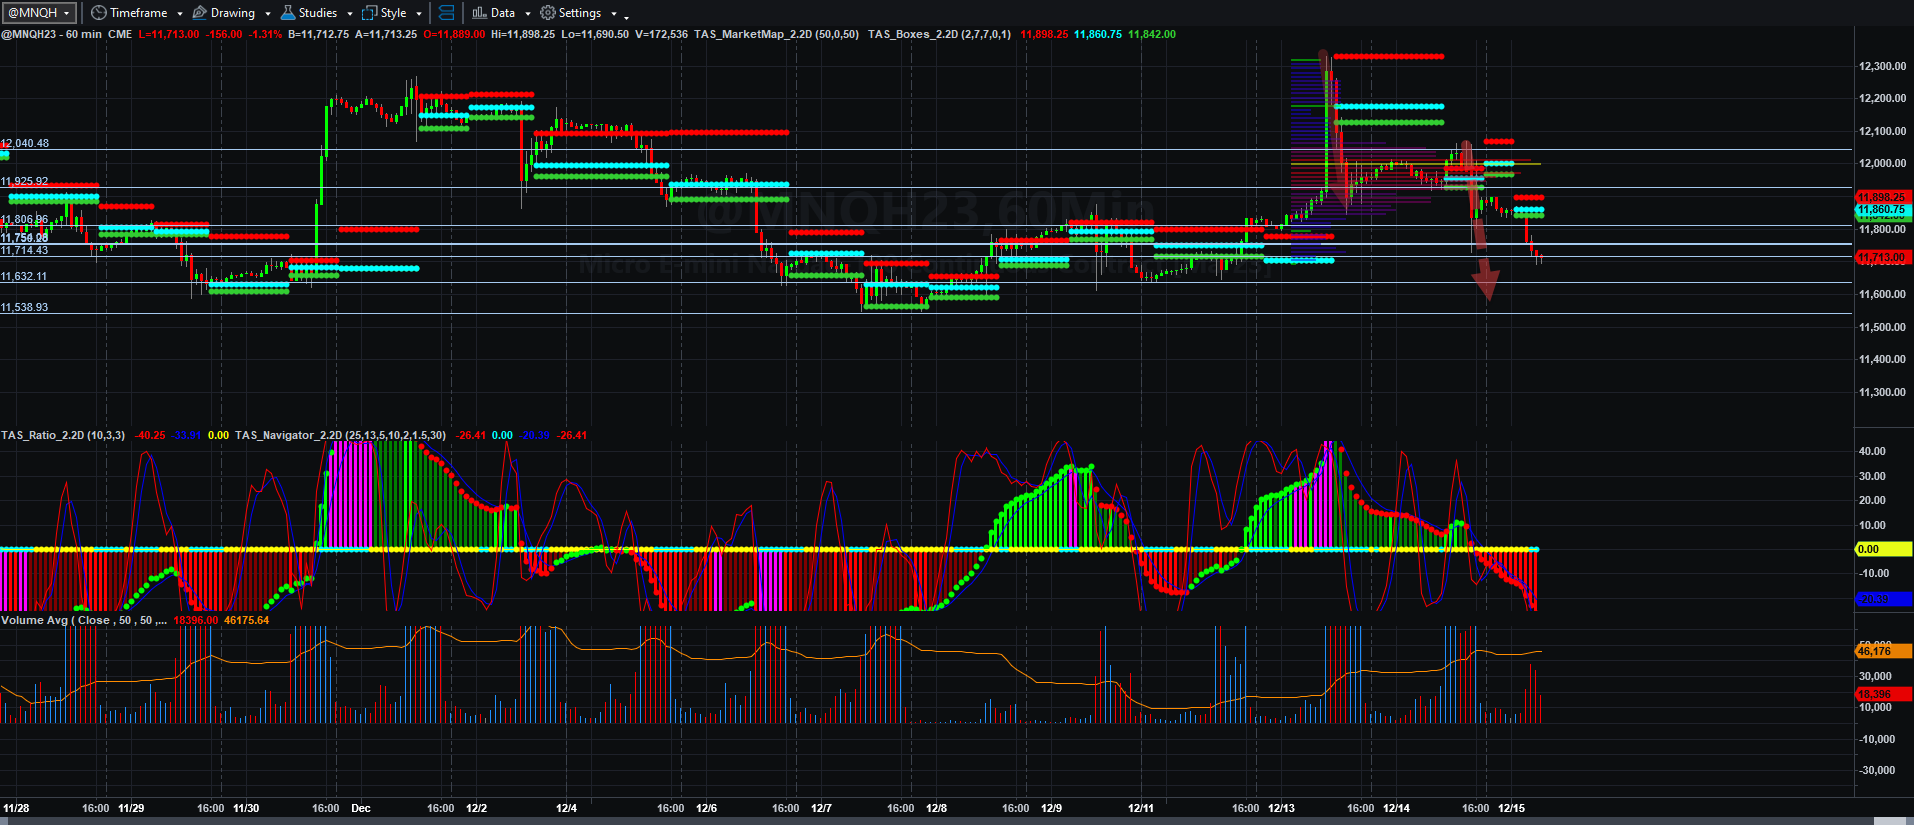
Below you see the volume profile with Fibonacci patterns, price volume spread (lagged) on top of price spread, with Up (Blue) and Down (Red) volume with a 50-period moving average:
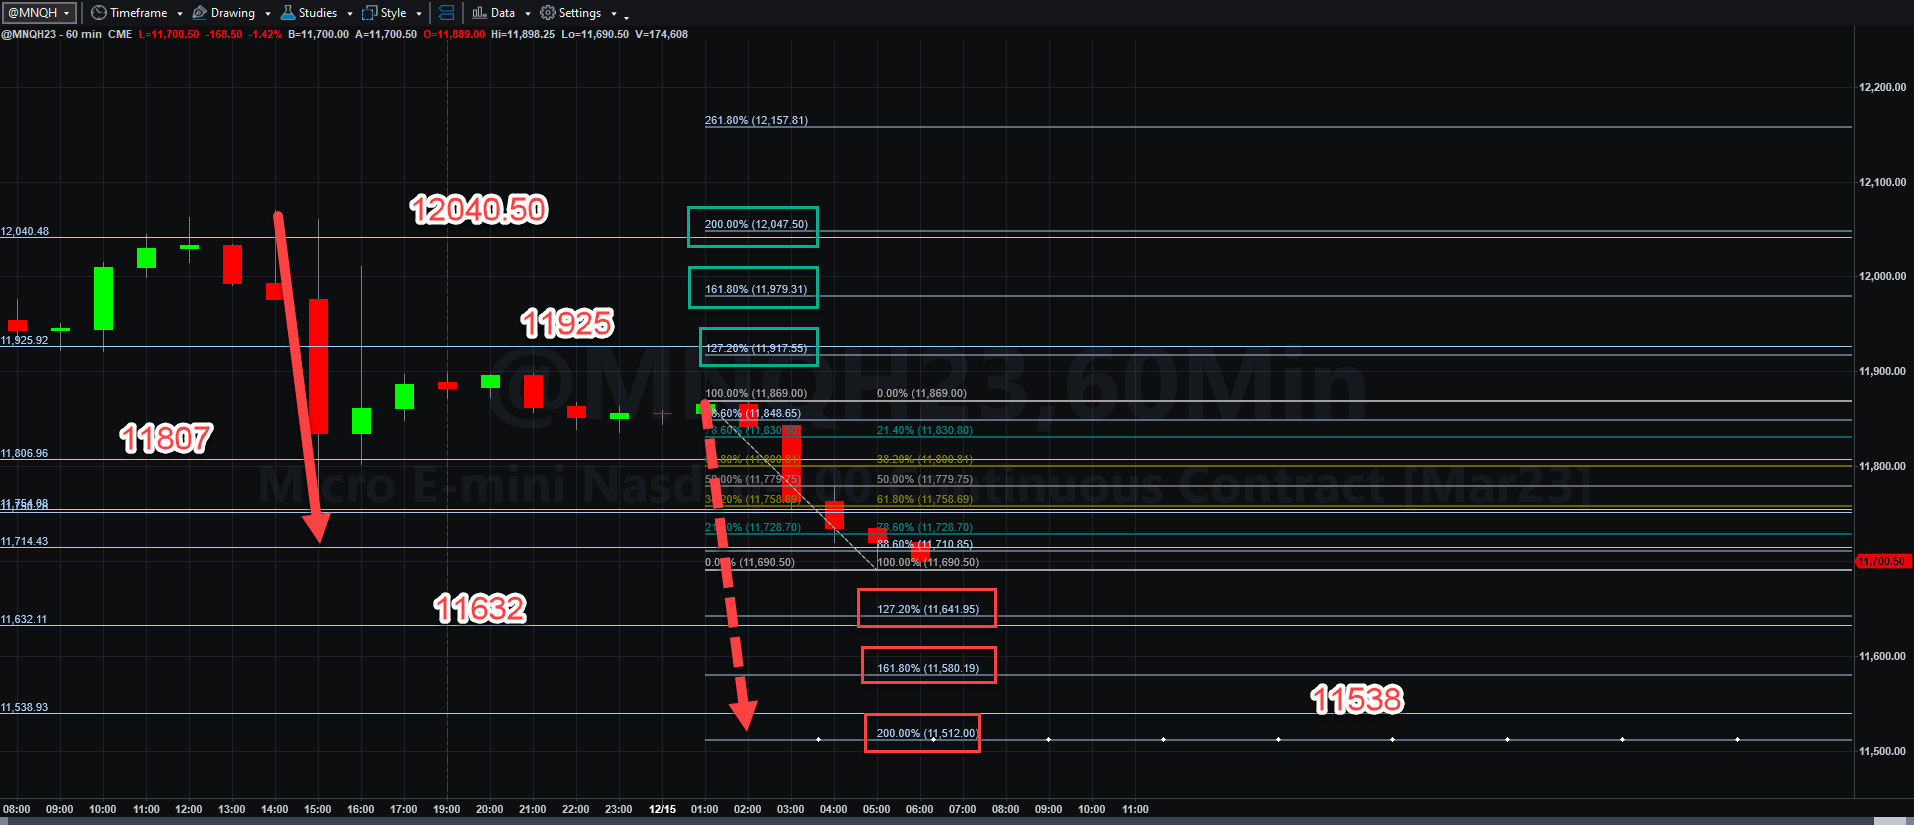
And the last is the Fibonacci price scale with AB=CD pattern indicated in overlay:
After yesterday’s “kinder and gentler” 0.5% Fed rate hike announcement, it appears the Asians and in particular, the Europeans would have nothing of it and continued to sell into the current hour. The charts are oversold on slightly higher than usual volume.
We may have an hourly AB=CD completion coming if sellers dominate, but if they do, they will find pretty strong price support around a VWAP line that existed back in September of this year, somewhere around 11512. If we continue to see selling, we will likely take out 11690.50 and head at least to 11642 and back even to 1158i0.
If jobless claims and manufacturing data are considered dovish in terms of future rate increases, then I think we have a chance to recapture at least 11800 to 11807. After that, bulls will have to drive hard to get back to 11869 and perhaps to 11917, as there is considerable VWAP and price structure resistance at 11917 and 1125.
I will get into what implications the wild swings that lead us nowhere on MNQH23 are all about. I think institutions may be seeing through the wonky BS and see the challenges ahead that the Federal Reserve and this Administration do not see, or perhaps see and do nothing about.
More on that later. I did decently yesterday short and long, but I may do nothing today unless I see something that fits my trade plan in terms of volume, price momentum, and pattern. We will see what happens.
Economic data courtesy of Econoday dot com
3-Month Bill Settlement
6-Month Bill Settlement
3-Yr Note Settlement
10-Yr Note Settlement
30-Yr Bond Settlement
Jobless Claims
8:30 AM ET
Philadelphia Fed Manufacturing Index
8:30 AM ET
Retail Sales
8:30 AM ET
Empire State Manufacturing Index
8:30 AM ET
Industrial Production
9:15 AM ET
Business Inventories
10:00 AM ET
EIA Natural Gas Report
10:30 AM ET
3-Month Bill Announcement
11:00 AM ET
6-Month Bill Announcement
11:00 AM ET
5-Yr TIPS Announcement
11:00 AM ET
20-Yr Bond Announcement
11:00 AM ET
4-Week Bill Auction
11:30 AM ET
8-Week Bill Auction
11:30 AM ET
Treasury International Capital
4:00 PM ET
Fed Balance Sheet
4:30 PM ET