

This morning’s MNQH23 hourly charts look like they are still bearish but struggling to hold key hourly support.
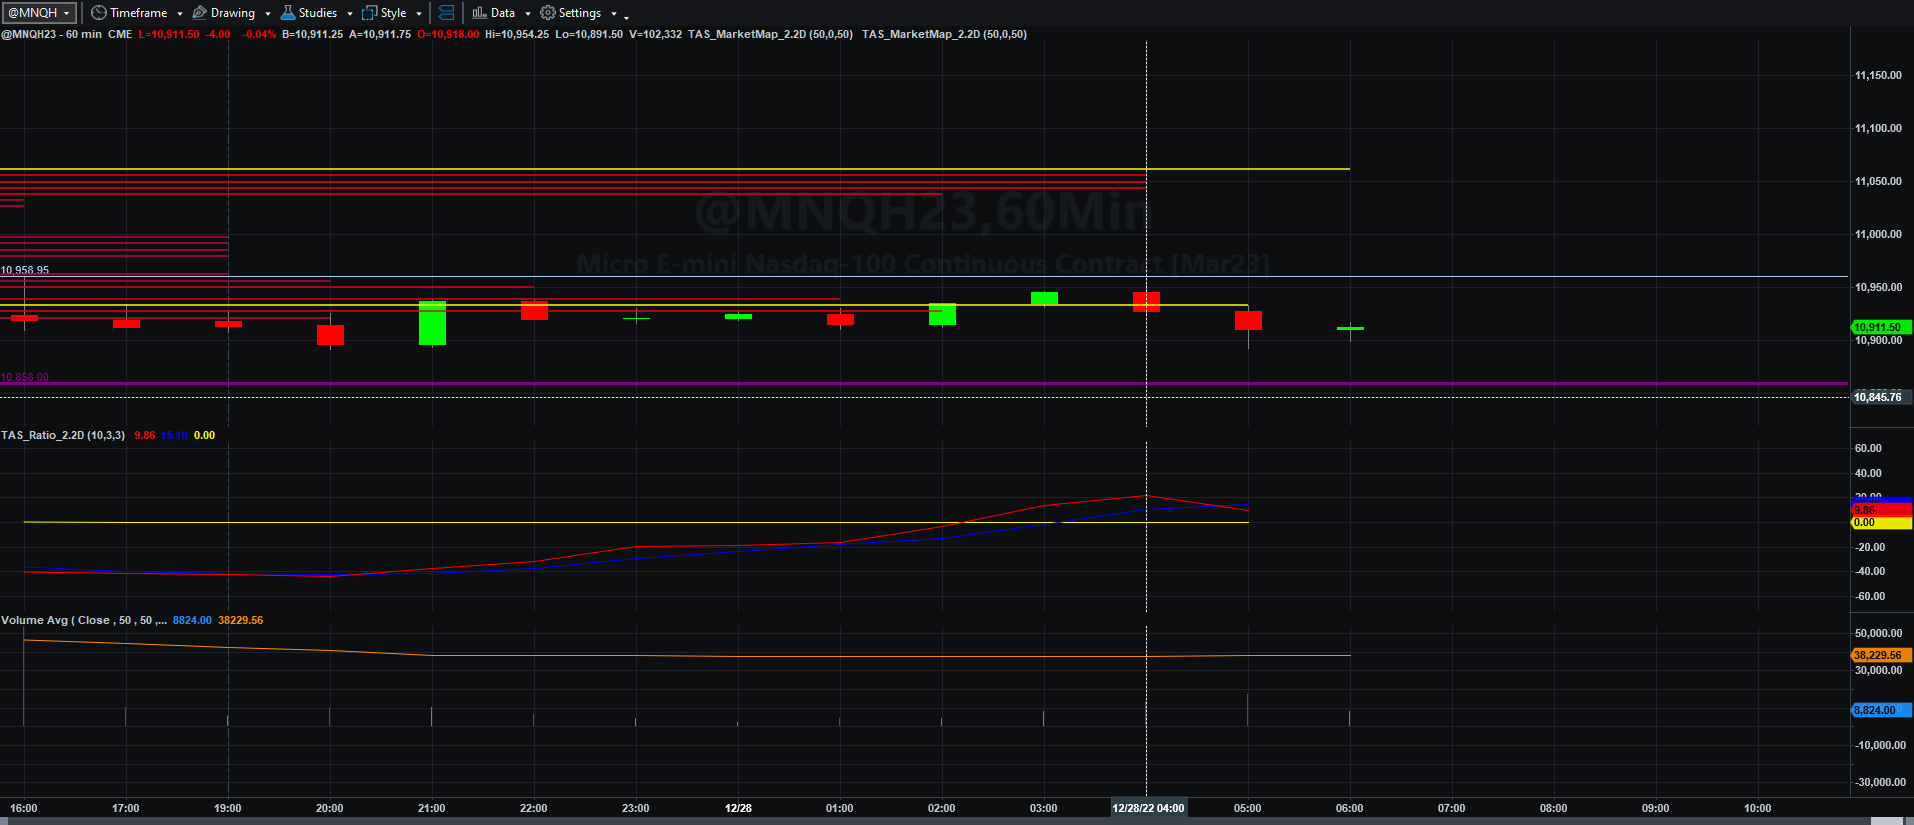
Hourly Data with Price Spreads, lagged volume and price data, and the price/volume binary indicator
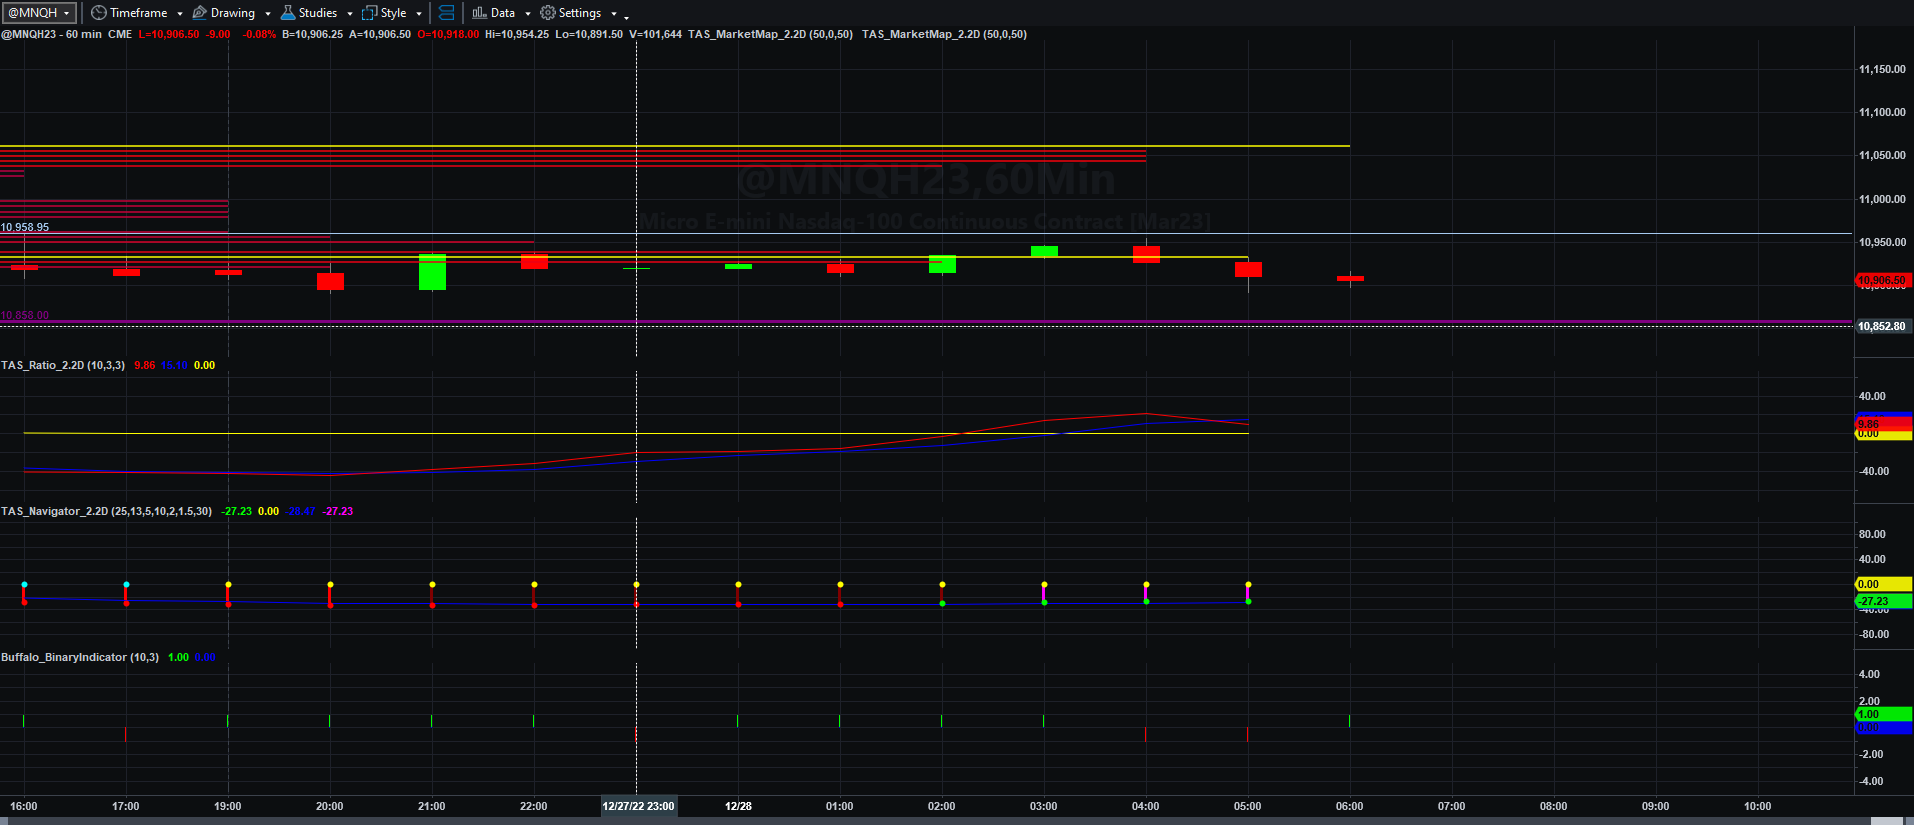
Hourly price data with lagged volume and price data and volume with 50 period moving averages:
Hourly Price with Fibonacci Scale and Price Targets:
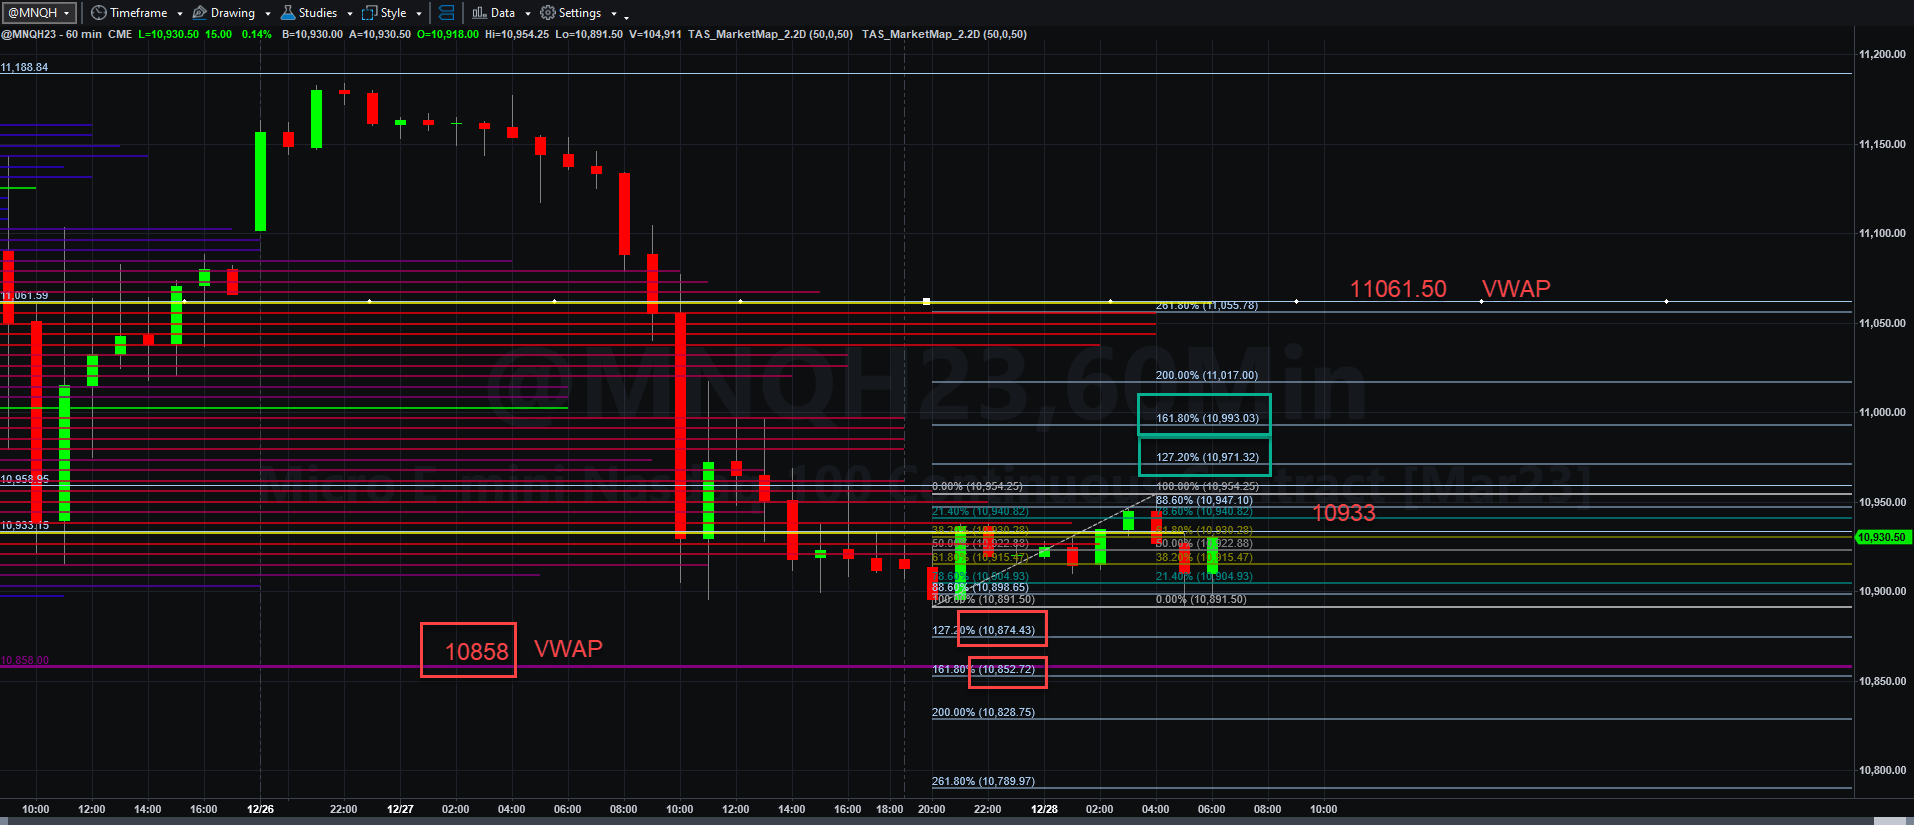
MNQH23, if it can remain above the 10933 VWAP line has a shot to really break out above the 10954.25 level and perhaps quickly regain 10971.25, 10993, or even higher, against that large afternoon selloff.
If not, it likely falls back to support at 10891.50 and back even to 10874.50 and 10852.75. We would then be inside that support zone between 10858 and 10608.50. Beyond that, there are larger price levels between VWAPs and prices could fall faster, perhaps back into the 9-handles at the extreme.
NO ONE KNOWS WHAT WILL HAPPEN. All I can do is measure price levels and momentum and follow volume to Fib target levels. Who shows up at 0930 EST this morning will tell the tale.
More will be coming soon.
Economic Data courtesy of Econoday dot com.
Pending Home Sales Index
10:00 AM ET
Richmond Fed Manufacturing Index
10:00 AM ET
State Street Investor Confidence Index
10:00 AM ET
Survey of Business Uncertainty
11:00 AM ET
4-Month Bill Auction
11:30 AM ET
2-Yr FRN Note Auction
11:30 AM ET
5-Yr Note Auction
1:00 PM ET
Has not been a comfortable decline. Stops likely under747/\/ but those squeezezzz. Santa pop players getting played. But the spring is compressed. Who knows.