

Watch the video for an explanation of the lines. Some of you hate them, but they help you build a trading plan. Learn to embrace the hate. You may learn something.
The full display charts are shown first, and the Fibonacci spider web sines are shown in the second chart.
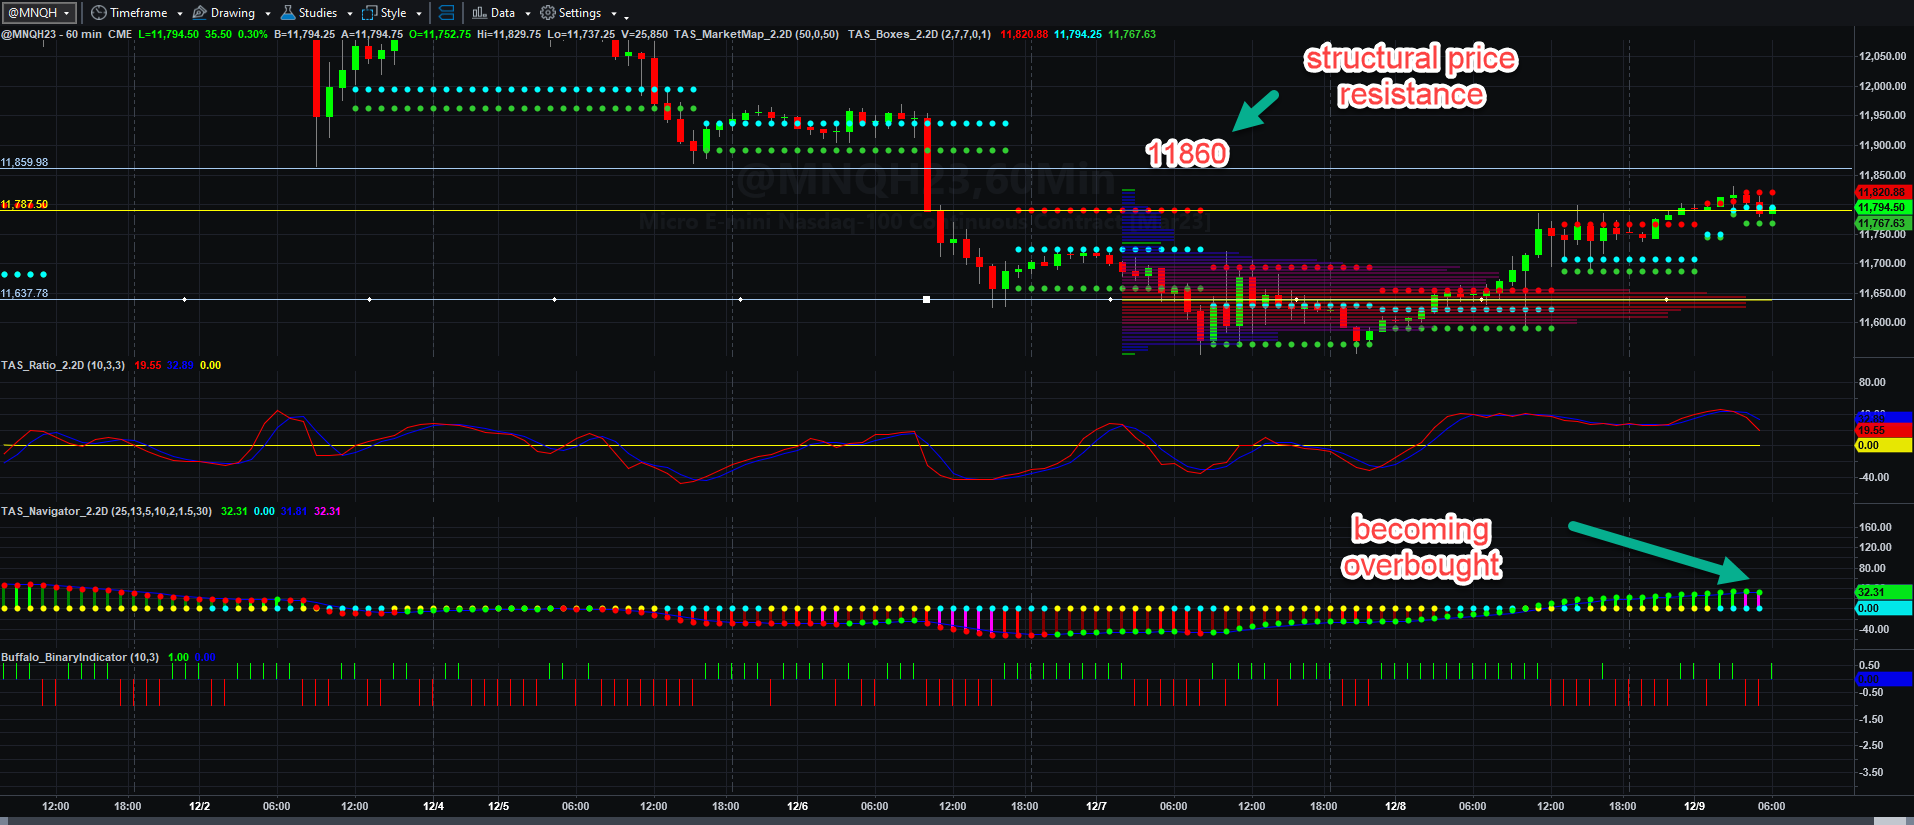
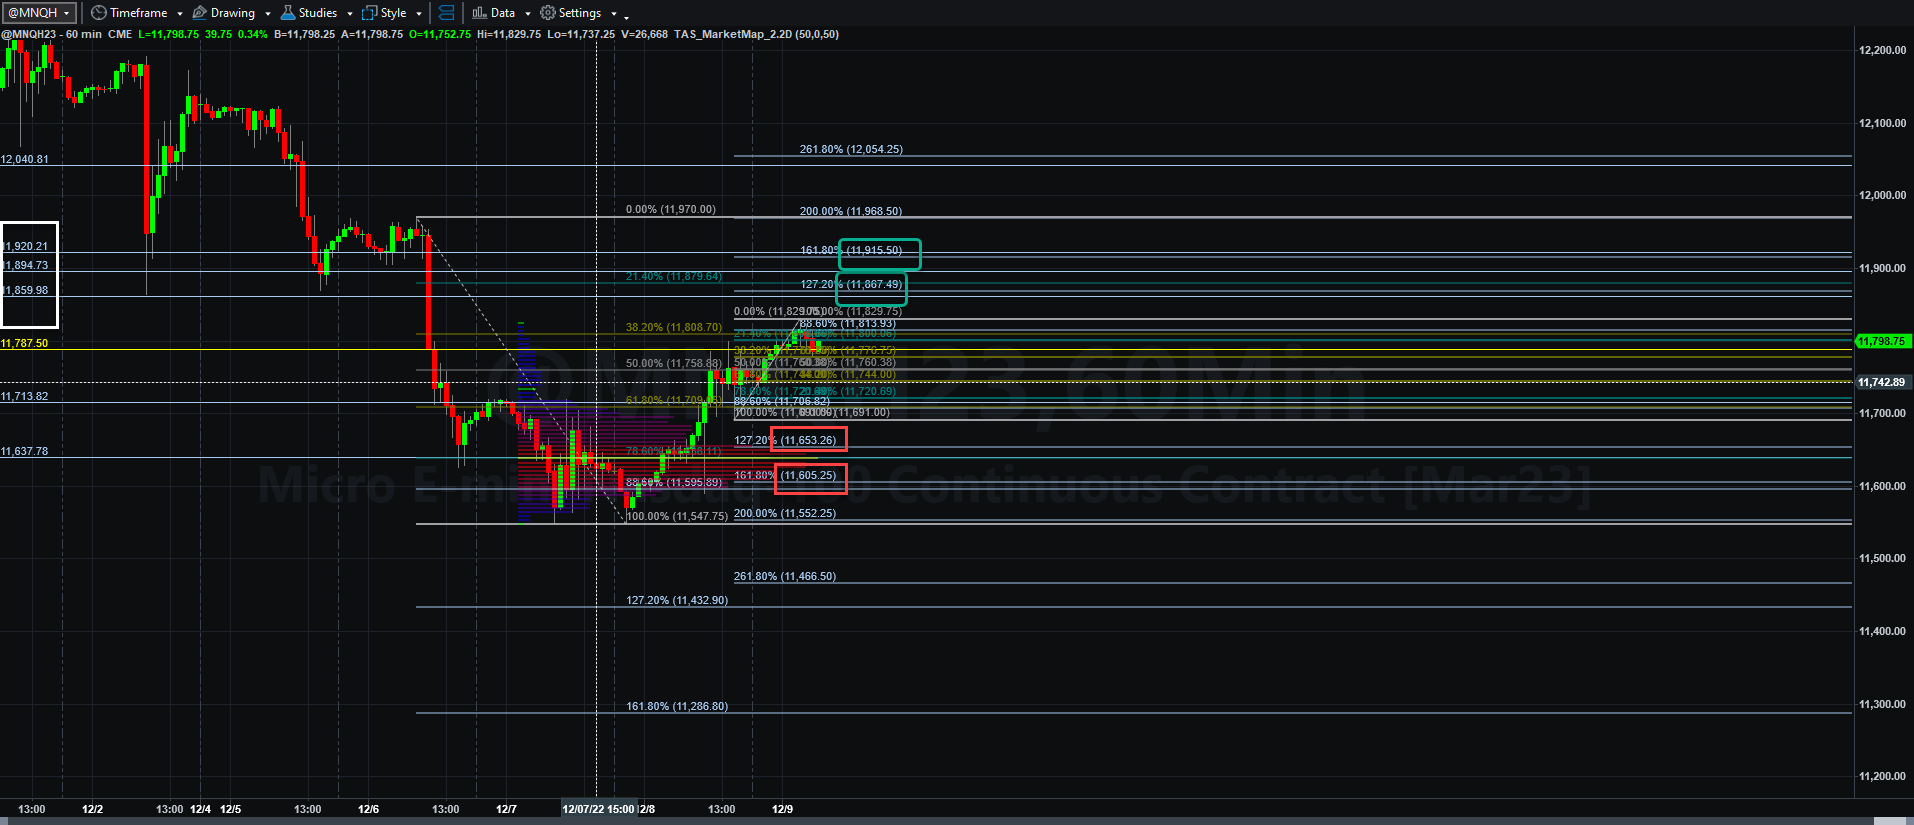
PPI may drive this and other equity markets early on, but no one is certain. If we can stay above 11637.75 and particularly above 11787.50 (referenced yesterday) then as long as buyers are active, there is a decent shot at hitting 11867.50 and 11915.50 or higher.
If not, and there is early price rejection by sellers, we could sink back to 11691 and roll back to 11653.25 and 11605.25.
We will have to see how economic data and earning hit going forward because we could just as easily rally as collapse. I am not very bullish on the economics, but I trade the charts, literally trading what I see. If no trade develops today, I sit on my hands.
I was bounced at breakeven yesterday on the short, but on the breakout long I took my 50 NQ point profit and left the building to work on other business.
We will see what happens today. More soon.
Data courtesy of Econoday dot com.
PPI-Final Demand
8:30 AM ET
Consumer Sentiment
10:00 AM ET
Wholesale Inventories (Preliminary)
10:00 AM ET
Baker Hughes Rig Count
1:00 PM ET

