

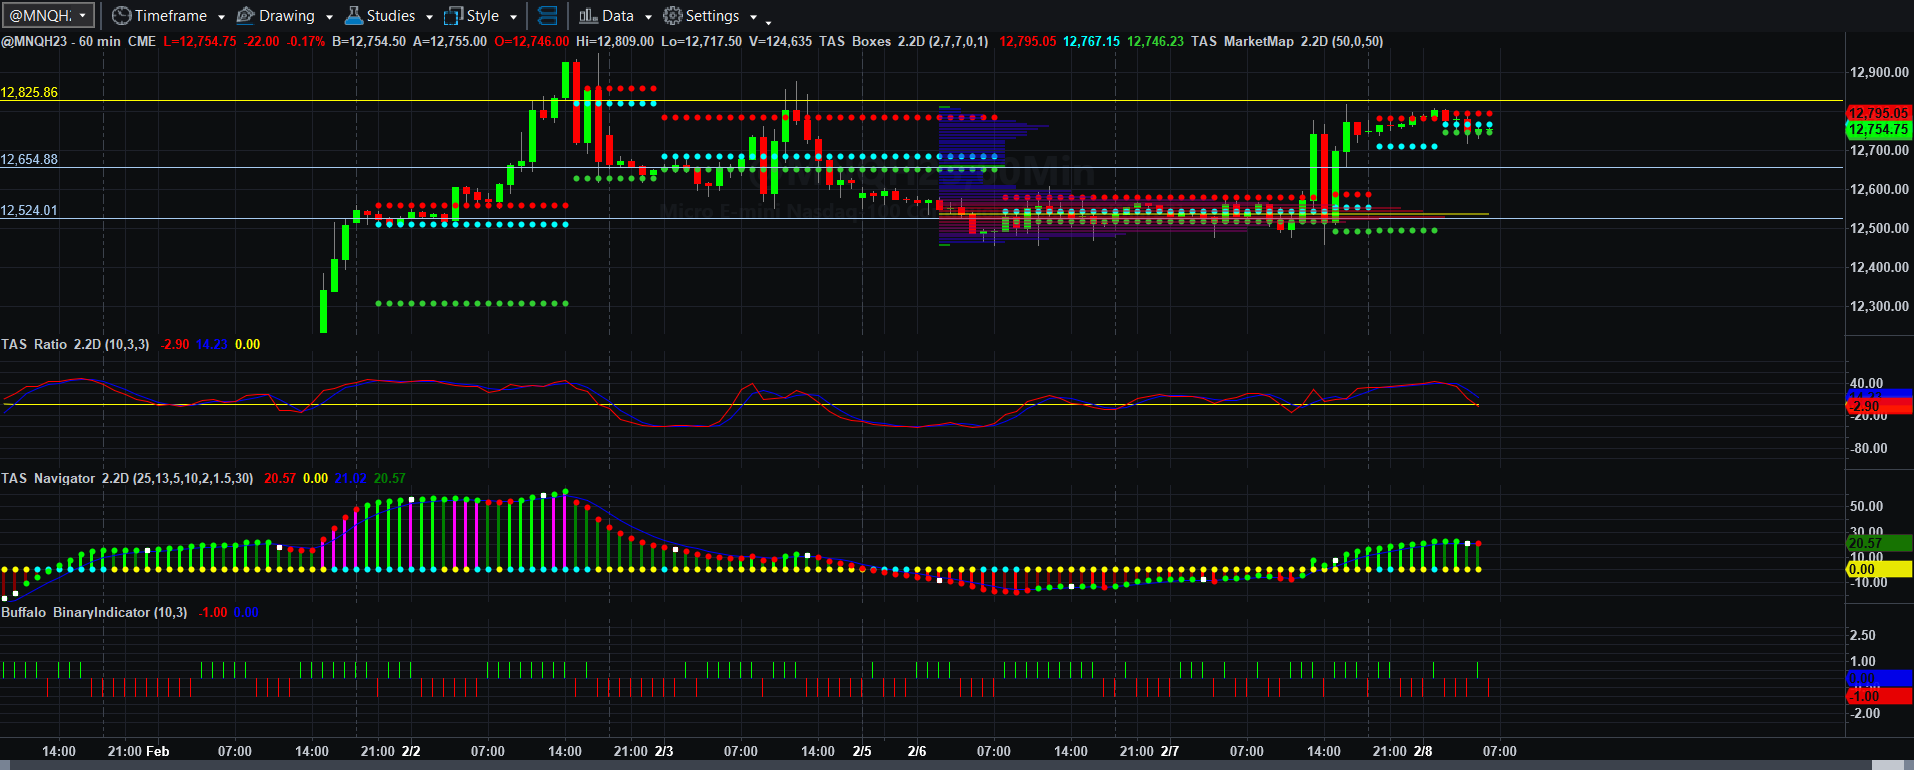
Price, Price Spread, Lagged Price/Volume Spread, and Binary Price/Volume Indicator
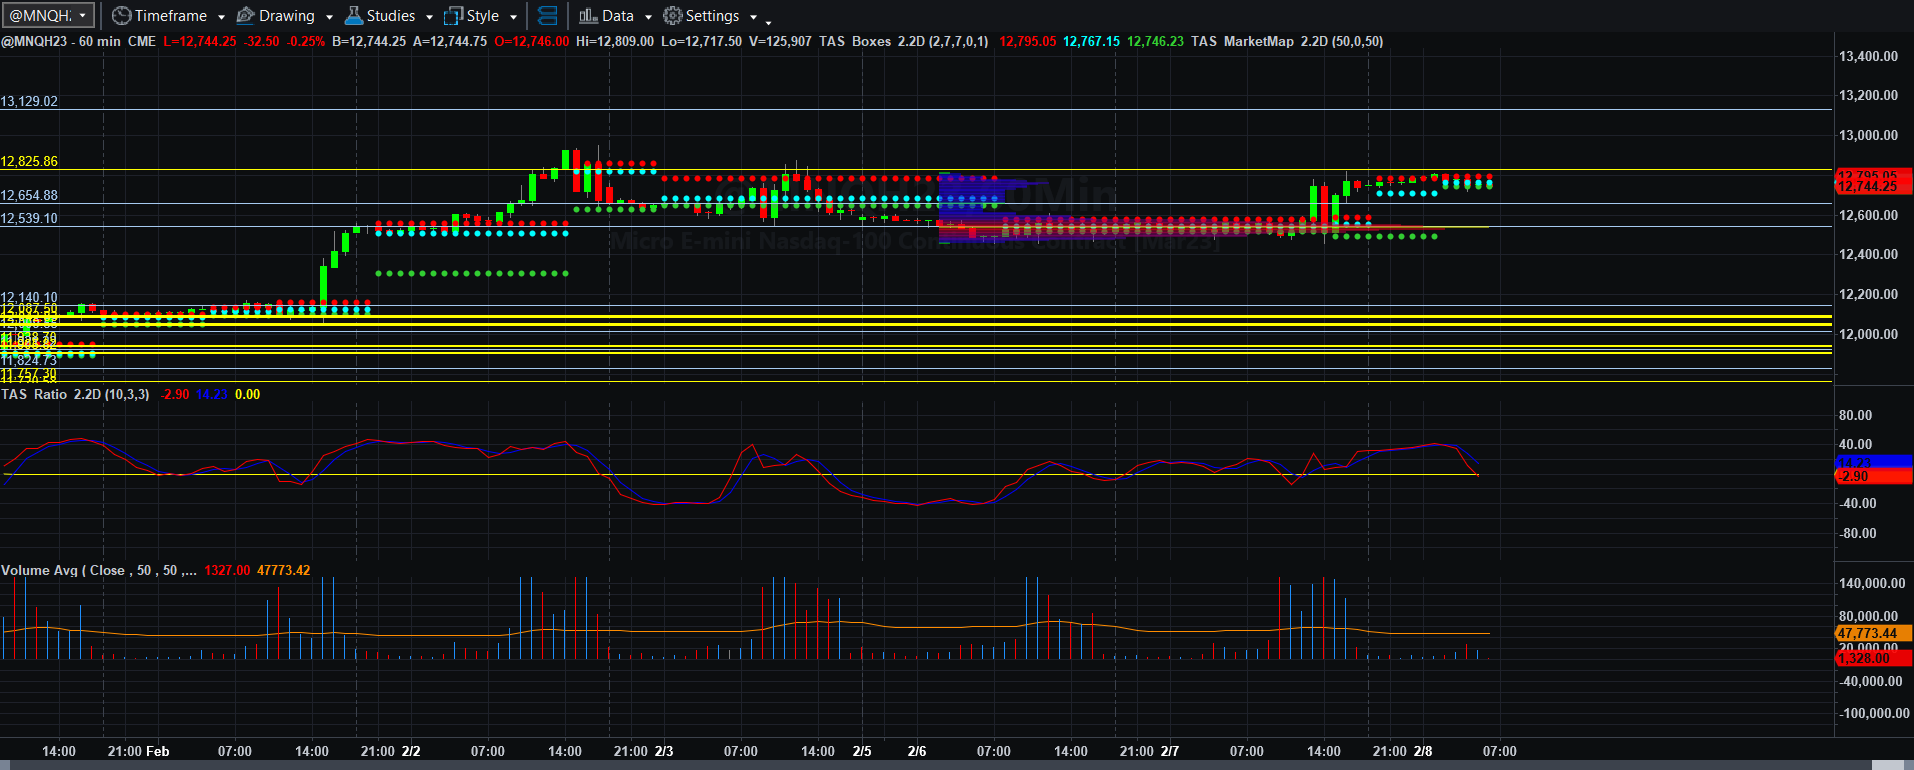
Price and Total Volume With 50-period Moving Volume Average
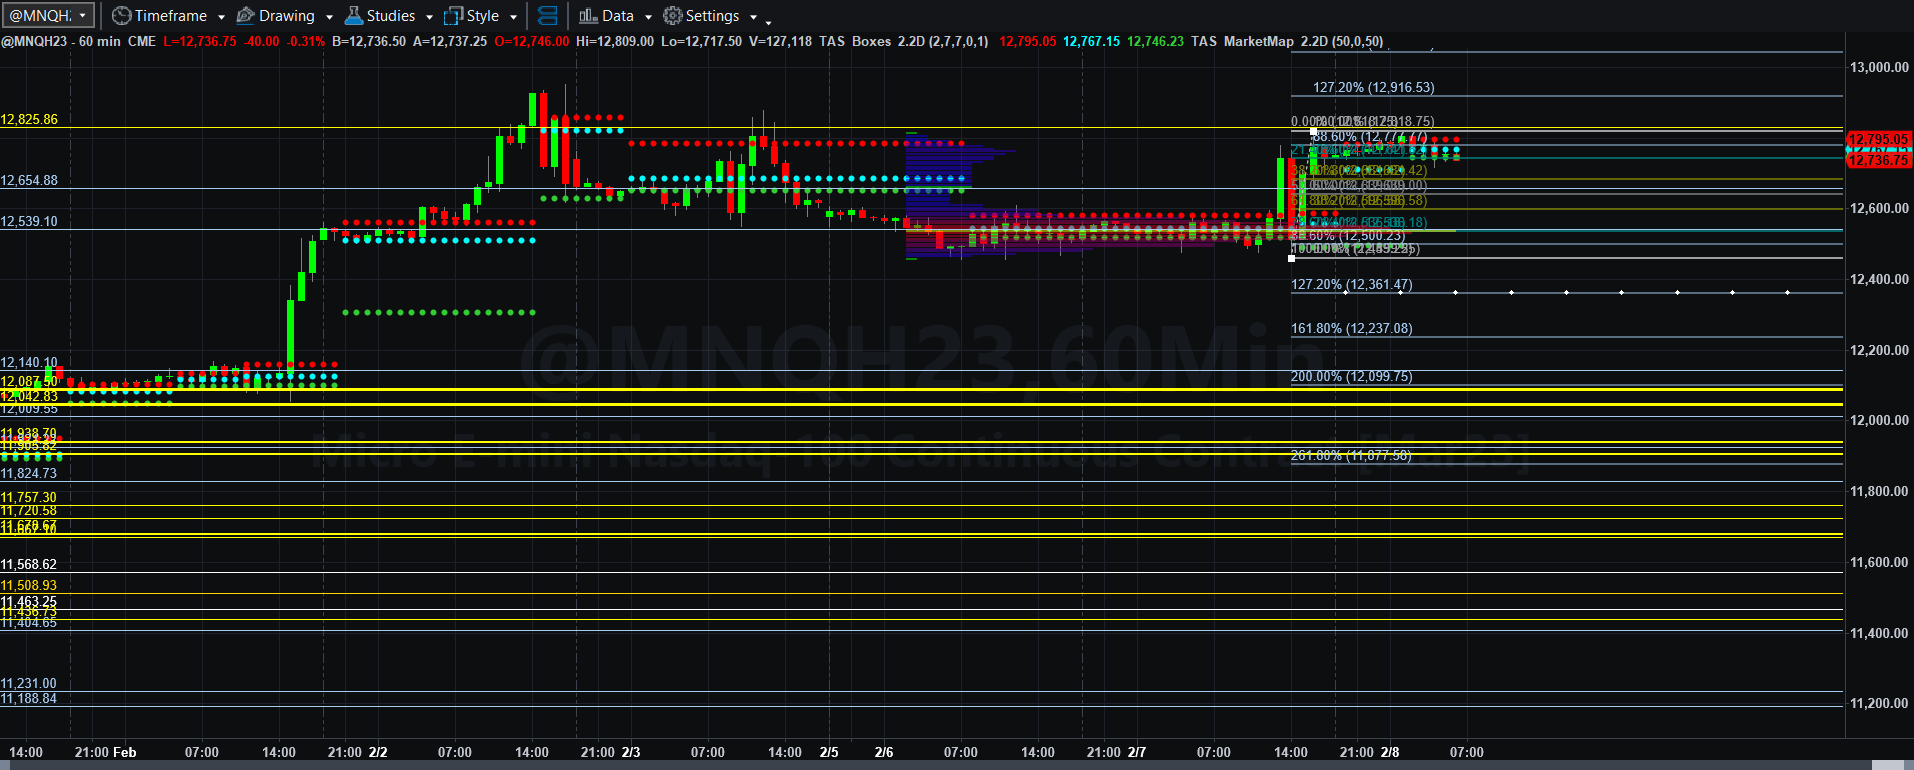
Fibonacci Price Scale With Targets (and the insane VWAP levels on all sides of current price action.
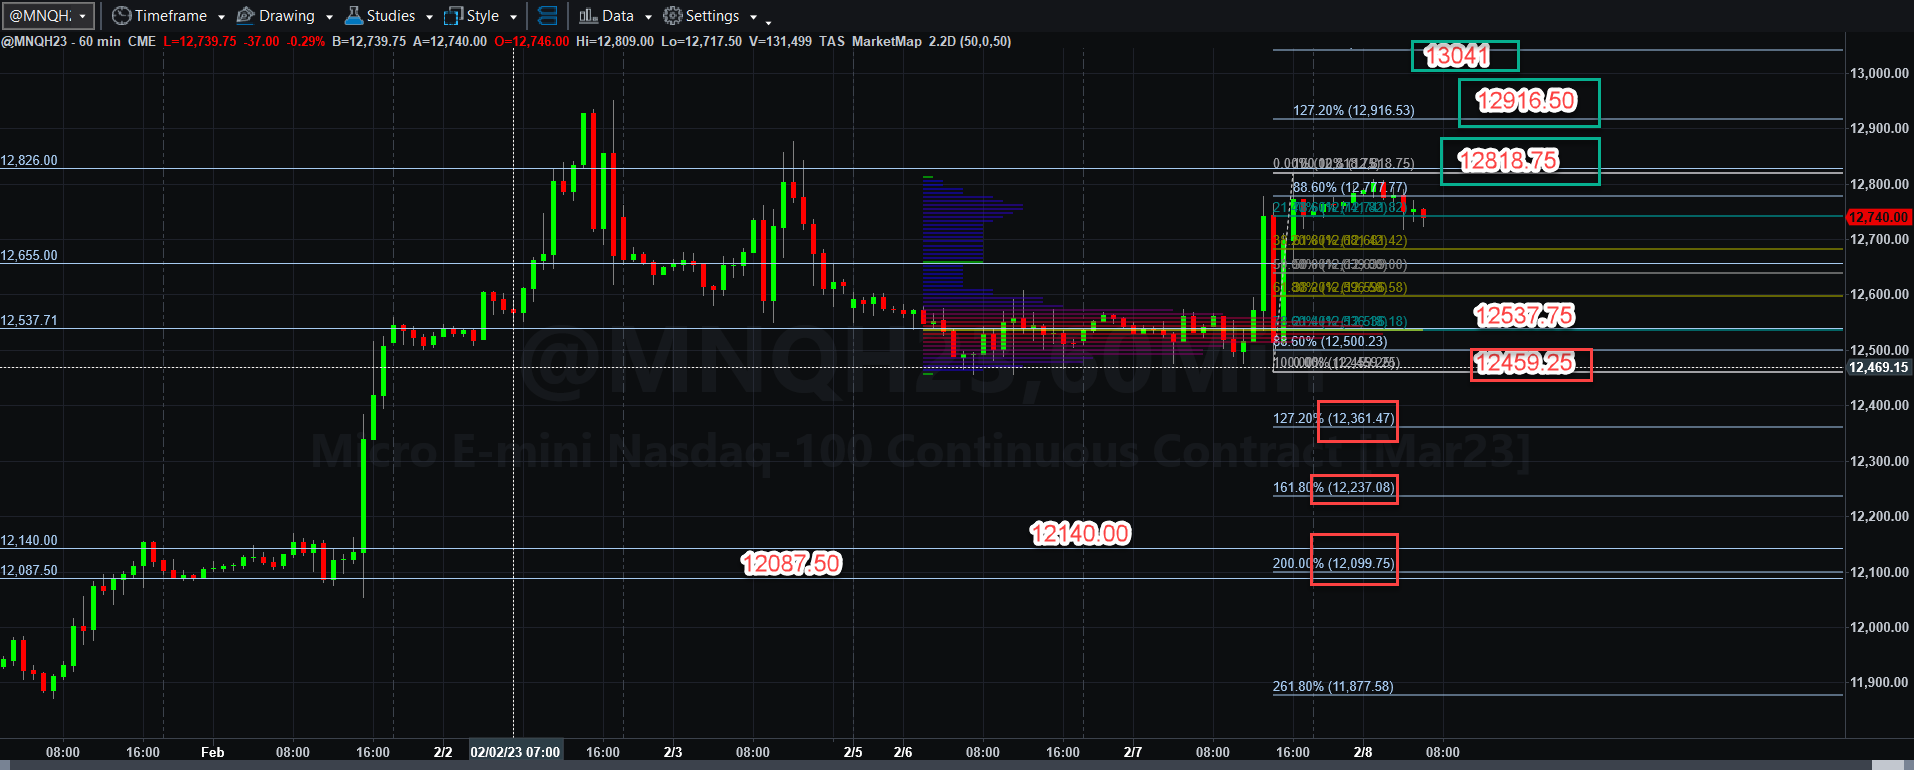
Fibonacci Price Scale With Targets (with a clean chart)
It appears that overnight there might have been a rally in MNQH23 before the State of The Union speech and then a mild selloff after 0000 EST, but this market is still walking the tightrope. I am still pretty certain that institutions and traders are continuing to weigh the possibility that the data our Federal government is providing us could be bogus, but for now, as long as the free money (after inflation is removed) flows, there will be an attempt to continue the rally that began at the start of 2023.
If MNQH23 can remain above the current hourly 12537.75 VWAP line, then this market has the possibility of easily blowing out 12818.75 to hit 12918.50 and perhaps 13041 by tomorrow (or today if buyers are aggressive). If not, it could be a very short trip back to that 12537.75 VWAP line if some news is bad out there, and then perhaps back to 12459.25, with 12361.50, 12237, and perhaps even somewhere between the 12140 to 12087.50 area if sellers are aggressive.
If you look at the “crazy’ Fibonacci scale chart above the one with prices marked up, you can see that the “jubilation gap (based on supposedly real unemployment numbers) between 12459.25 and 12140 is pretty wide and that below that there are tons of previous VWAP lines below that would add temporary support if a selling barrage were to hit.
We all need to remember that 10608.50, given current recent levels of volatility that have hit MNQH23 is not very far below all of those lines if sellers show up en masse. It could also run into the mid-14-handles too above where we are on a bullish surge.
What we must determine is whether the administration’s employment data is real, which in this podcast (that you should listen to) is called into question via reliable news sources). Fed policy and Congressional and U.S. Treasury policy are faced with dire circumstances if rates rise, and even more, dire circumstances if it is forced to take interest rates to or below zero again, as this blog post shows with Federal Reserve data. Both sets of data CANNOT BE RIGHT. Only one is a real picture of what the United States faces in as little as 2 to 5 years, and probably less if there is a major world conflict.
I will only trade what I see and will only trade to the extent that volume and price momentum give me in the first two hours this morning. I captured 39 NQ points long and walked away yesterday. Yesterday’s ranges proved to work even though we never broke through and remained below that 12500 level. Let’s see what happens today.
More is coming soon. Have a great day trading and a great day in general.
Economic Data Courtesy of Econoday dot com
MBA Mortgage Applications
7:00 AM ET
John Williams Speaks
9:20 AM ET
Lisa Cook Speaks
9:30 AM ET
Raphael Bostic Speaks
10:00 AM ET
Wholesale Inventories (Preliminary)
10:00 AM ET
EIA Petroleum Status Report
10:30 AM ET
4-Month Bill Auction
11:30 AM ET
Neel Kashkari Speaks
12:30 PM ET
10-Yr Note Auction
1:00 PM ET
Christopher Waller Speaks
1:45 PM ET