

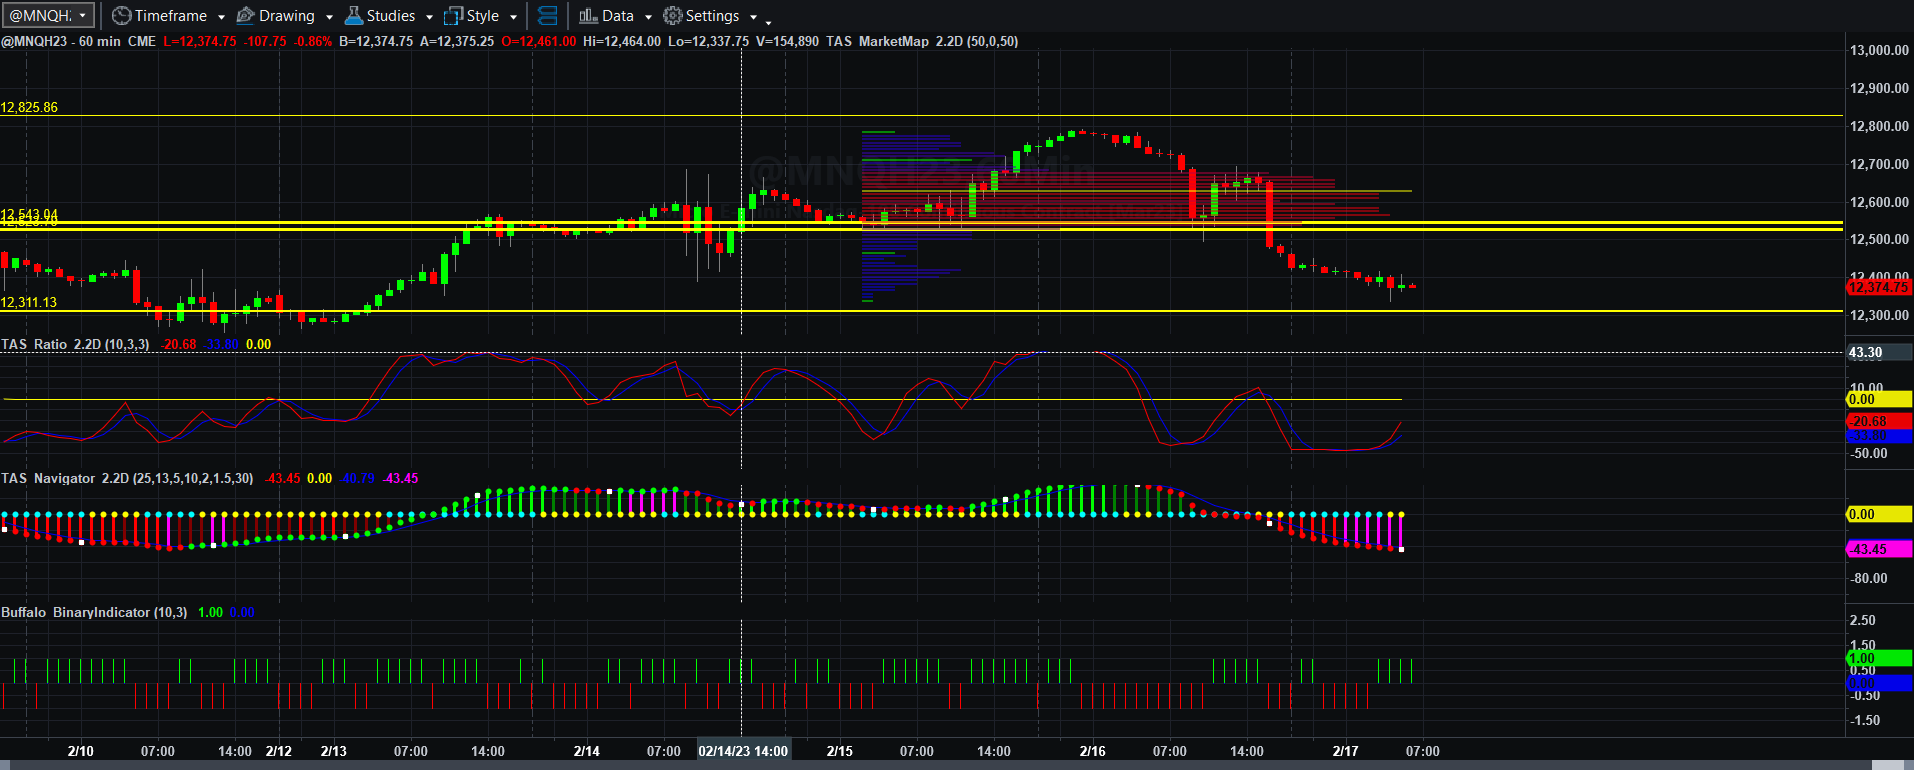
Price, Price Spread, Lagged Price/Volume Spread, and Binary Price/Volume Indicator
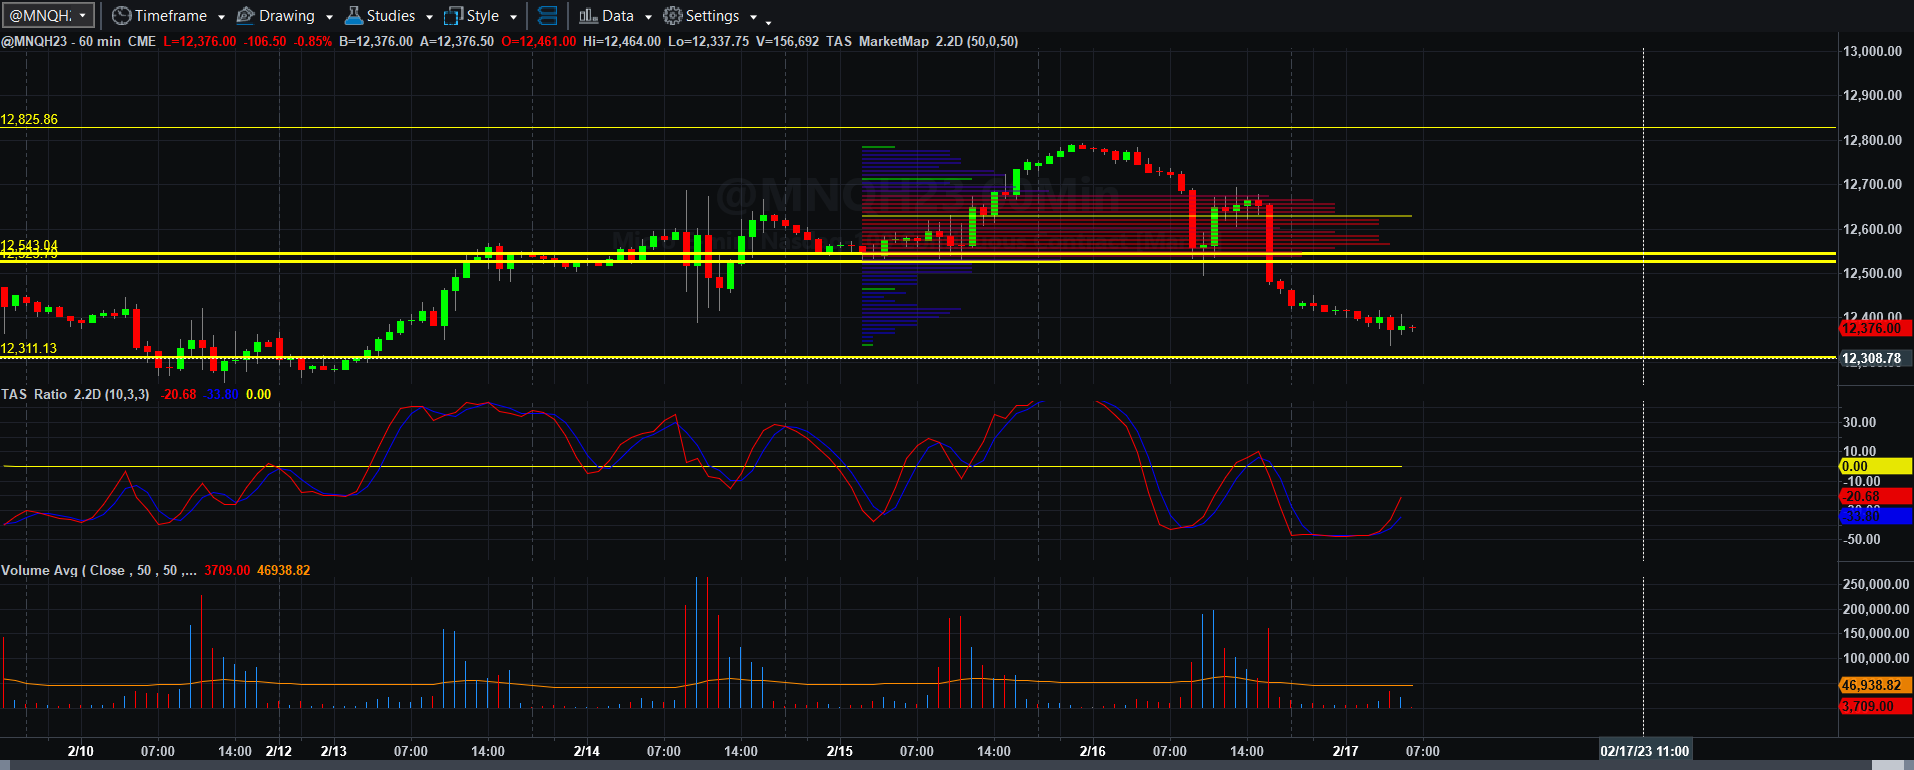
Price and Total Volume With 50-period Moving Volume Average
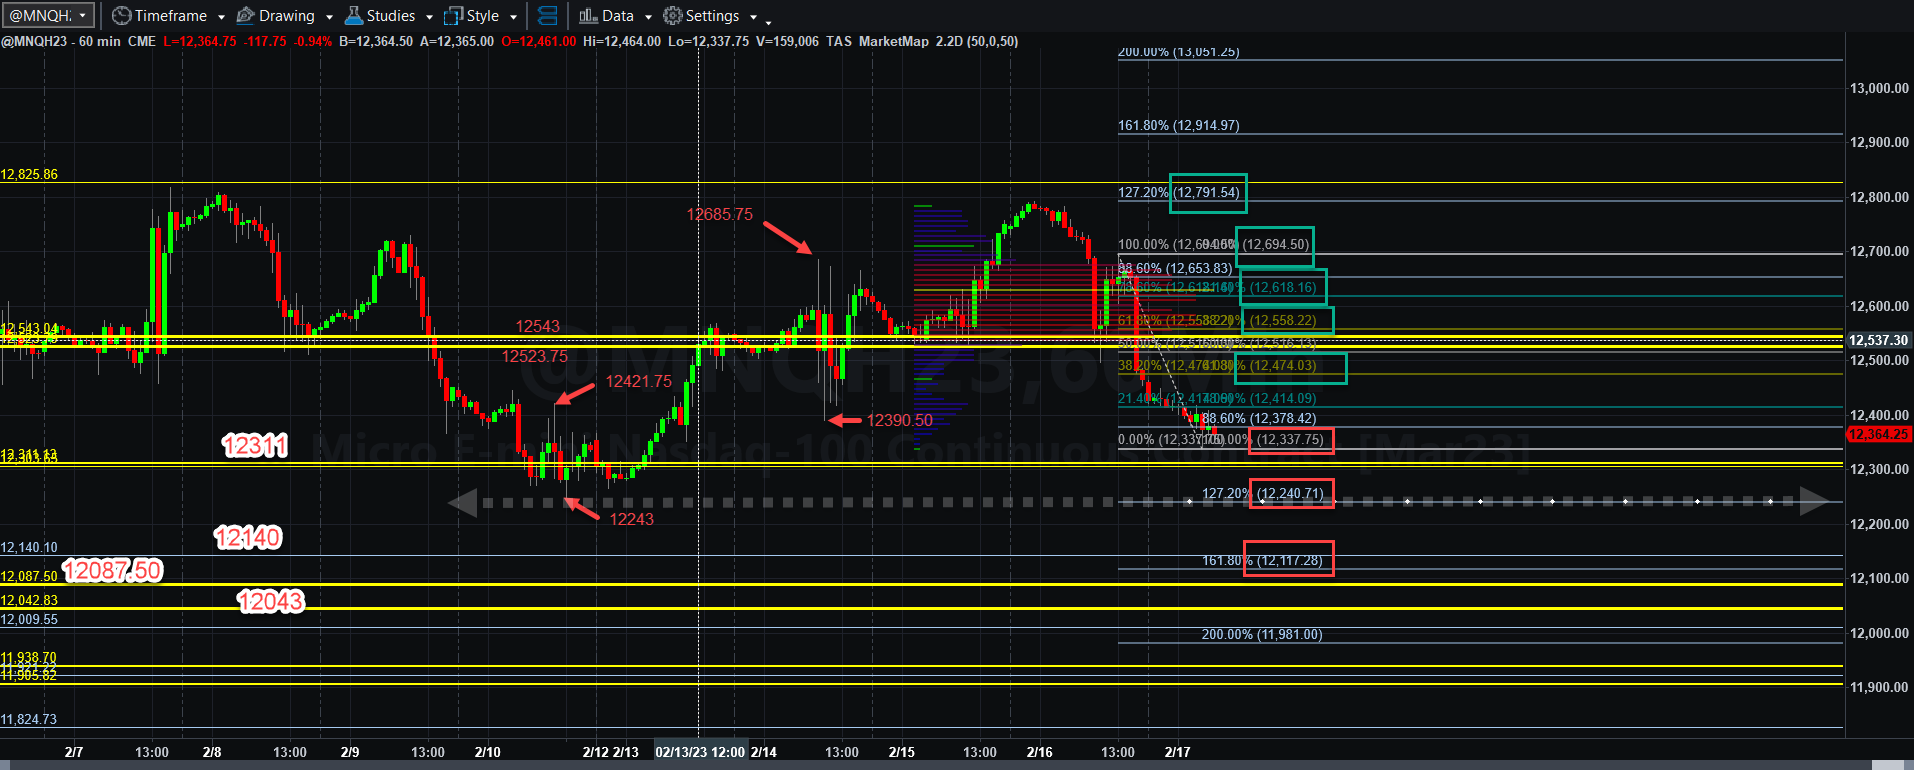
Fibonacci Price Scale With Targets
When the combined effects of a PPI number (annualized for 12 months from the most recent 0.7% increase) came in at 8.4% and the Philly Fed Manufacturing Index fell -21.4 points, the odor of “stagflation” (decreasing production and increasing consumer and producer prices), set in, and market participants sold the market in droves. It got so violent that when I sold my trade was booted (no harm done, just had to step aside).
When combined distrust, fear, and greed combine, markets can display bipolar disorder just like people do. What you are seeing is a manic-depressive market. It’s all driven by Fed policy and the seemingly disturbing reality that the economy might not be running on all cylinders, no matter what our Executive Branch says or believes.
It is going to be difficult to define what could happen today as it is Friday, a day that usually means traders square off positions for the weekend. At the extremes of the Fibonacci scale today, there is price structure support around12337 all the way to perhaps 12421.75, VWAP resistance at 12523.75 to 12543, and today’s VWAP of roughly 12625. You can see other areas of extreme price levels marked on this chart.
The best way I can define this is even though there could be support found around 12337.75 and 12311, if that does not hold then it could be a slow trip back to 12240.75 but then a relatively quick trip to 12140 and 12087.50. If a rally begins at the open, the resistance above my keep this market below 12558.25, but if that breaks out beyond that level, then any of the green boxes above it are achievable targets depending on how strong buyers are as the session continues.
We will just have to see how this goes. Once again, we are still in the pitched battle to determine if MNQH23 can get to the 13-handle and beyond into the 14-handles, or if the 9-handle and below if the sellers win. Fog of war (a trading war) makes it difficult to know the answer and many of the tools to determine it are at the Fed, Congress, the US Treasury, and the Oval Office. Believe me, none of those folks have your interest at heart.
“Those folks don’t have your interest at heart, that’s why I constantly study the chart.”
Sounds like the great last line for a country song. Would any country singer actually sing that? Probably not.
At any rate, I will do my best to prevent the boot and to find a trade in either direction that meets the Fibonacci pattern, price momentum, and volume momentum with a reasonable price target. It has been a good week thus far, if I see nothing, I will come back on Monday.
More will be coming soon.
Economic Data Courtesy of Econoday dot com
Thomas Barkin Speaks
8:30 AM ET
Import and Export Prices
8:30 AM ET
Michelle Bowman Speaks
8:45 AM ET
E-Commerce Retail Sales
10:00 AM ET
Leading Indicators
10:00 AM ET
Quarterly Services Survey
10:00 AM ET
Baker Hughes Rig Count
1:00 PM ET