

Price, Price Spread, Lagged Price/Volume Spread, and Binary Price/Volume Indicator
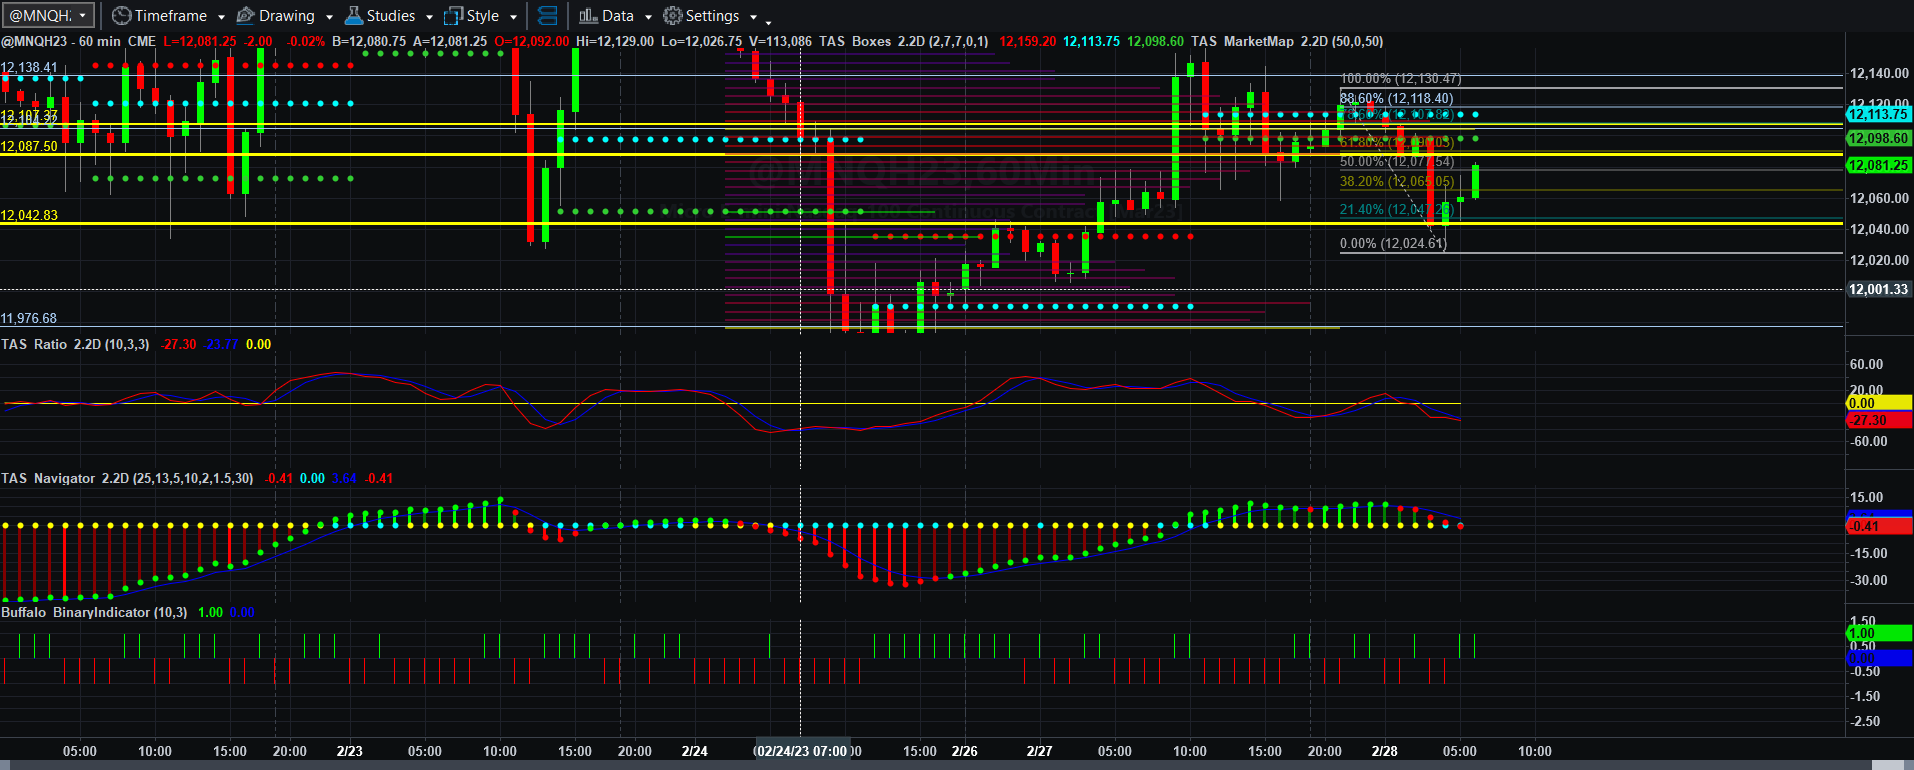
Price and Total Volume With 50-period Moving Volume Average
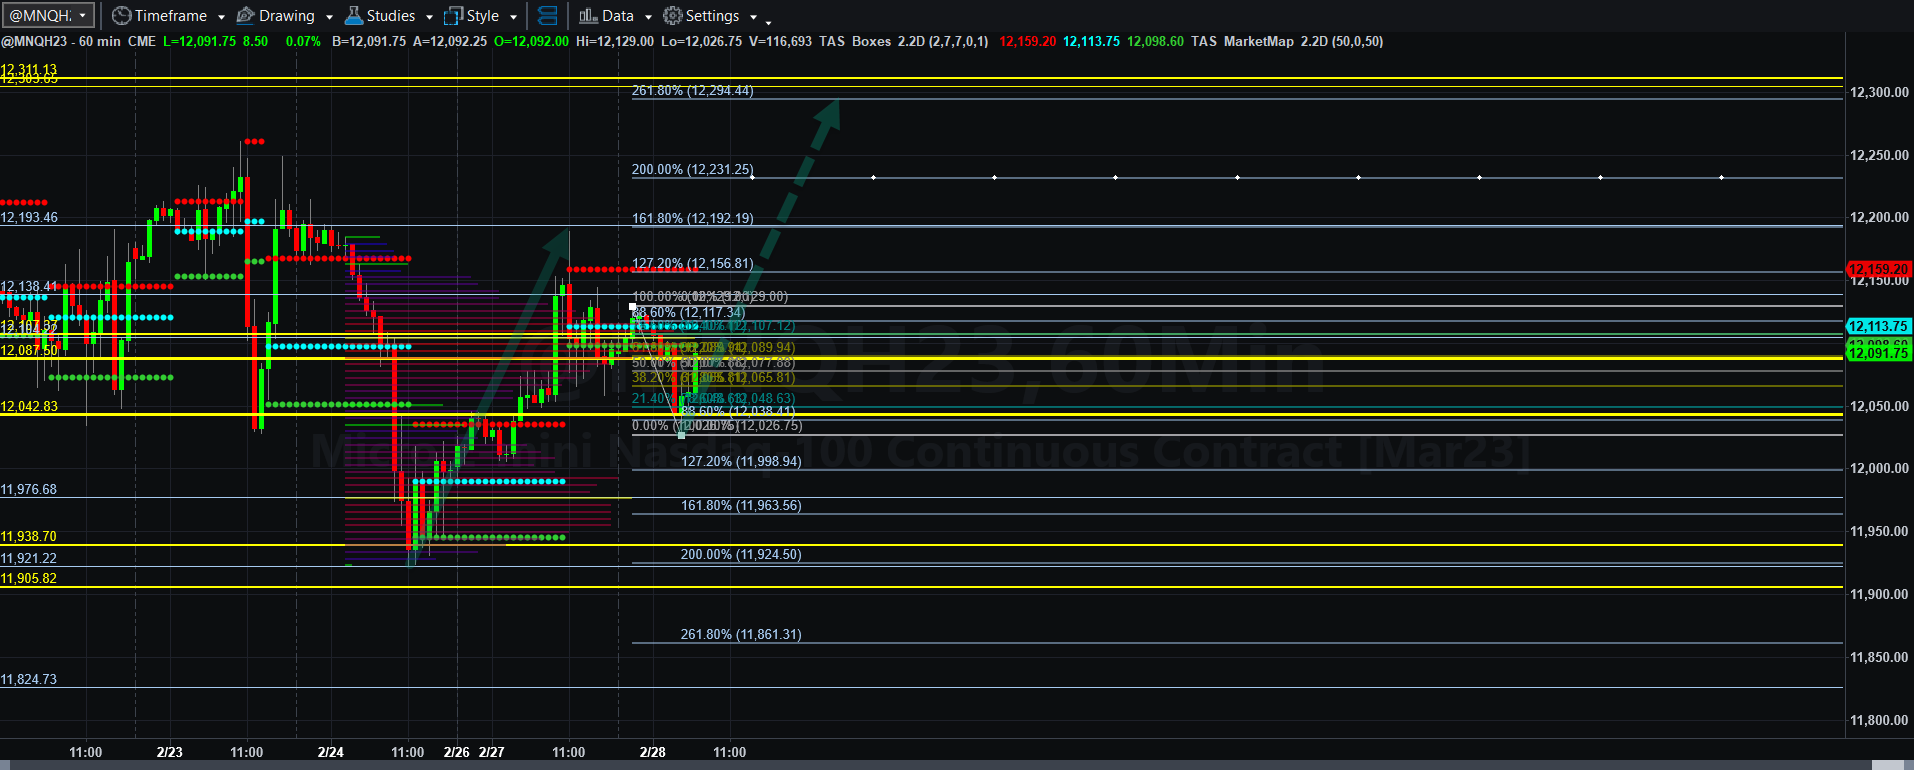
Fibonacci Price Scale With Targets (Bullish Extreme)
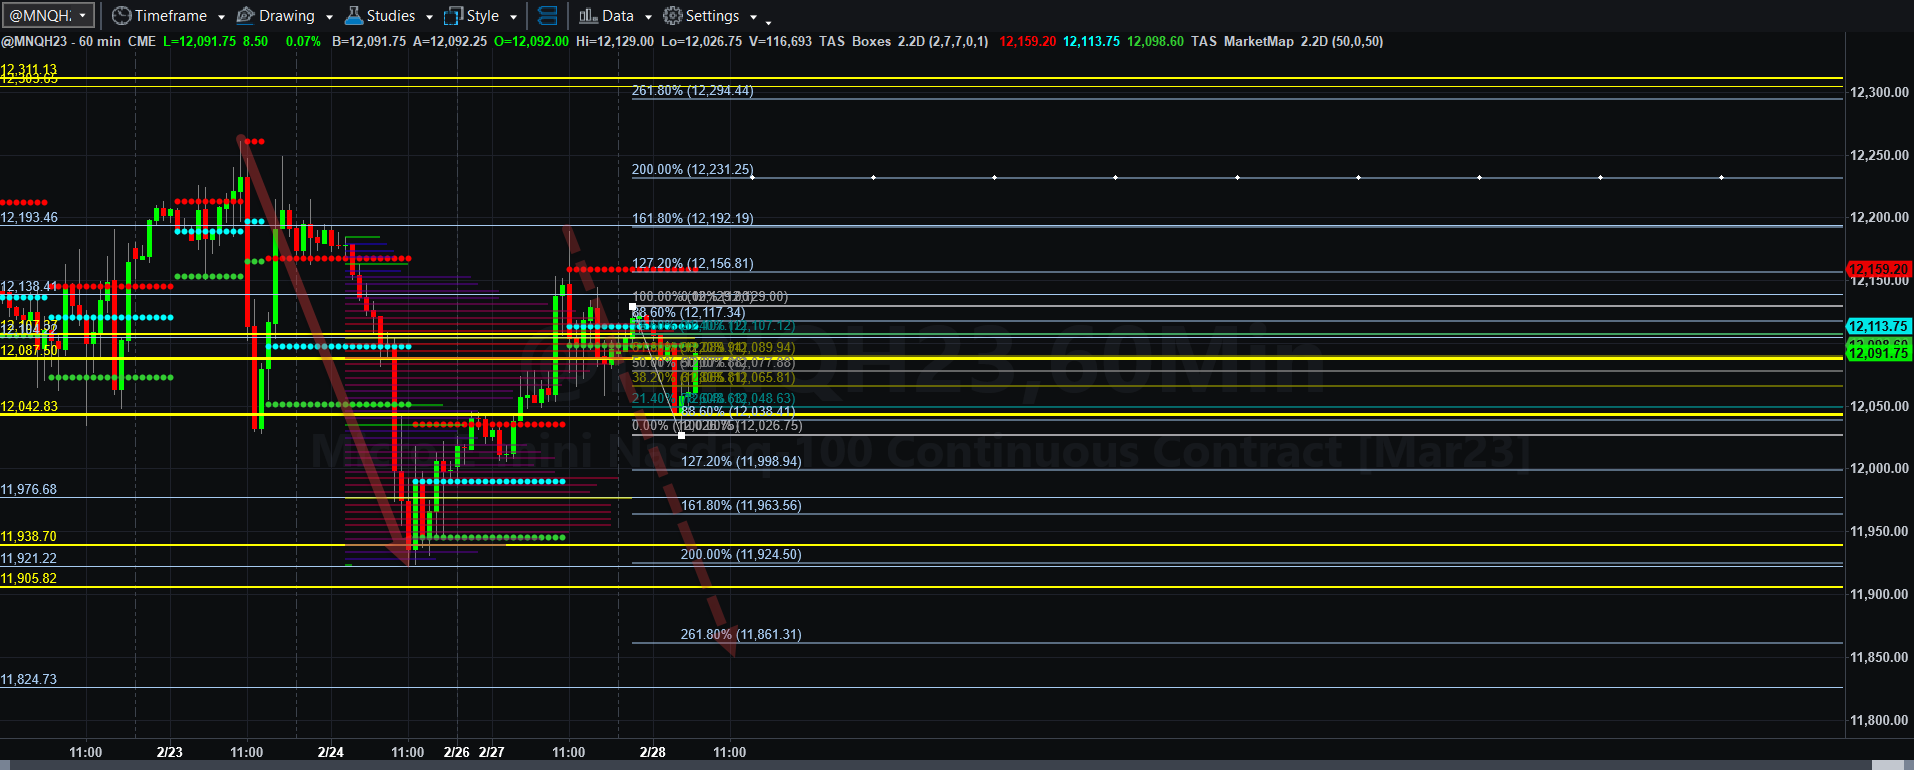
Fibonacci Price Scale With Targets (Bearish Extreme)
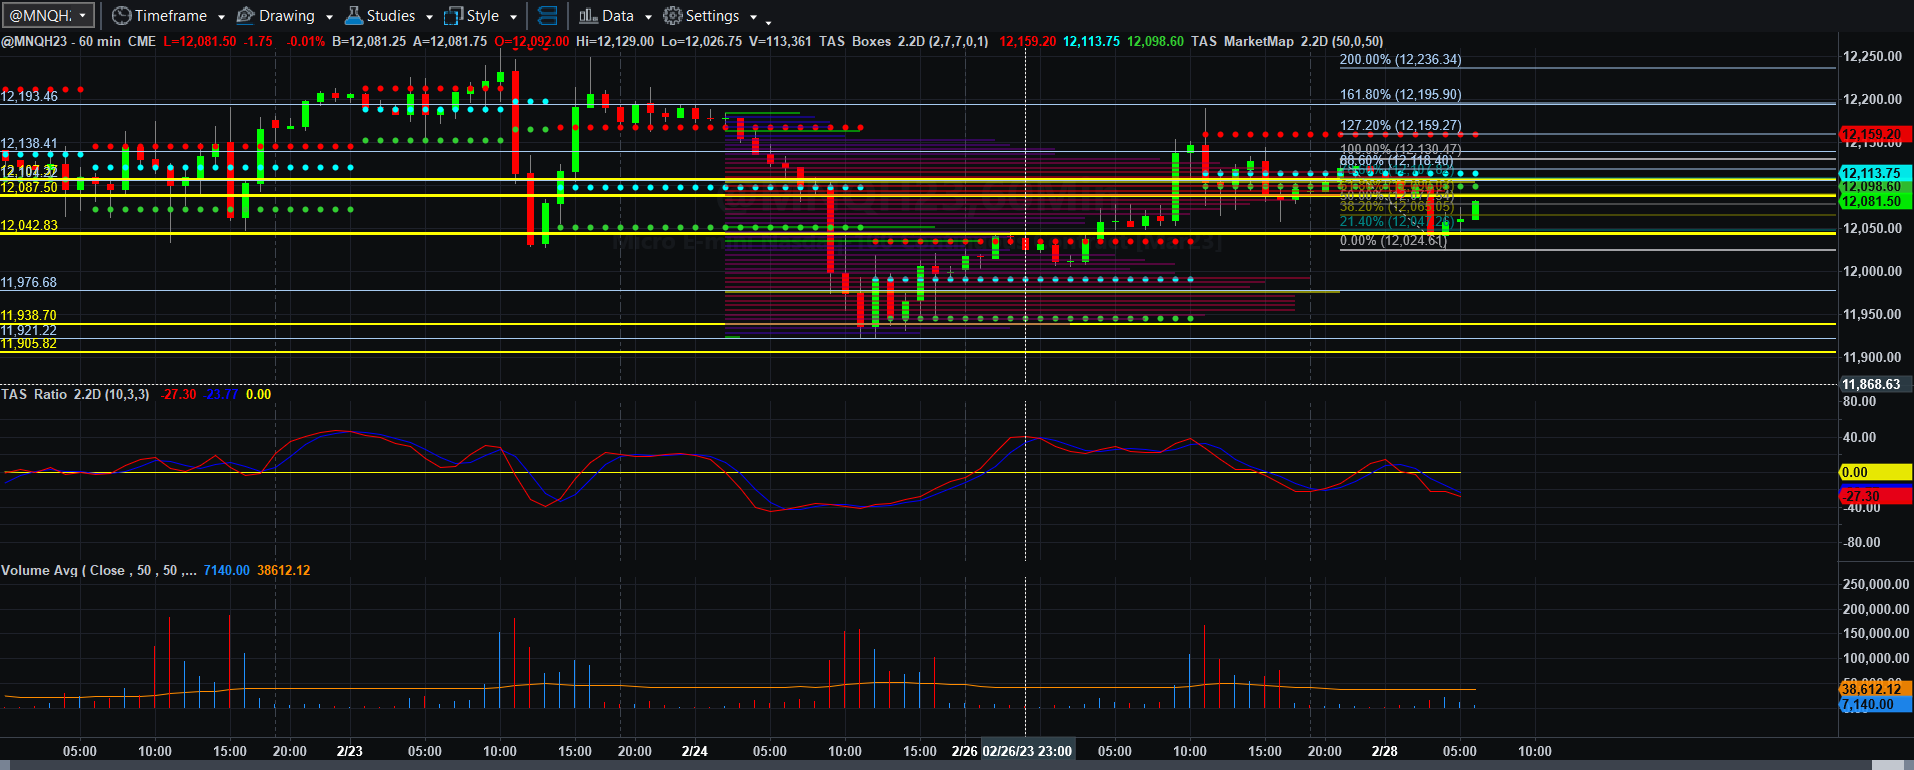
Time somewhat limited my ability to mark up charts this morning, but it seems once again that Europe began to buy back the excess selling that the US and Asia placed on the market as it closed out on February 27. This issue at hand how is that which end of the “trading box” will MNQH23 trade into, the bottom or the top? We will certainly find out over the next four days or so.
If MNQH23 can remain above 12100, then it has an easy shot at taking out 12129 with outside targets of 12156.75 and 12193 possible. At the extreme, a target near 12293.50 is possible later this week, even if the time symmetry does not match the price symmetry.
On the bearish side, failure to maintain 12100 could lead to a break below 12026.50 to a target of 11999 and perhaps 11963. A wider target, consistent with bearish AB=CD symmetry would lead to a low of 11851.25 later this week perhaps.
Given the inconsistencies in Fed Regional Bank data and Federal government data on a number of fronts, I am completely agnostic of any trend and will simply rely, as always, on price and volume momentum, Fibonacci pattern analysis and expansion levels, and the volume profile. I picked up 50 NQ points long and left yesterday. On Friday I avoided the boot and picked up 4 NQ points and successfully completed job one for a trader which is to protect equity. The trade and scale project continues for me!
That is it for now. More will be coming soon.
This link to TradingEconomics.com will have to do for today’s U.S. economic data schedule (move the date to February 28). Once again Econoday’s database has crashed.