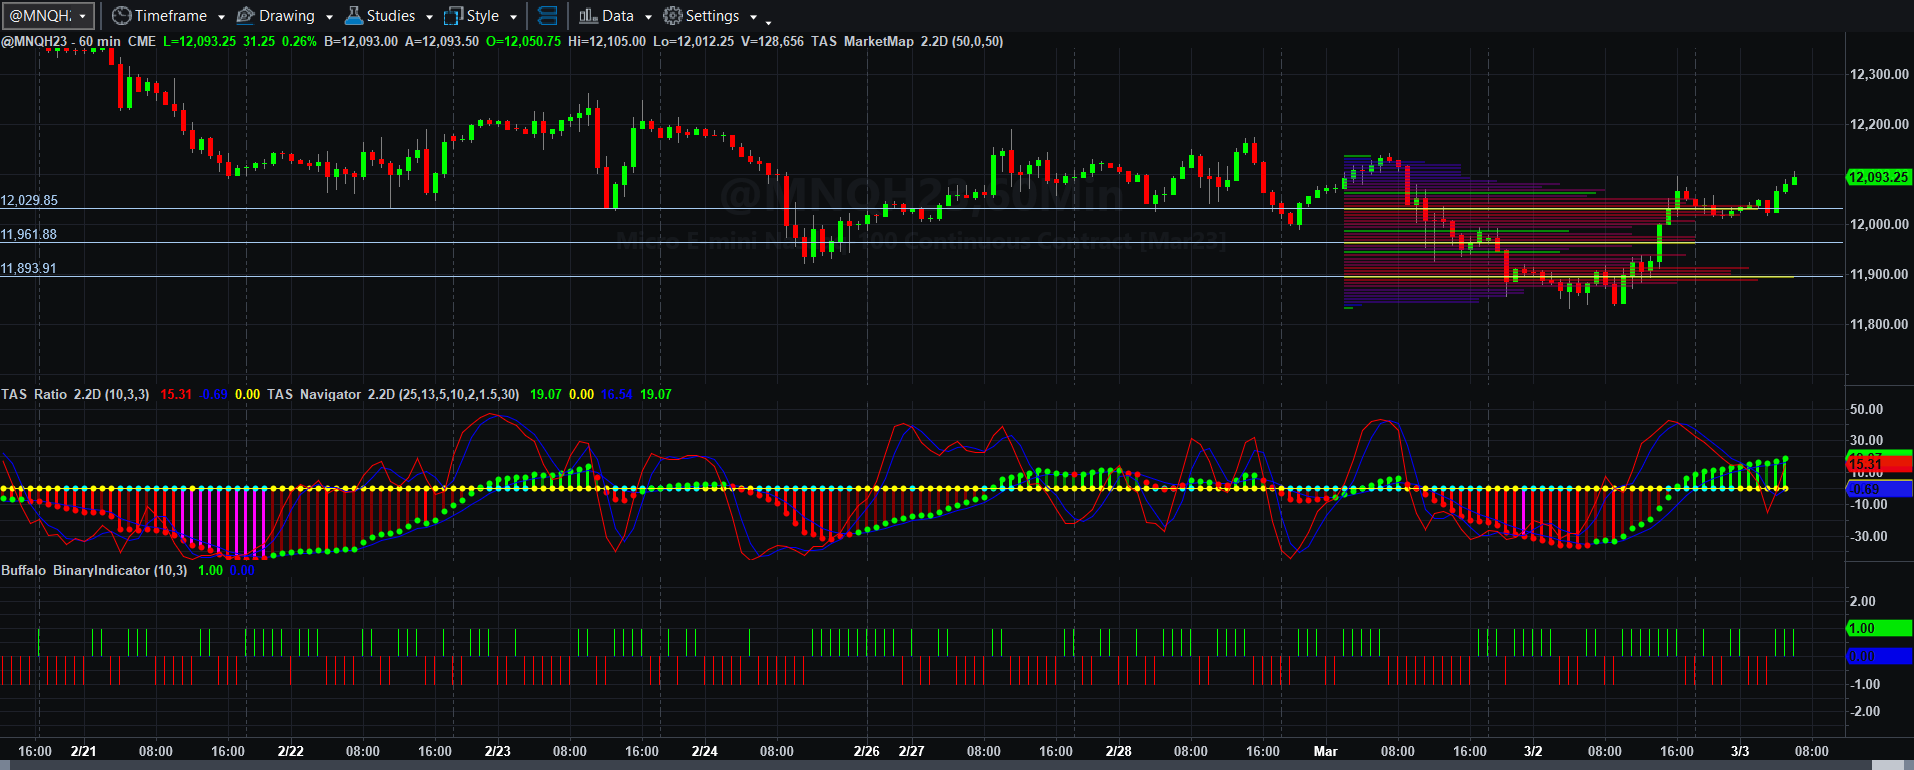
Price, Price Spread, Lagged Price/Volume Spread, and Binary Price/Volume Indicator
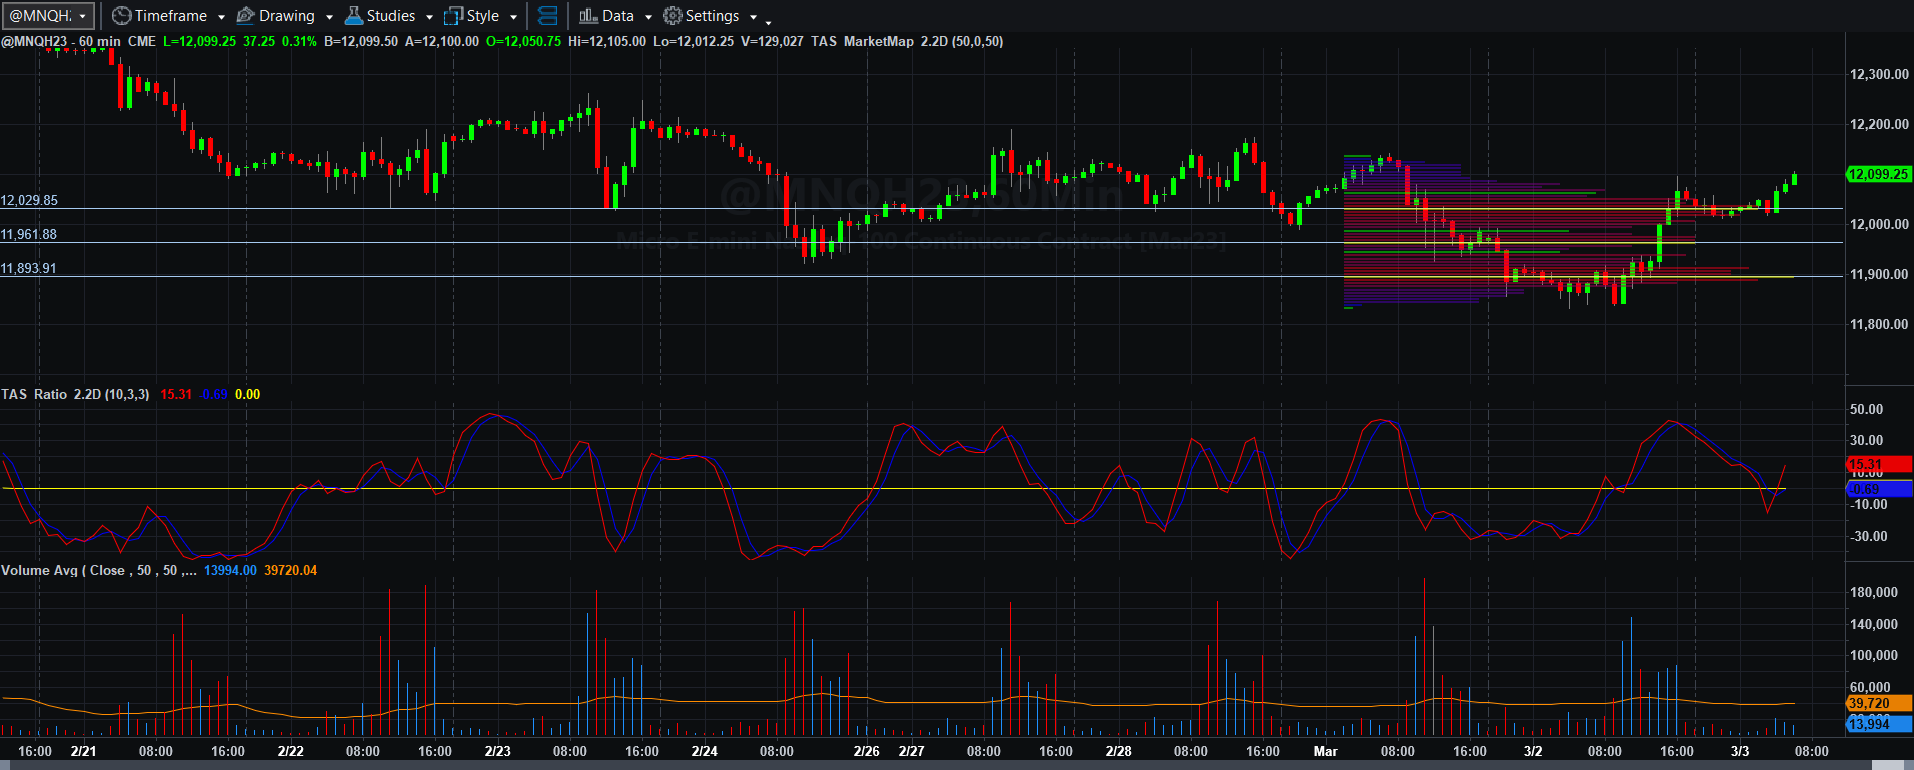
Price and Total Volume With 50-period Moving Volume Average
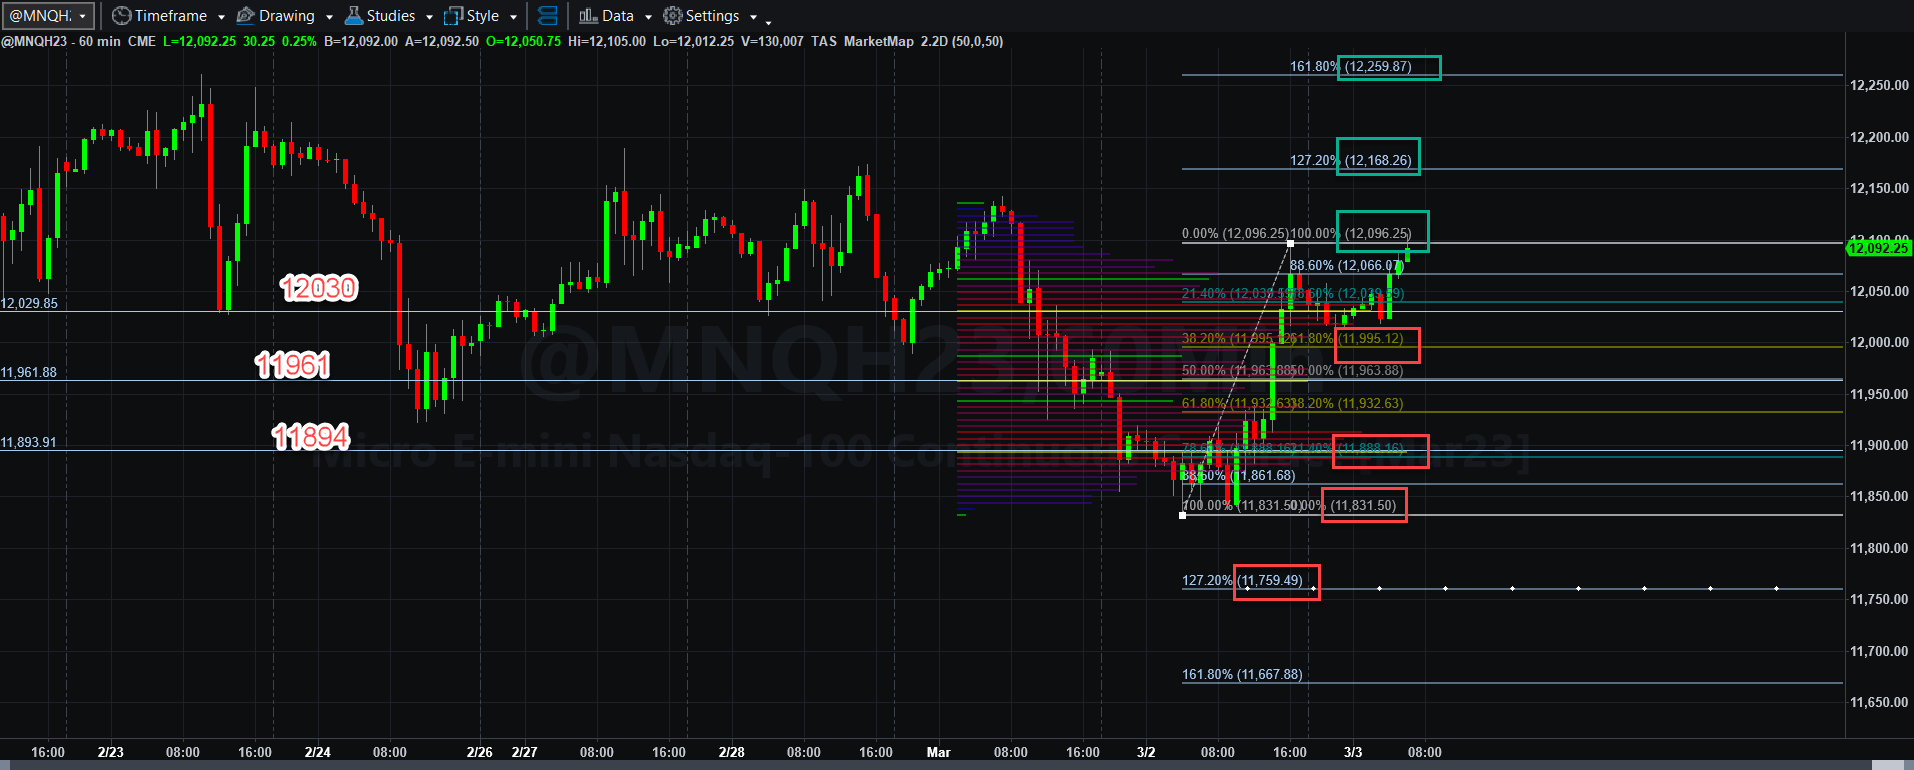
Fibonacci Price Scale With Targets
I reduced a few of the VWAP resistance lines to make things a bit easier to see (but you may need to take notes about the overhead resistance).
Asia continued the selling, but for whatever reason, perhaps the mention that European producer inflation had dropped (meaning it is only rising a little less than it was before) exited European traders and got the rally that began yesterday to continue.
That means, once again, that the overhead VWAP line around 12000 and the vaunted VWAP resistance lines at 12311 could be hit again by early next week. The bipolar nature of MNQH23 again shows itself.
If MNQH23 can remain above 12030 then (it can and HAS) exceeded 12096.25 and can rally to 12168.25 and 12260.
If not, then VWAP support around 11961 and 11894 (VWAP) and 11888 Fibonacci support would likely be the next destinations, with 11831.50 and 11759.50 being targets should selling be aggressive. We will get data today that could reverse the European “good” news this morning and through the day, or we may NOT. I think that is how you will approach things. That is trade WHAT YOU SEE. I will be looking for proper setups and allow them to form before I trade.
I was booted on a volume spike yesterday for the second day in a row. I am still profitable for the week, but I will take notes in terms of capturing partial profits. I have steadfastly held positions these last few weeks choosing to hit the measured target or to break even. That has worked well since the beginning of the year. My biggest goal is to protect equity and to let profits run.
That will be a continuing strategy as time goes forward. More will be coming soon.
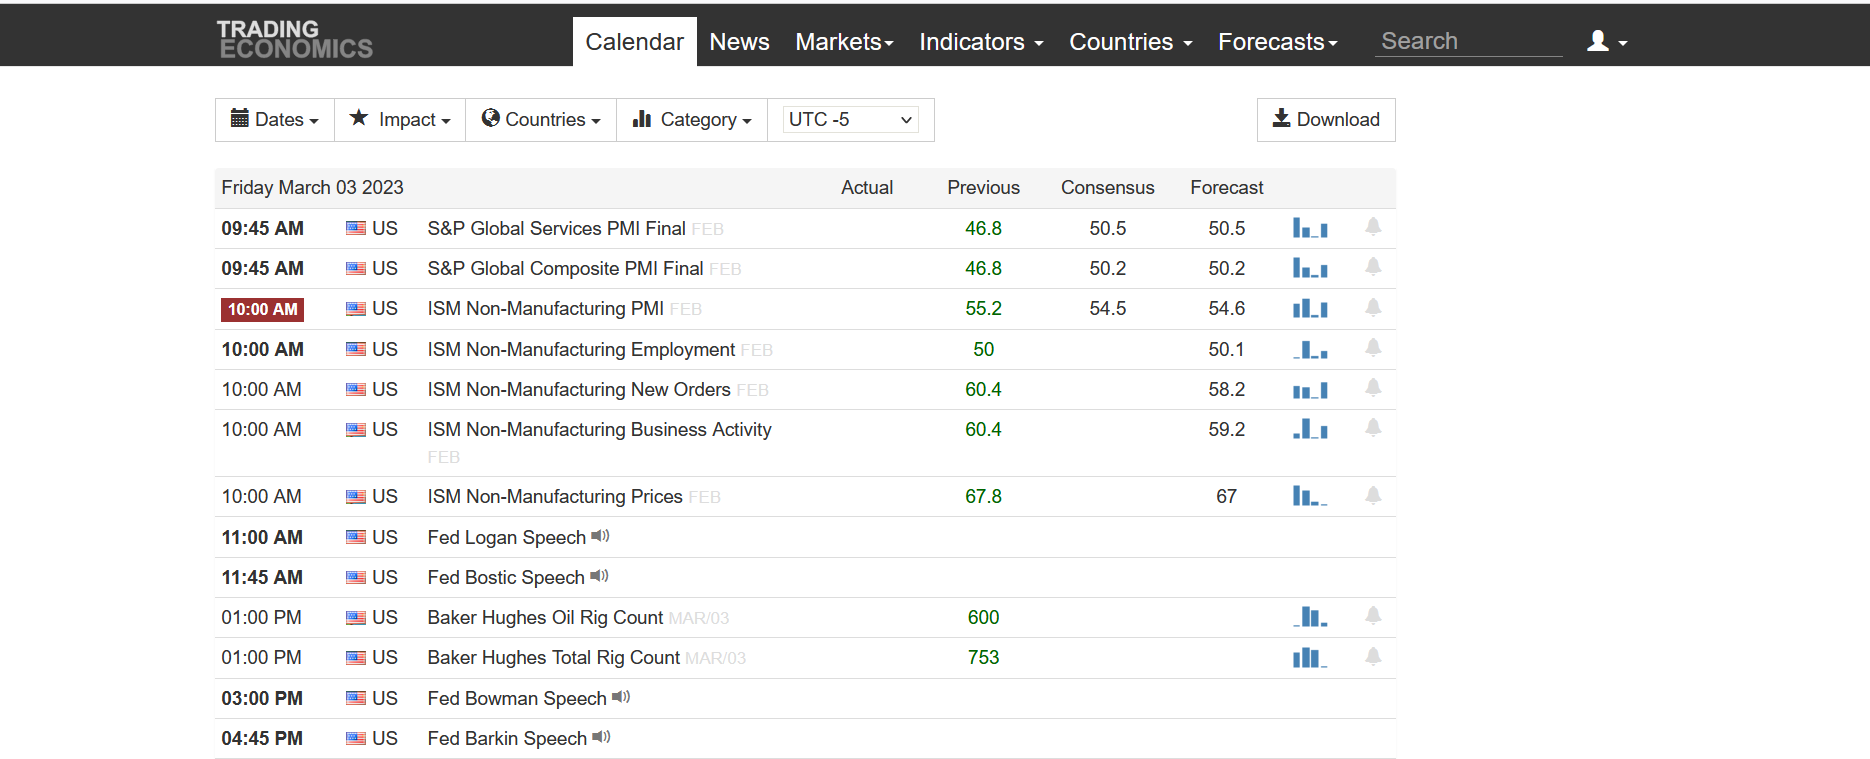
Today’s Economic Data Courtesy of Trading Economics dot com. Be sure to refresh the date at the top left.