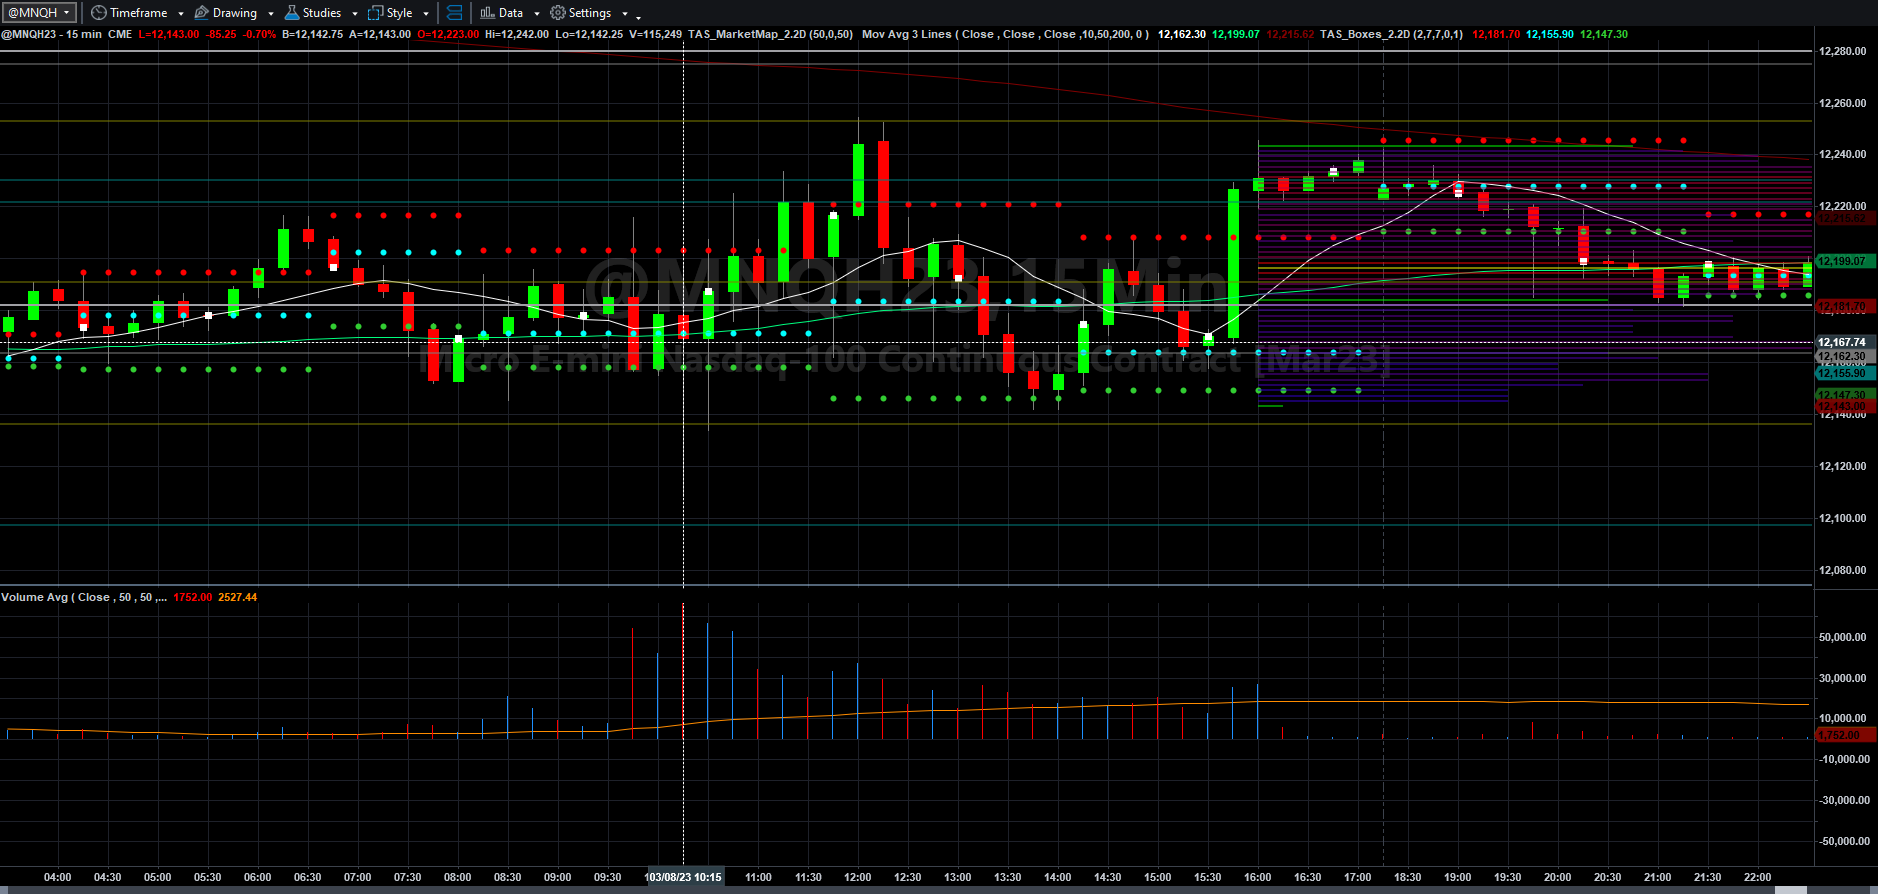
The 15-minute chart I was trading from yesterday
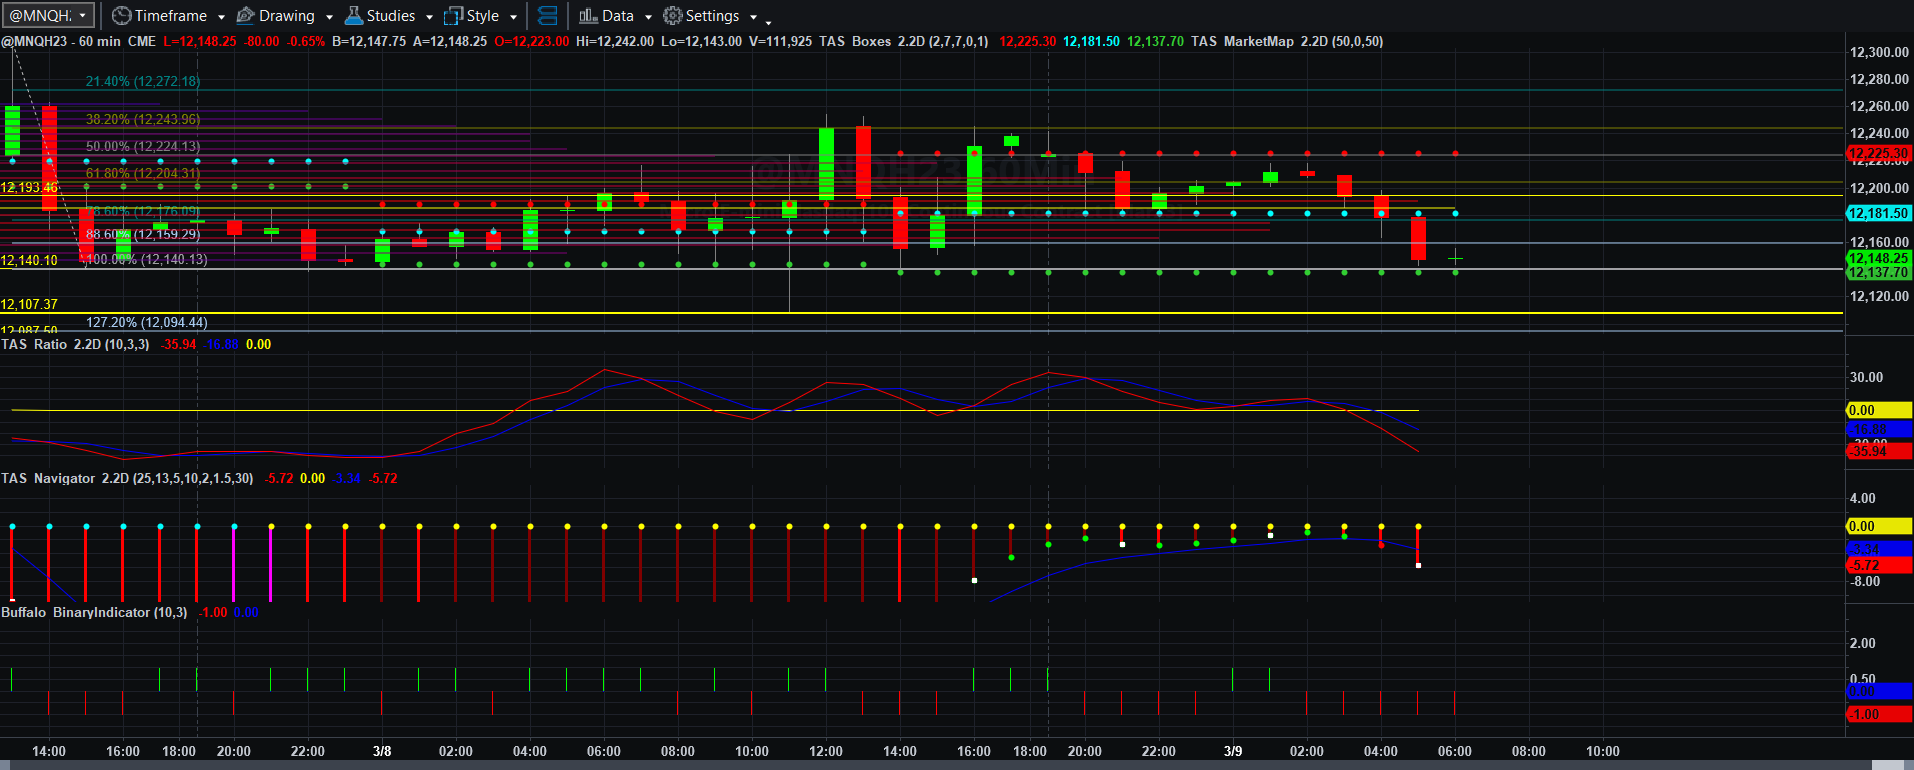
Price, Price Spread, Lagged Price/Volume Spread, and Binary Price/Volume Indicator
Price and Total Volume With 50-period Moving Volume Average
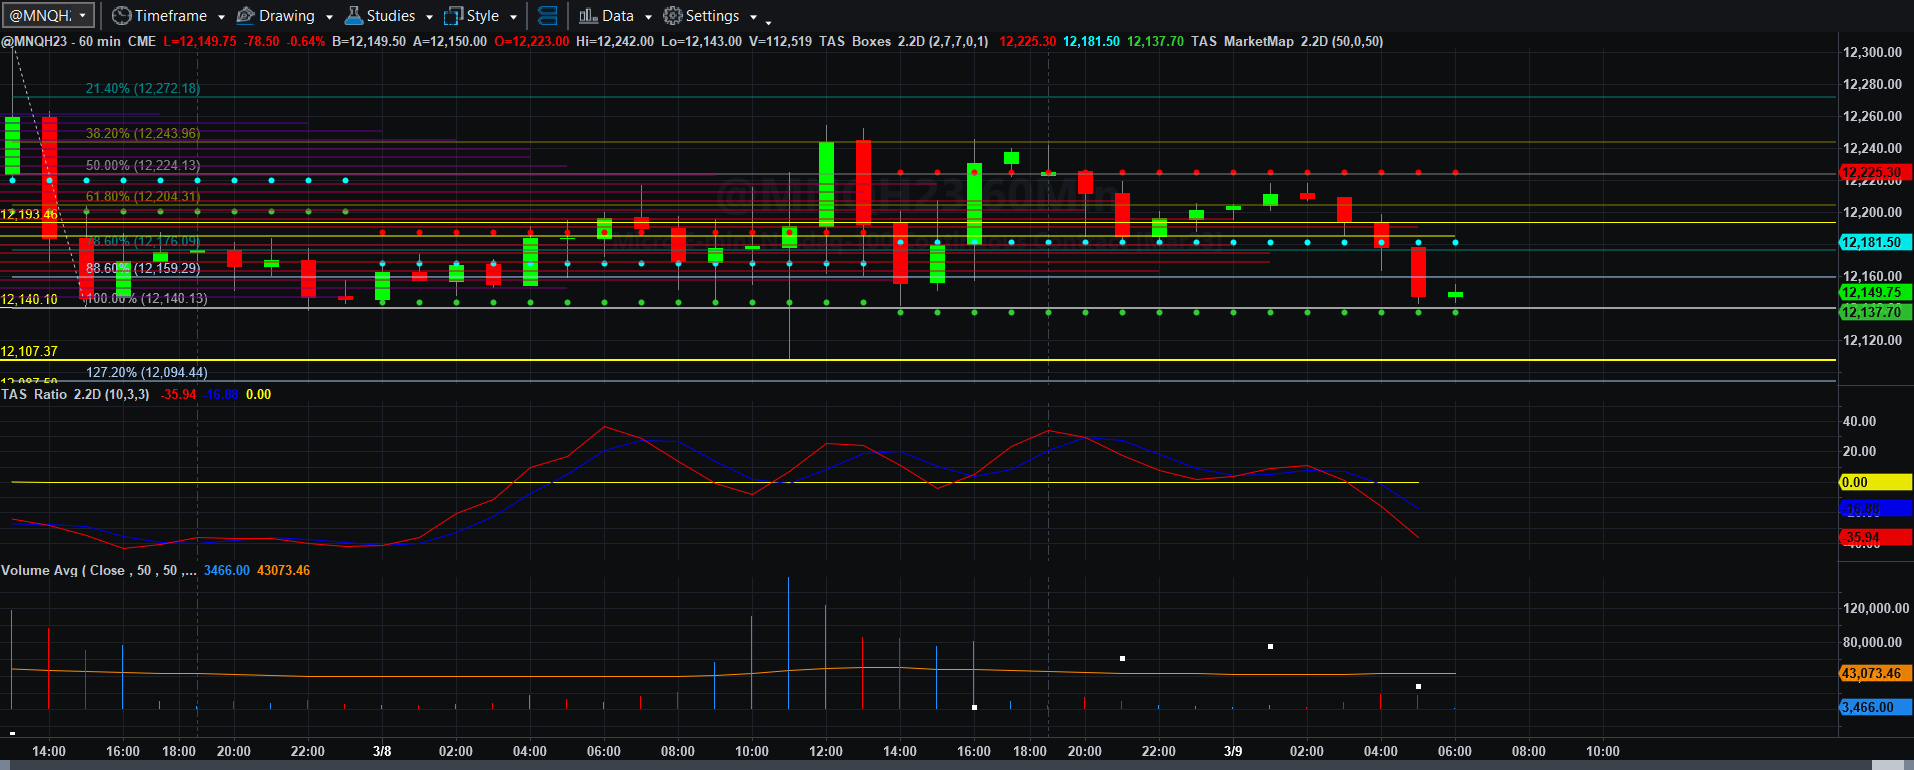
Fibonacci Price Scale With Targets
I posted the 03/08/2023 15-minute chart to demonstrate how wild the rangers were in the early session. Volume was erratic and even in areas where breakout levels were clearly defined. The wicks on the candlesticks were very wide and often tested on both end a couple of times before each close.
As we get closer to Friday, traders, particularly the algorithmic traders, and institutions, seem to be chasing what looks like the best breakout in either direction ( up or down) perhaps trying to get a jump on anticipated employment data and Federal Reserve action with regard to rates. What you get is mass insanity and if your targets are not tight and your stops are protective, your intraday trade can be crushed in the process. Unless you have the ability to risk capital on large swings away from entry, that is the mess that any intraday trader will face. It is not so much that the algorithms are out to get you, but the collision between them creates more uncertainty with regard to price targets.
This is discussed in an Asbury Research video I will link here. As I have mentioned previously in my weekend posts, we are drifting sideways as rates rise and the longer-term nature of Fed policy gets revealed, even if the results are political in nature. Martin Zwieg used to say “don’t fight the Fed.” With the insanity of Congress, the Federal Reserve, the U.S. Treasury, and other international central banks, I would speculate that if Mr. Zweig were alive today, he might say “don’t even ENTER THE RING against the Fed”. The turmoil is likely to intensify perhaps until the Fed, based on Congressional malfeasance, has no other choice but to move in one direction. We will simply have to wait it out.
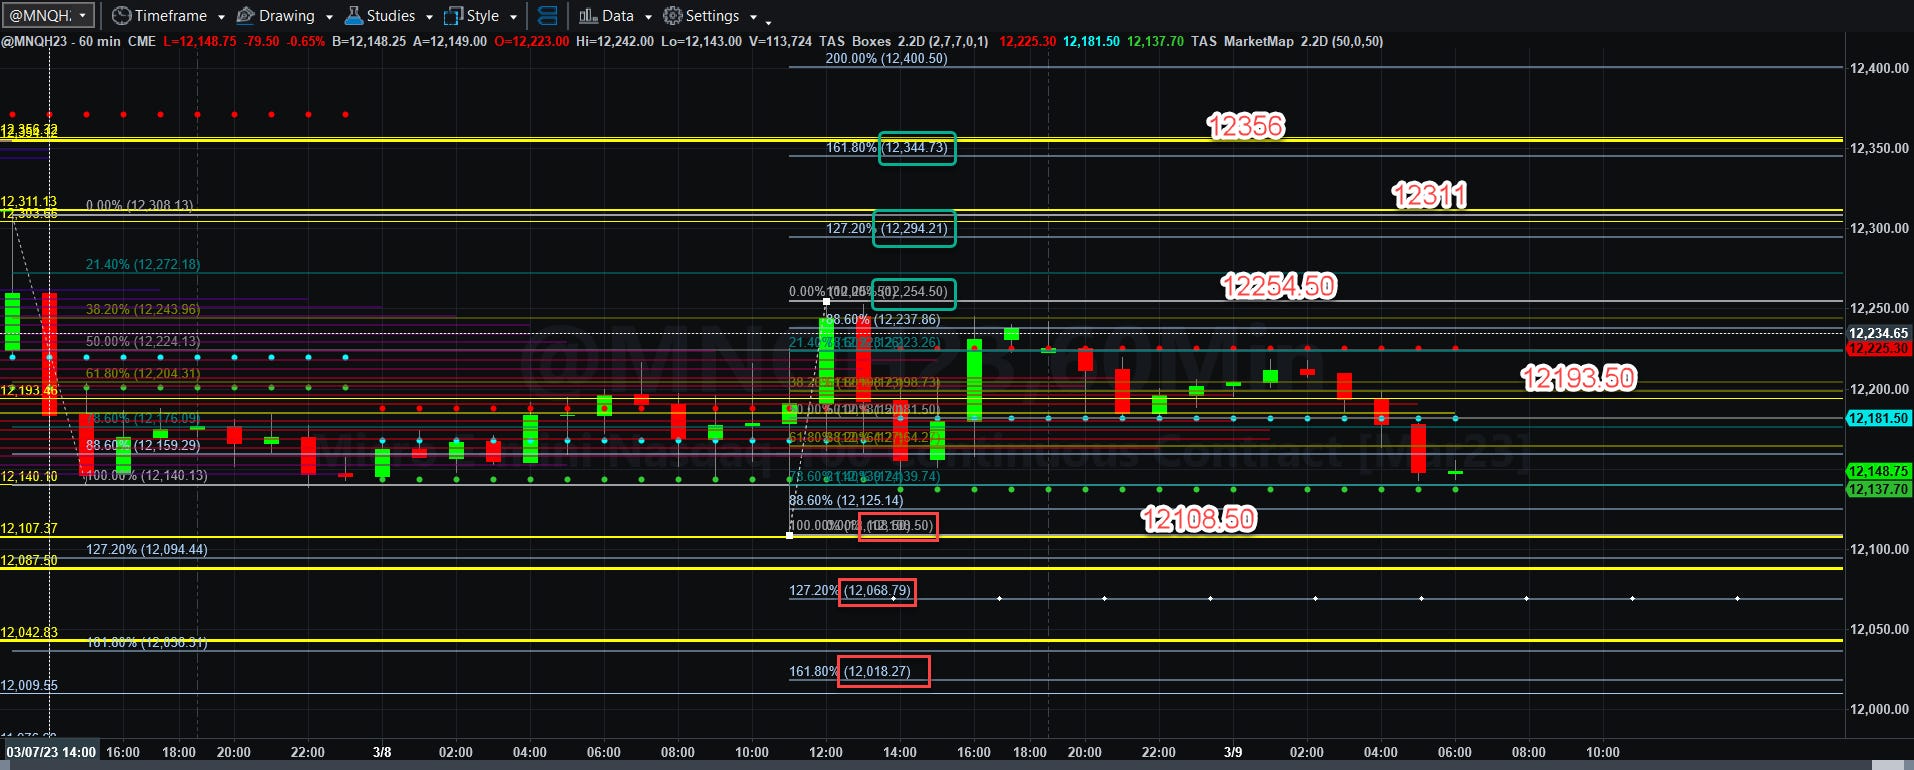
The real data hits tomorrow, but even jobless claims or Fed pronouncements could affect things today. Regardless of that, let’s look at how things could shake out. If MNQH23 can remain above 12193.50, it could indeed head up to 12254.50, with enough gaps in VWAP levels to allow a rally perhaps back to 12311 and even 12356 by Friday. If not, then we probably see another test of 12108.50 with potential lows reaching 12068.75 and potentially 12018.25 by Friday. There seems to be a fair amount of VWAP support around the 12000 mark, but if sellers get busy, that support might be broken.
I got the boot again yesterday, and I will be watching for retests of breakout levels today given the volatility we see. If nothing meets the trade plan criteria, I will simply back away and move to other business.
I will be back soon with more analysis. It will be interesting to see which way MNQH23 moves. It will take more time to settle the issue.
Have a great day trading and a great Thursday overall!
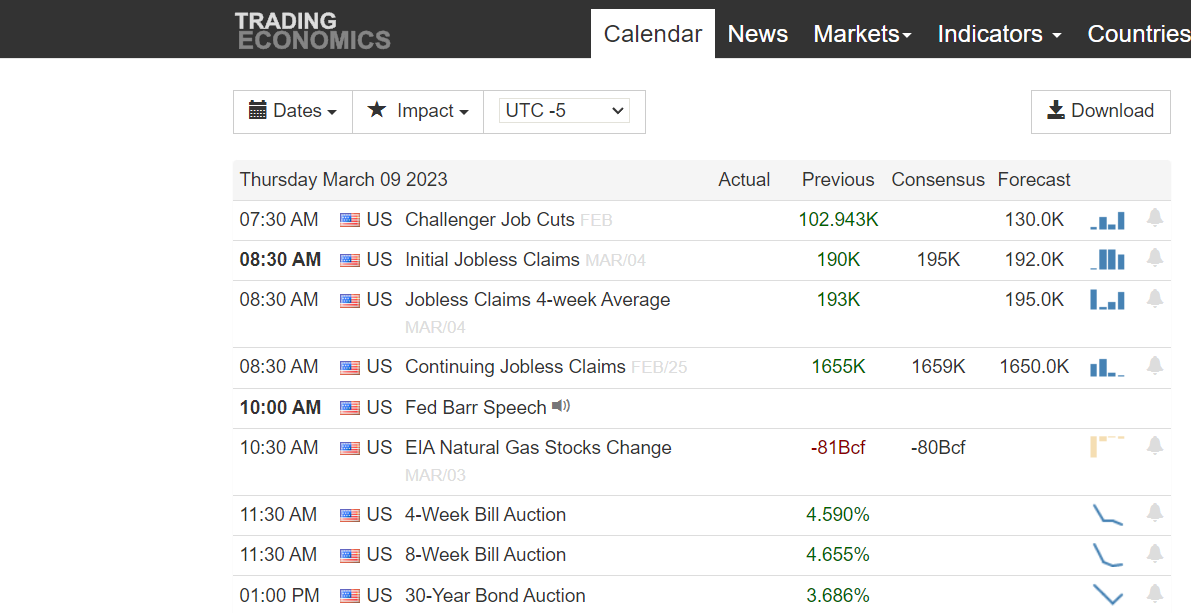
Today’s Economic Data Courtesy of Trading Economics dot com. Be sure to refresh the date at the top left.