

You can literally see what I project on the MNQH23 daily chart as a near-term ( say 5 to 6 months away) on the bear side of 9629 and if we break above 13929.50 to the upside, (go to the video starting at 2:24), we could see a slightly higher high of the swing low at 11831.50 holds at around 14030.50 if the AB=CD symmetry holds ( for the price, even though time symmetry might not hold).
To put things in a broader perspective, look at the monthly chart of MNQH23:
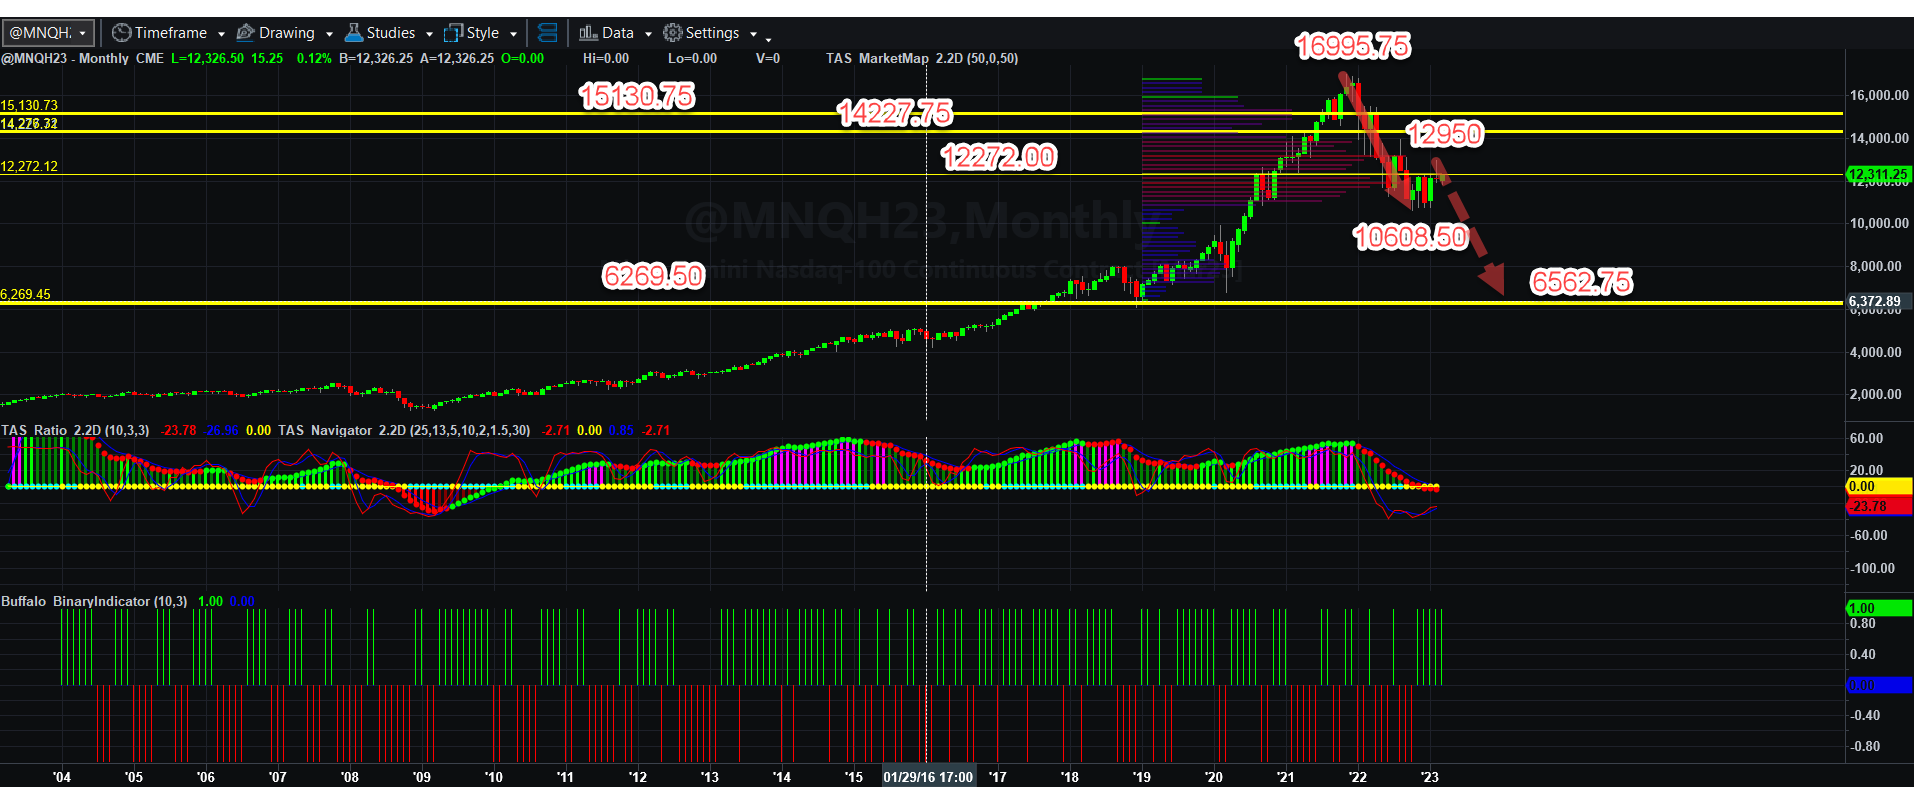
The WVAP targets at or around 7000 (the one with the best symmetry is 6269.50 are still attainable if things go to complete crap in MNQH23. On the other side, if the Fed pivot to lower rates comes and buyers begin to guzzle the free money (or below zero interest rate money after inflation money) campaign again, we could easily see 14227 taken out and a rally toward 15130.50 can happen. You saw my previous weeks’ estimates of rallies into the low 20,000s.
What concerns me is that we are now seeing some cracks in manufacturing growth and some in business productivity, so how far this market can go on low-interest rates is a question that only time will solve. Our Federal government has no monetary or fiscal discipline of any kind, so these markets are vulnerable to all kinds of negative exogeny from all political, social, military, and economic angles that the prospects are frightening (and I have beaten myself and you to a pulp discussing them.
That range I have mentioned is likely where we will be until the fog of global insanity and confusion clears. I will still be here to discuss it with you, and to provide you with analytical assistance in my own way.
I will be back tomorrow with the normal hourly analysis. If you have questions, please comment here, on Facebook, on MeWe, on Twitter, or anywhere else you find this.
THANK YOU FOR SUPPORTING THIS BLOG! Have a great week!

