

Instead of breaking down monthly weekly and daily charts, I wanted to focus this week on what could be an extended period of sideways action in MNQH23 based on general confusion (and perhaps fear and greed) associated with divergent streams of economic data from the Federal government and the regional Federal Reserve Banks.
To do that, even though I think listening to the entire video would be helpful, if you want to go back to this previous post (when I was more concerned about a three-drives to a bottom correction, and came up with the divergent double bottom opinion on the weekly chart, to the actually weekly chart this week. What actually happened was pretty close to the projection (which is why I use those projections in nearly every timeframe ) and why setting reasonable targets helps you to profit from pattern analysis. Even the VWAP line showed up very near that projection point. (TIMESTAMP IS AT 3:27)
Here is the weekly chart with the old projection and the reality of what happened on the same page.
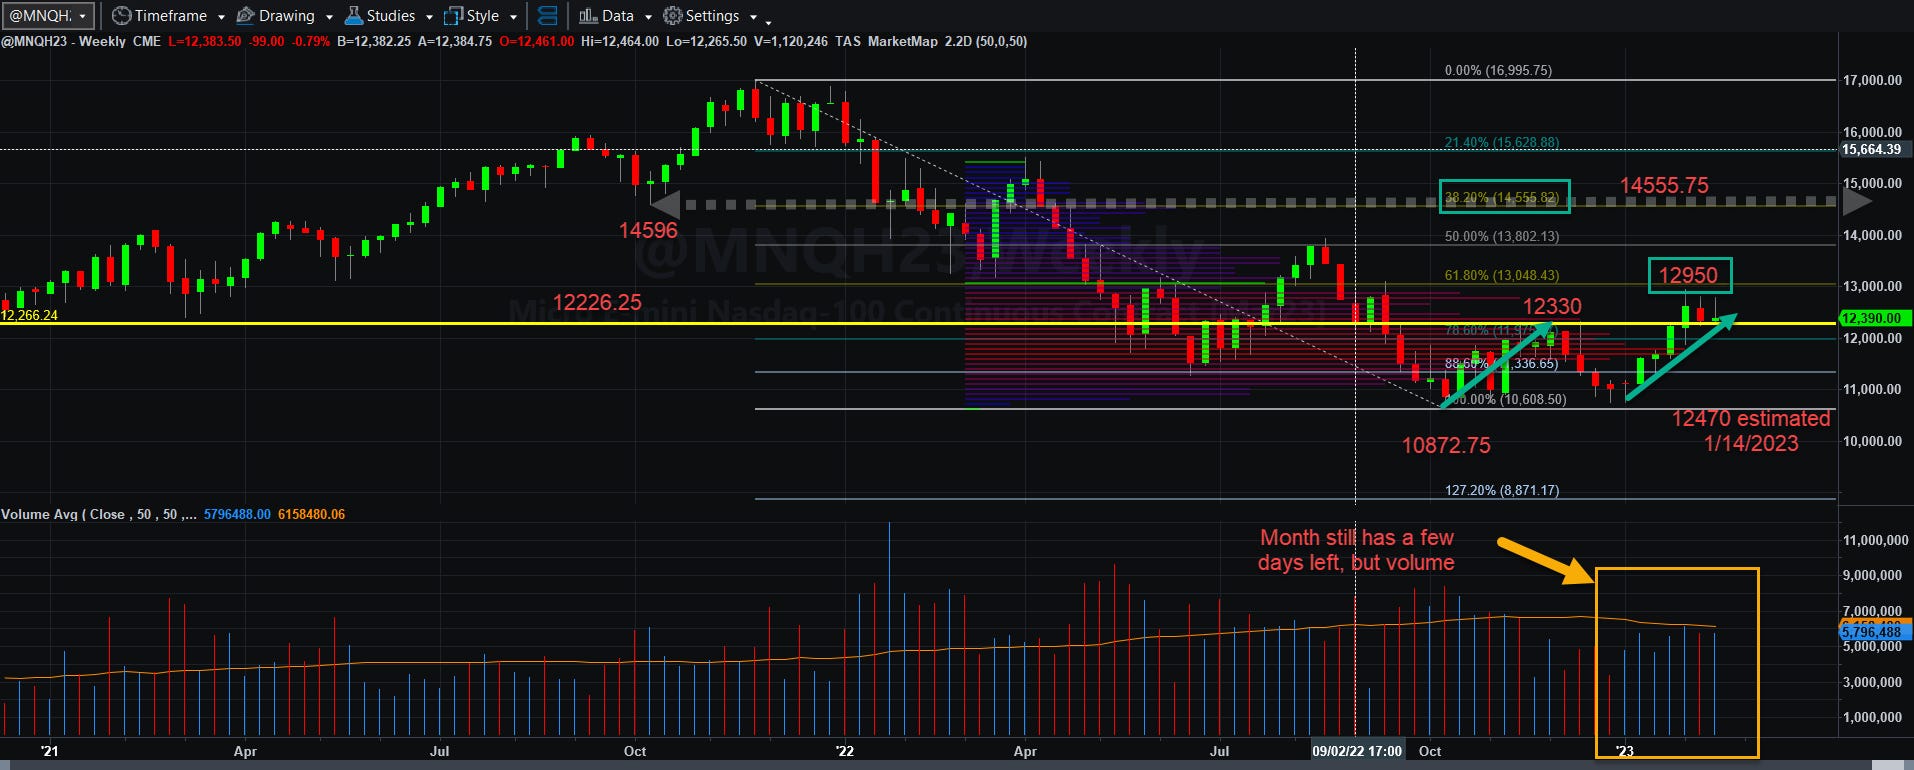
At the 8:12 mark, I begin to discuss the hourly charts and how much they’re now trading in ranges between major VWAP lines, first by showing the relative highs and lows of those ranges, and then at 13:05, I show you the VWAP ranges that we could be dealing with and the large gaps that exist between them. Many of those gaps were created by previous economic data announcements.
I still think this market will trade from 10608.50 to 13802, perhaps breaking out to 14555.75 until the real data is revealed by the economy itself and government bureaucrats are forced to admit what really is happening to the economy, no matter which way it ends up. All we really can discern at the moment is that one side or the other is lying and as long as that is the case, the market may continue to work in a channel. That is difficult for long-only investors and traders and nirvana to traders who can be both long and short and like volatility.
More will be coming soon. Thank you once again for supporting this blog!

