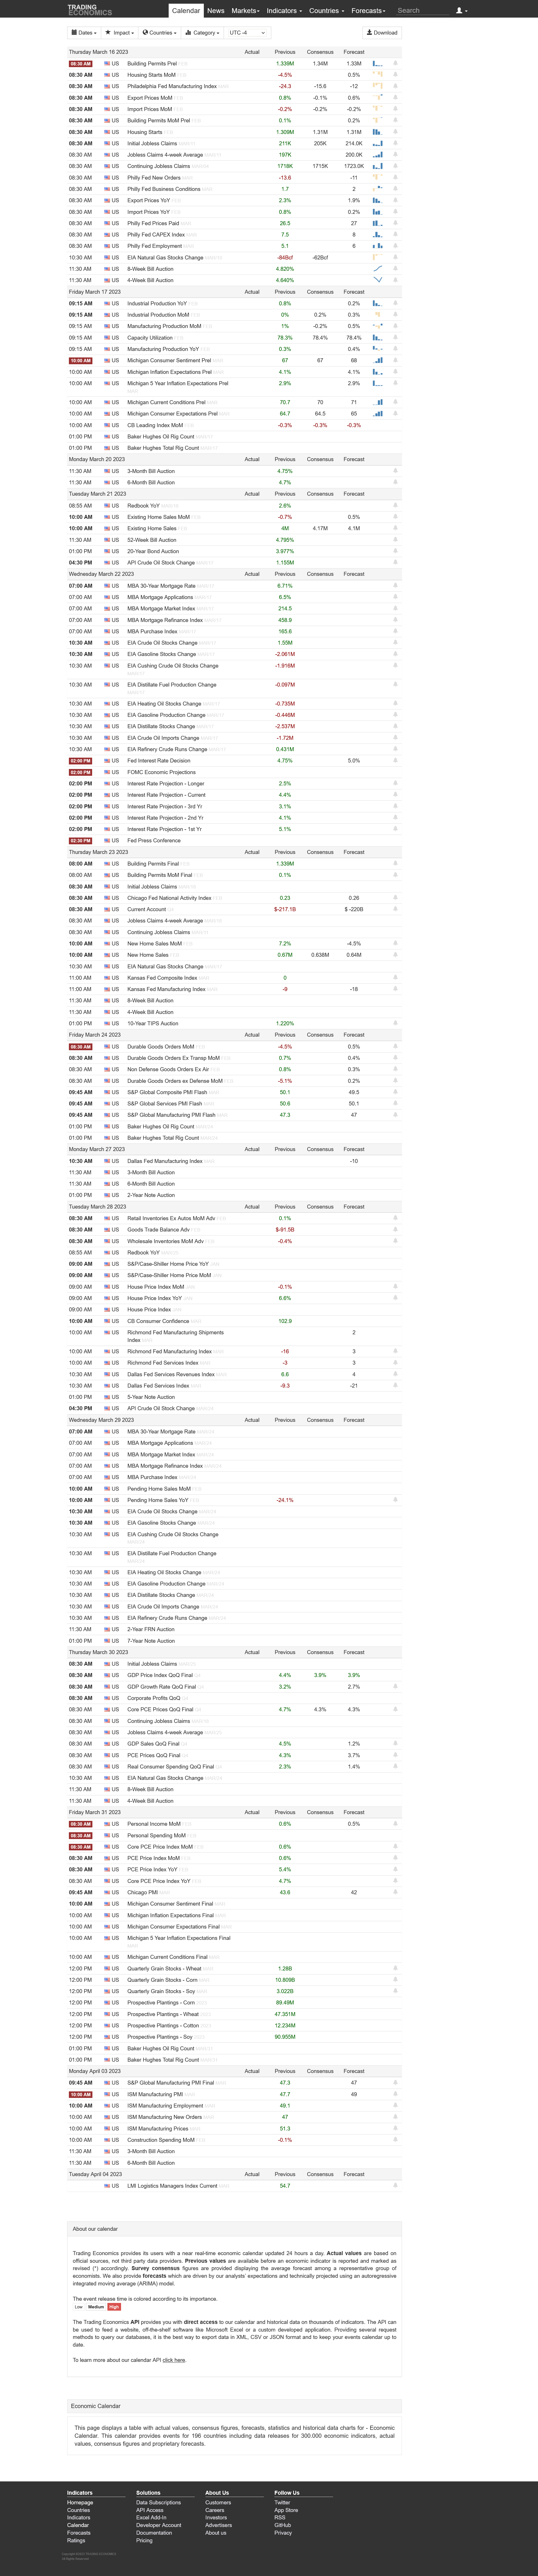
Price, Price Spread, Lagged Price/Volume Spread, and Binary Price/Volume Indicator
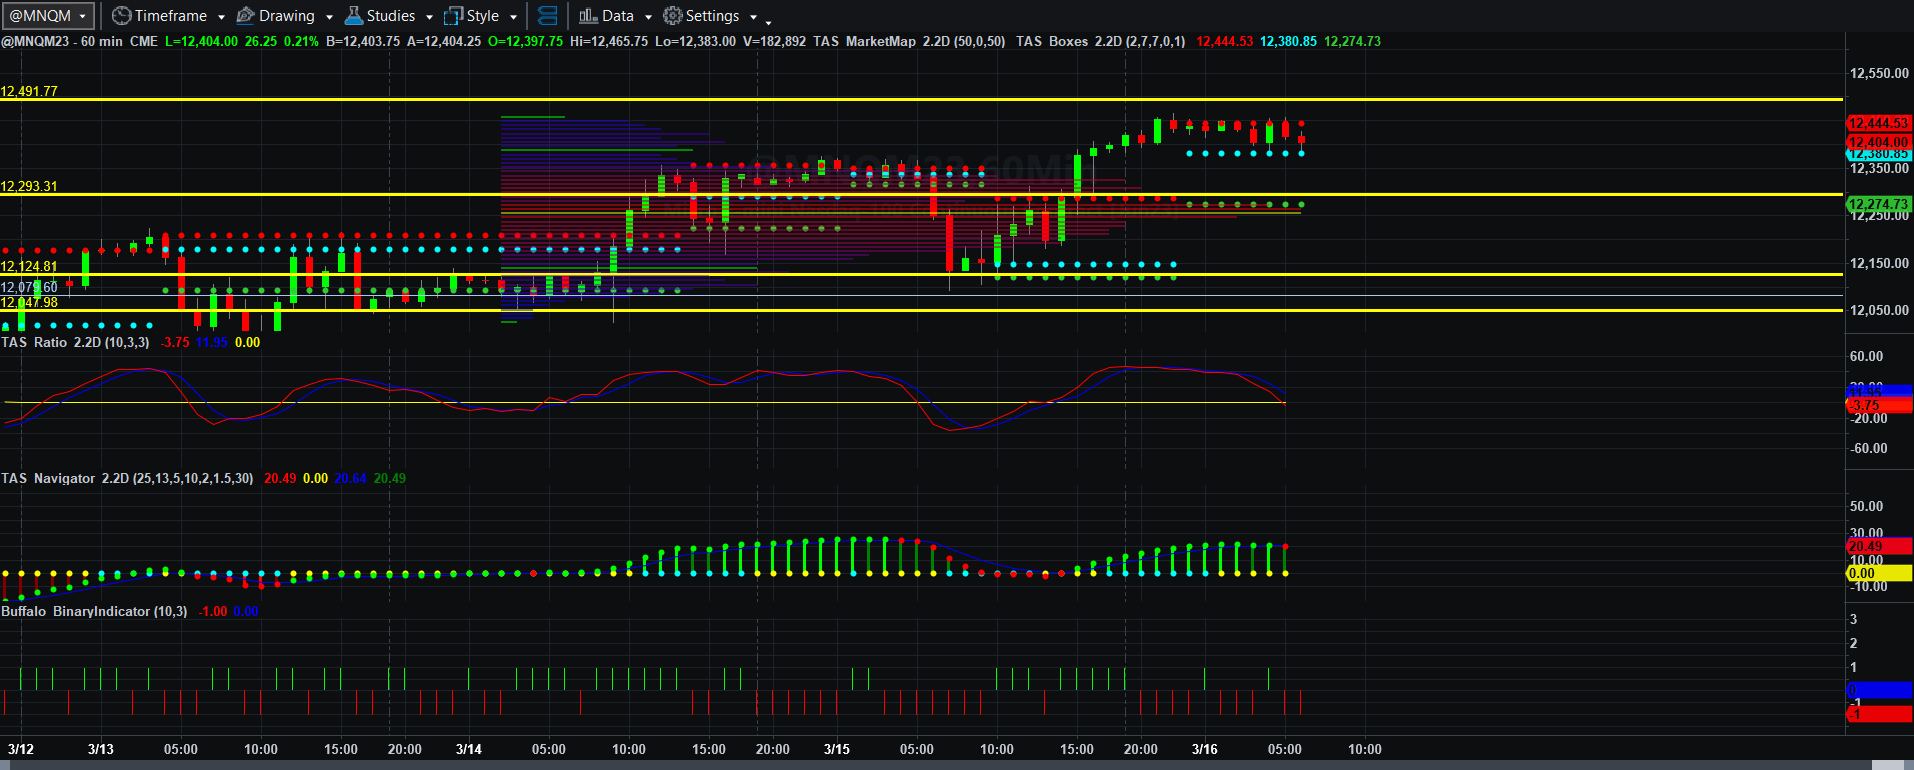
Price and Total Volume With 50-period Moving Volume Average
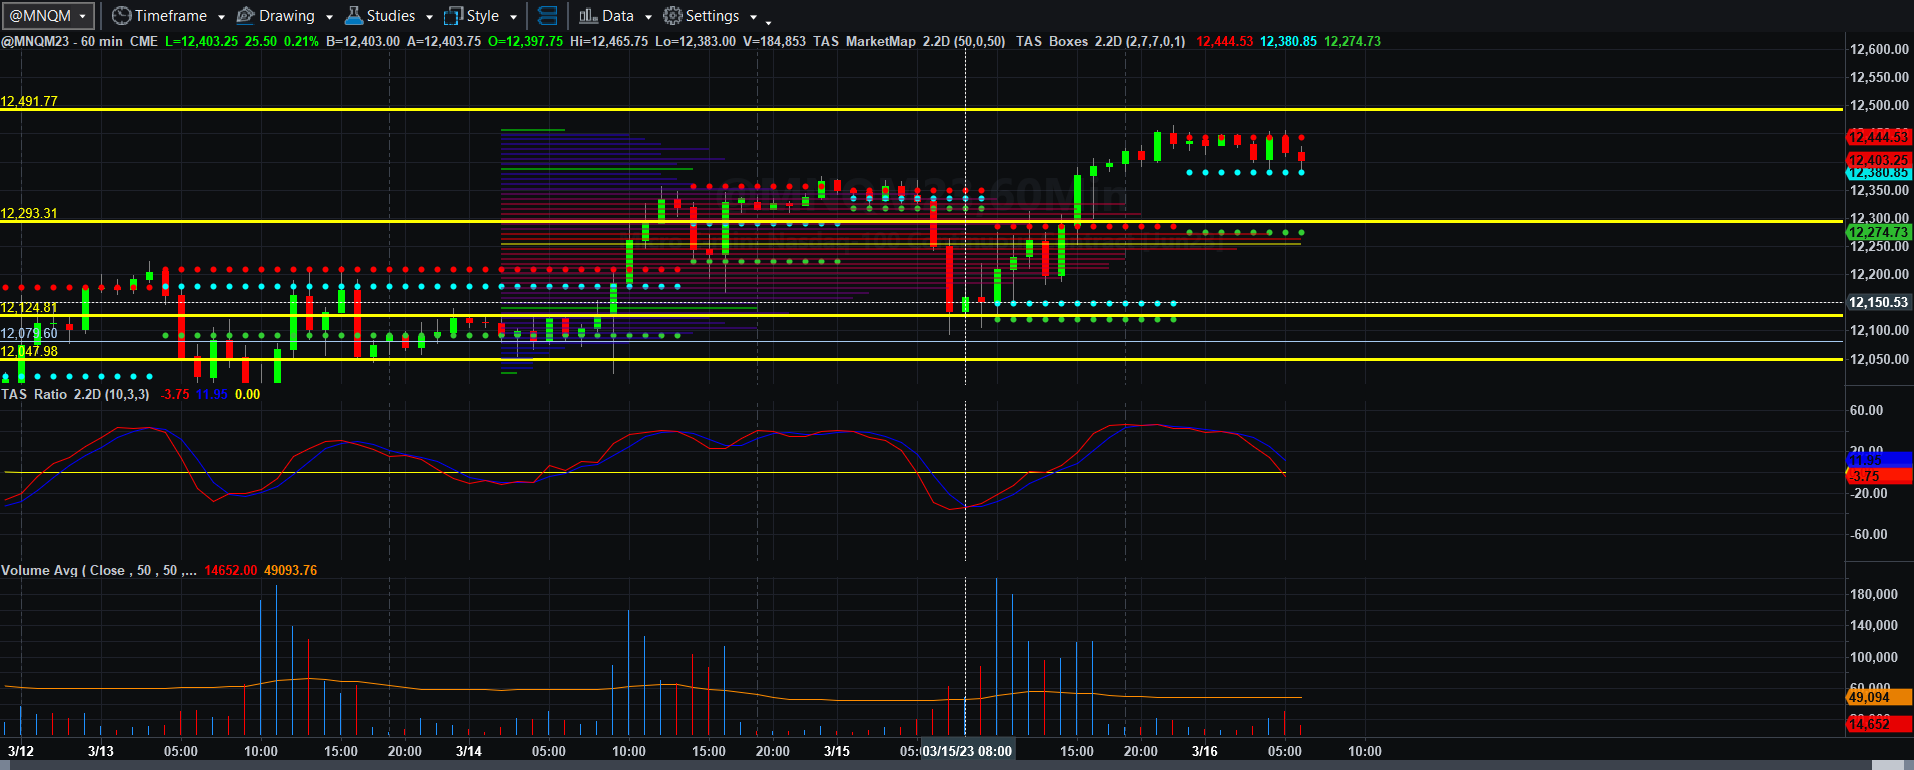
Fibonacci Price Scale With Targets
MNQH23 seems to be the most resilient of the stock index futures, as it seems to recover and attempt to press higher, even though it is still locked in that box between 10737.50 and 13038.75.
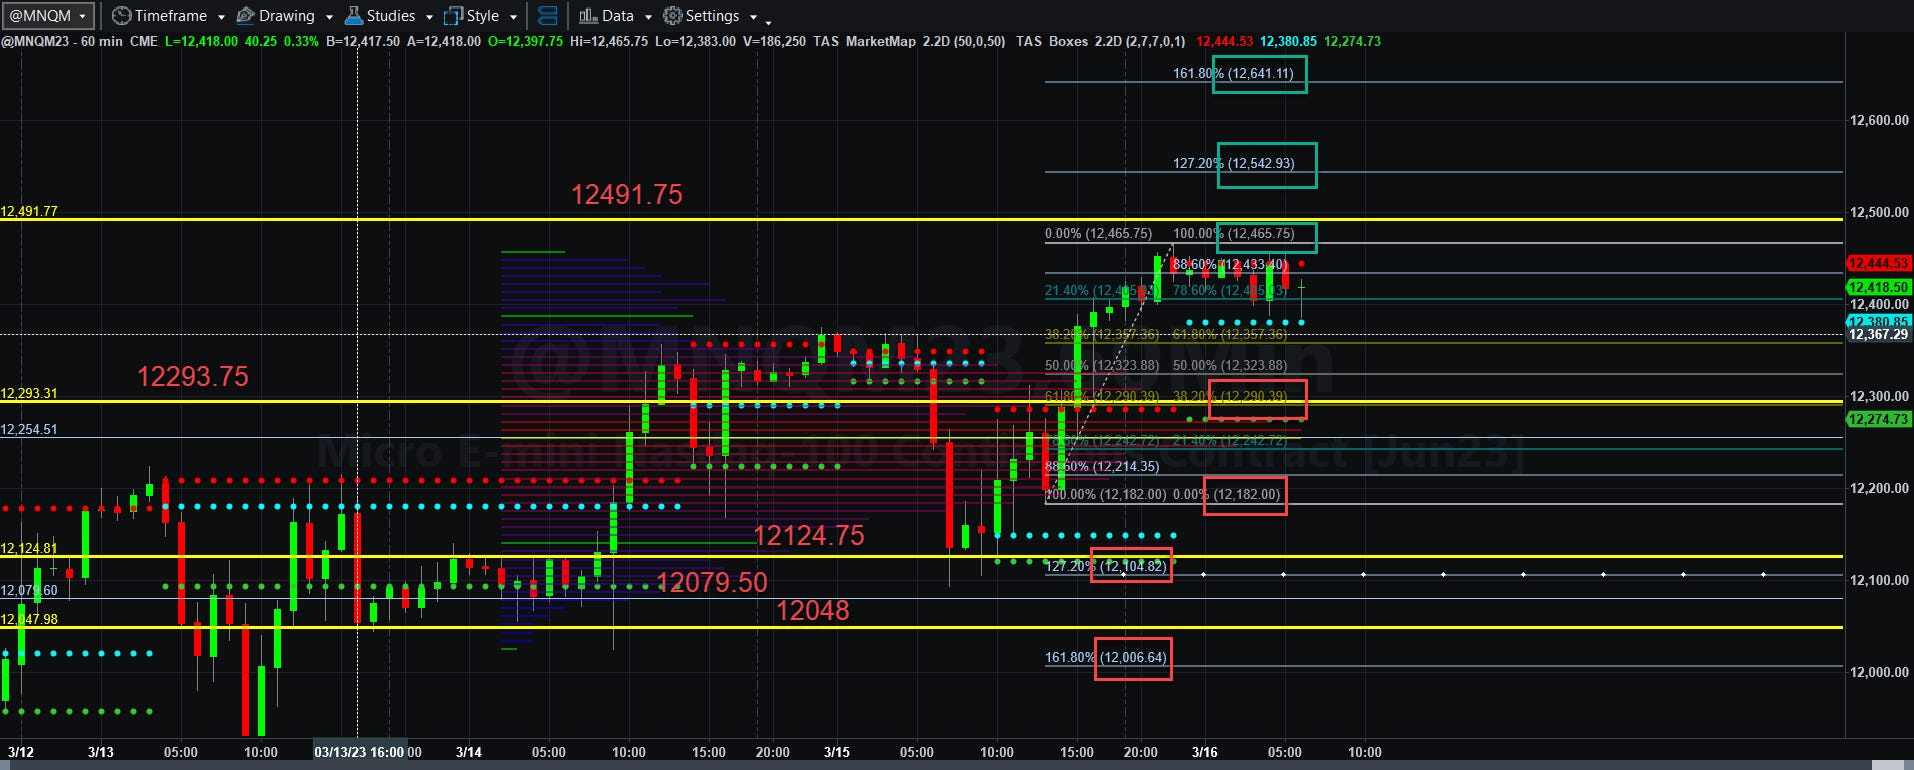
It is hard to say what Housing starts or Philly Fed manufacturing information or any other piece of jobless data will do today, the only thing I can focus on this the range of price action represented in the charts and to see how price momentum, Fibonacci patterns, and volume can do with it. I will let the crazies run the economy, and I will read what the charts tell me to decide what to do.
If MNQH23 can remain above the old 12293 VWAP line (and today’s 12234.50 VWAP line, it can easily take out 12466.75 and hade toward 12343 and 12641 in the next couple of days. If not, a retest of that 12293 will be made to the downside and because of the strong rally yesterday, there could be a relatively easy retest back through those long bullish candlesticks to 12182, 12105, and if 12124 and 12048 VWAP lines, back to 12006 perhaps by Friday.
We will simply see if Philly Fed numbers pour cold water on Fed data and administration claims of a wonderful economy ( that isn’t because of painful consumer inflation at the street level). We will simply have to watch what happens.
Yesterday, in what seems to be a strange week, I recovered an initial boot and was left at breakeven. I am slowly working my way into dealing with the wild volume spikes I see at the turn, waiting for prices to settle before entry. Price action has been crazy these last few days, but at least my analysis has kept me moving in the right direction.
More will be coming soon! Have a wonderful and profitable day trading, and a fantastic Thursday also!
Today’s Economic Data Courtesy of Trading Economics dot com. Be sure to refresh the date at the top left.