

Price, Price Spread, Lagged Price/Volume Spread, and Binary Price/Volume Indicator
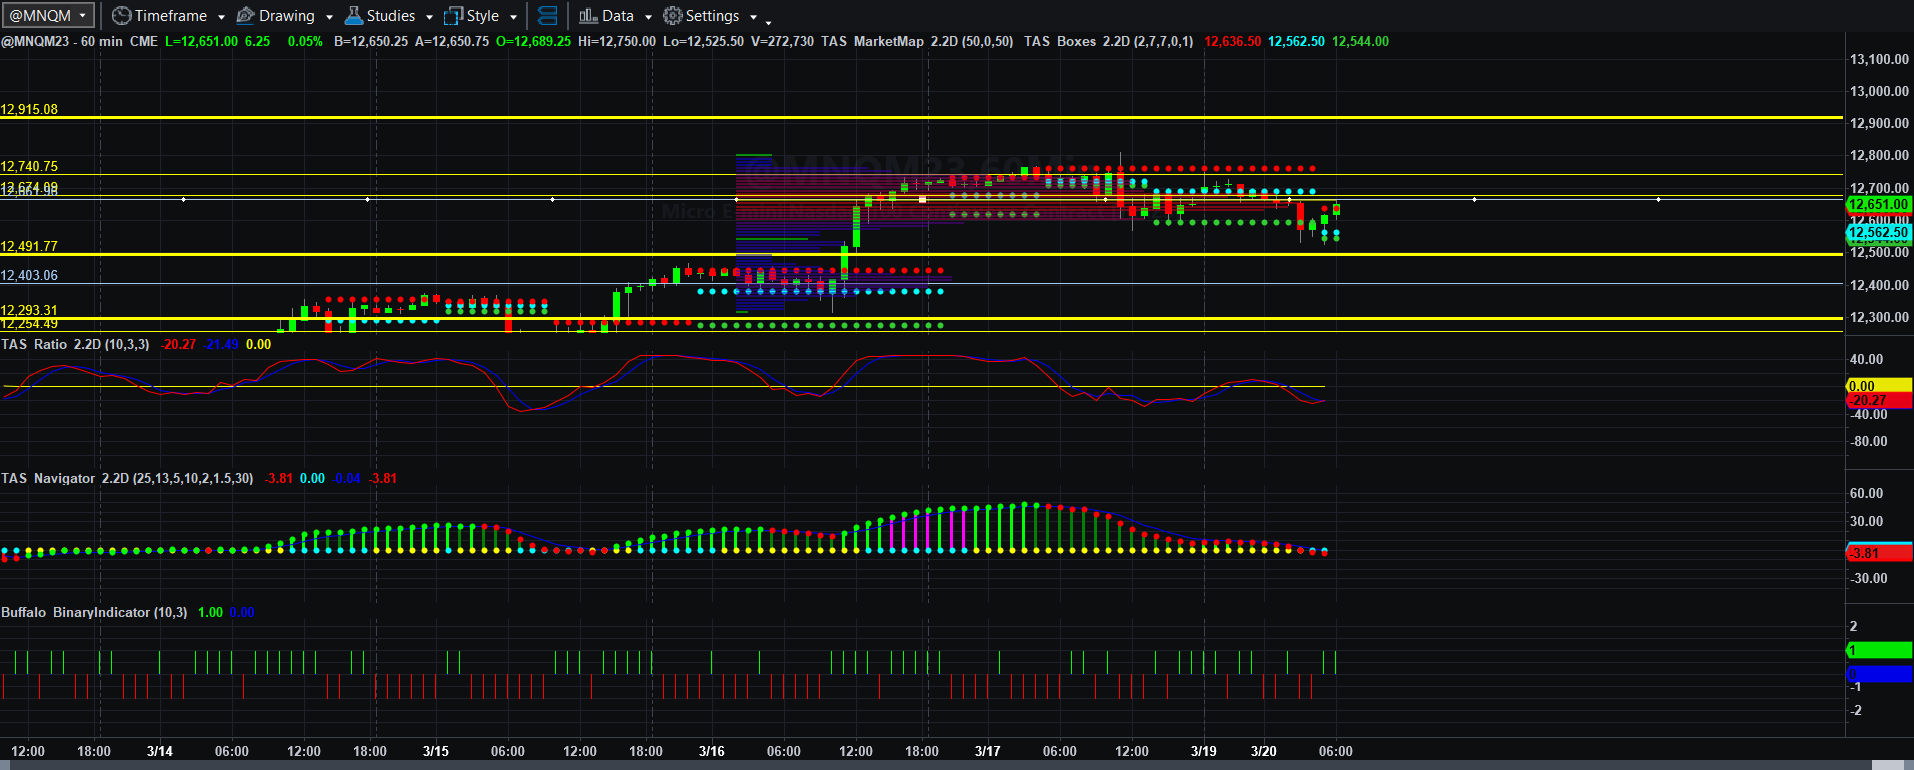
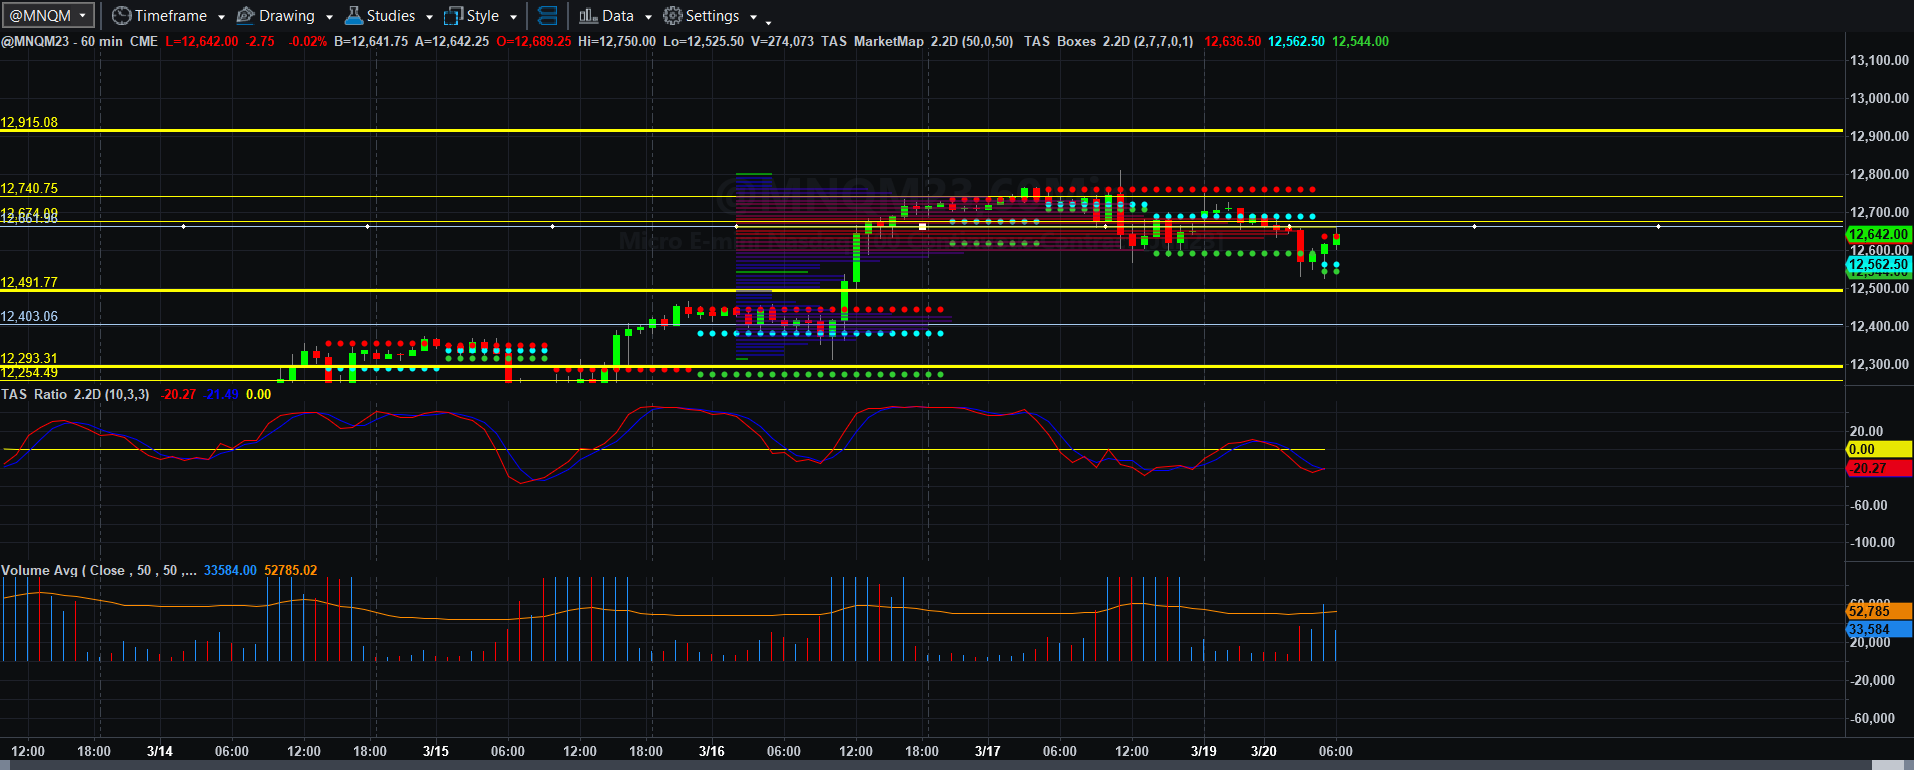
Price and Total Volume With 50-period Moving Volume Average
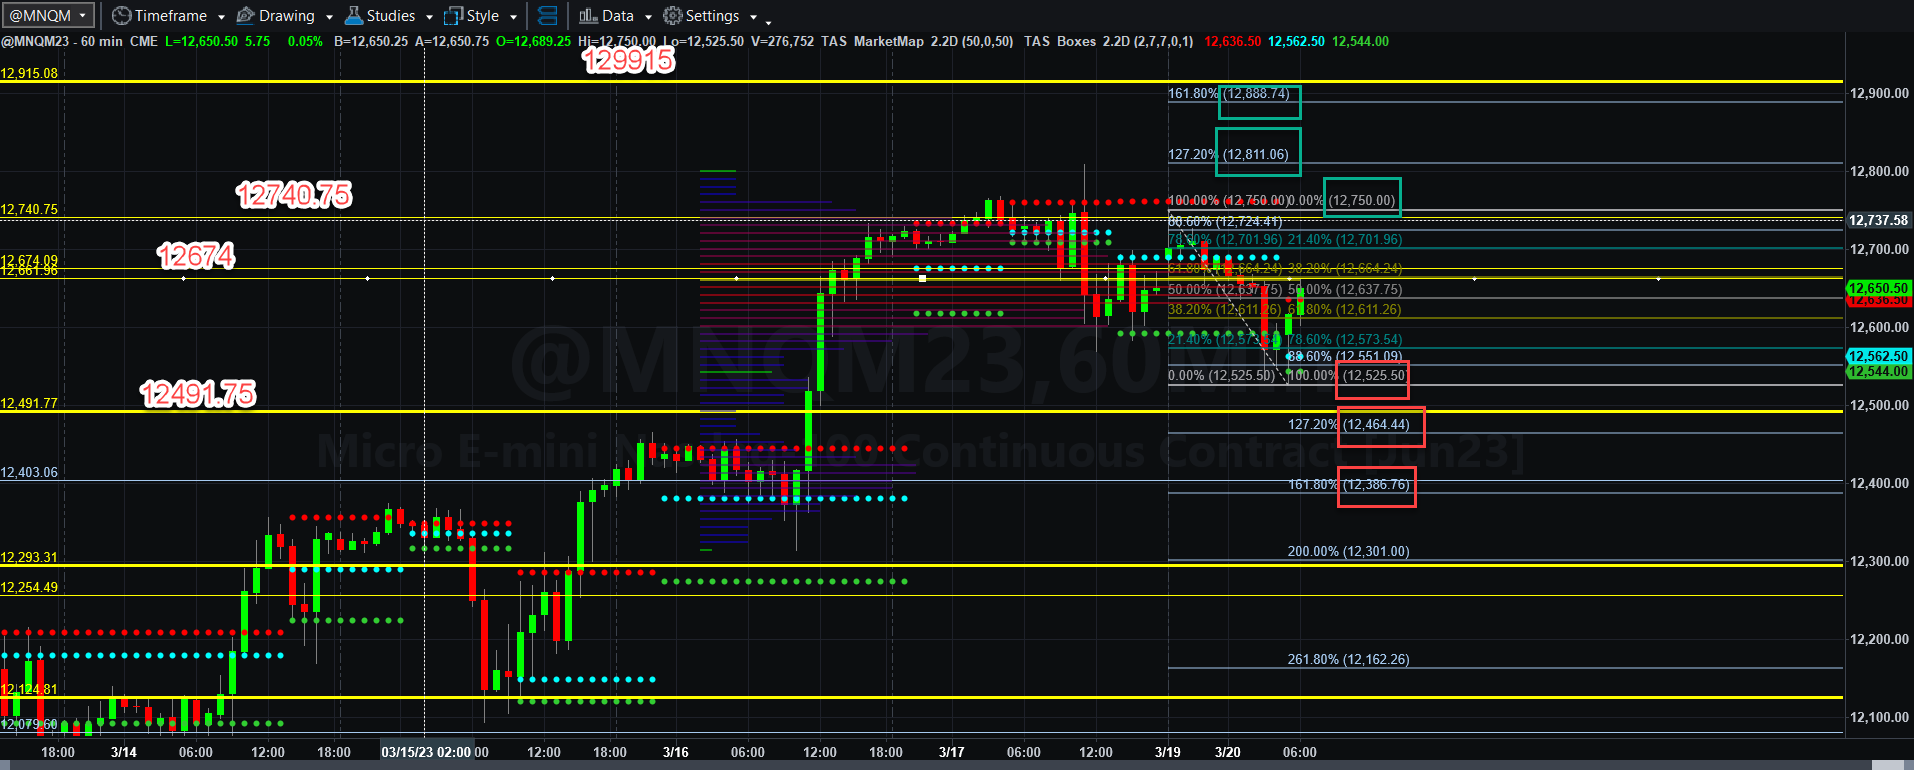
Fibonacci Price Scale With Targets
Asian and European traders initially sold MNQM23, I assume to take profits from the spike rally on Thursday and perhaps on fears of banking problems in the USA. I have no idea why, but it is what it is. At around 0300 EDT, Europeans began buying again, and we have a slight rally going as I write this, the house price momentum spread is slightly negative. We will have to see how all that shakes out at 0930 EDT this morning at the U.S. market opening.
The economic news is light today, but banking issues and all other kinds of economic and political nonsense will continue to fill headlines. If you look at the yellow WVAP lines (marking central control points), there is a ton of opportunity above and below current levels in a breakout. It means there is a possibility (but NOT A PROBABILITY) that price action could be accelerated upon a breakout in either direction.
If MNQM23 can get above 12674, 12750 should be easily achievable, and 12811 and even 12888.75 is possible within the next couple of days. The next WVAP resistance is at 12915.
If that doesn’t happen, it’s a quick trip back to 12525.50, 12491.75, 12464.25, and 12386.75 within the next couple of days.
It all depends on which side shows up in numbers. Wednesday will be carnival day (Fed rate decision day), so there probably will be fireworks from which traders can profit from the resulting volatility. Only time will tell.
That is all for now. More will be coming shortly. Have a fantastic profitable and productive Monday!
Today’s Economic Data Courtesy of Trading Economics dot com. Be sure to refresh the date at the top left.
