

Price, Price Spread, Lagged Price/Volume Spread, and Binary Price/Volume Indicator
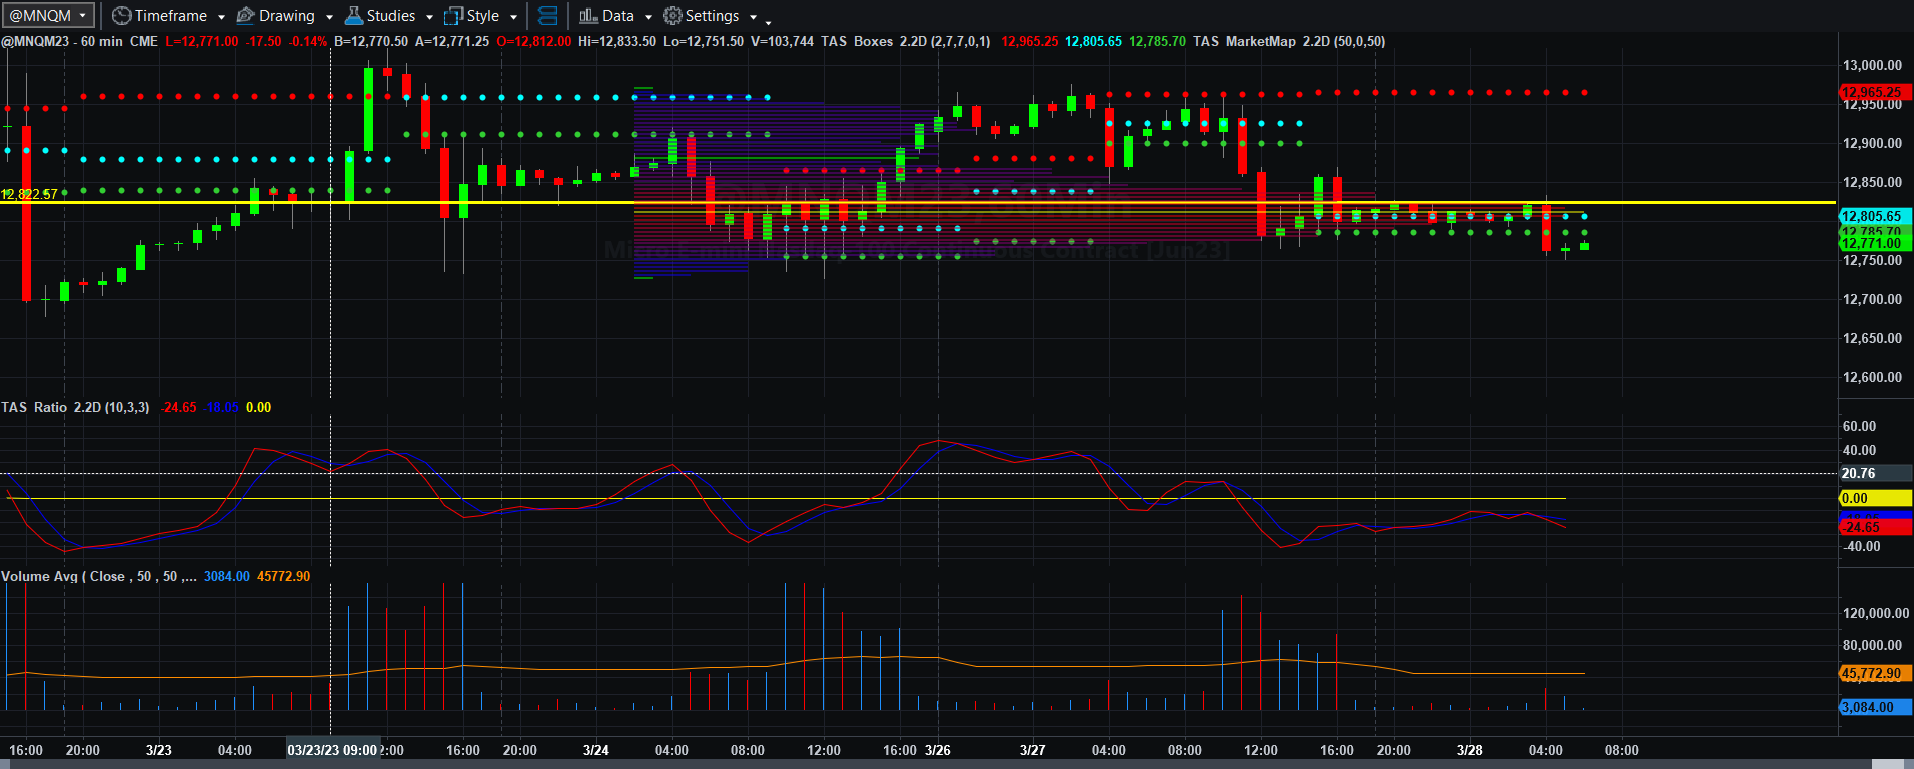
Price and Total Volume With 50-period Moving Volume Average
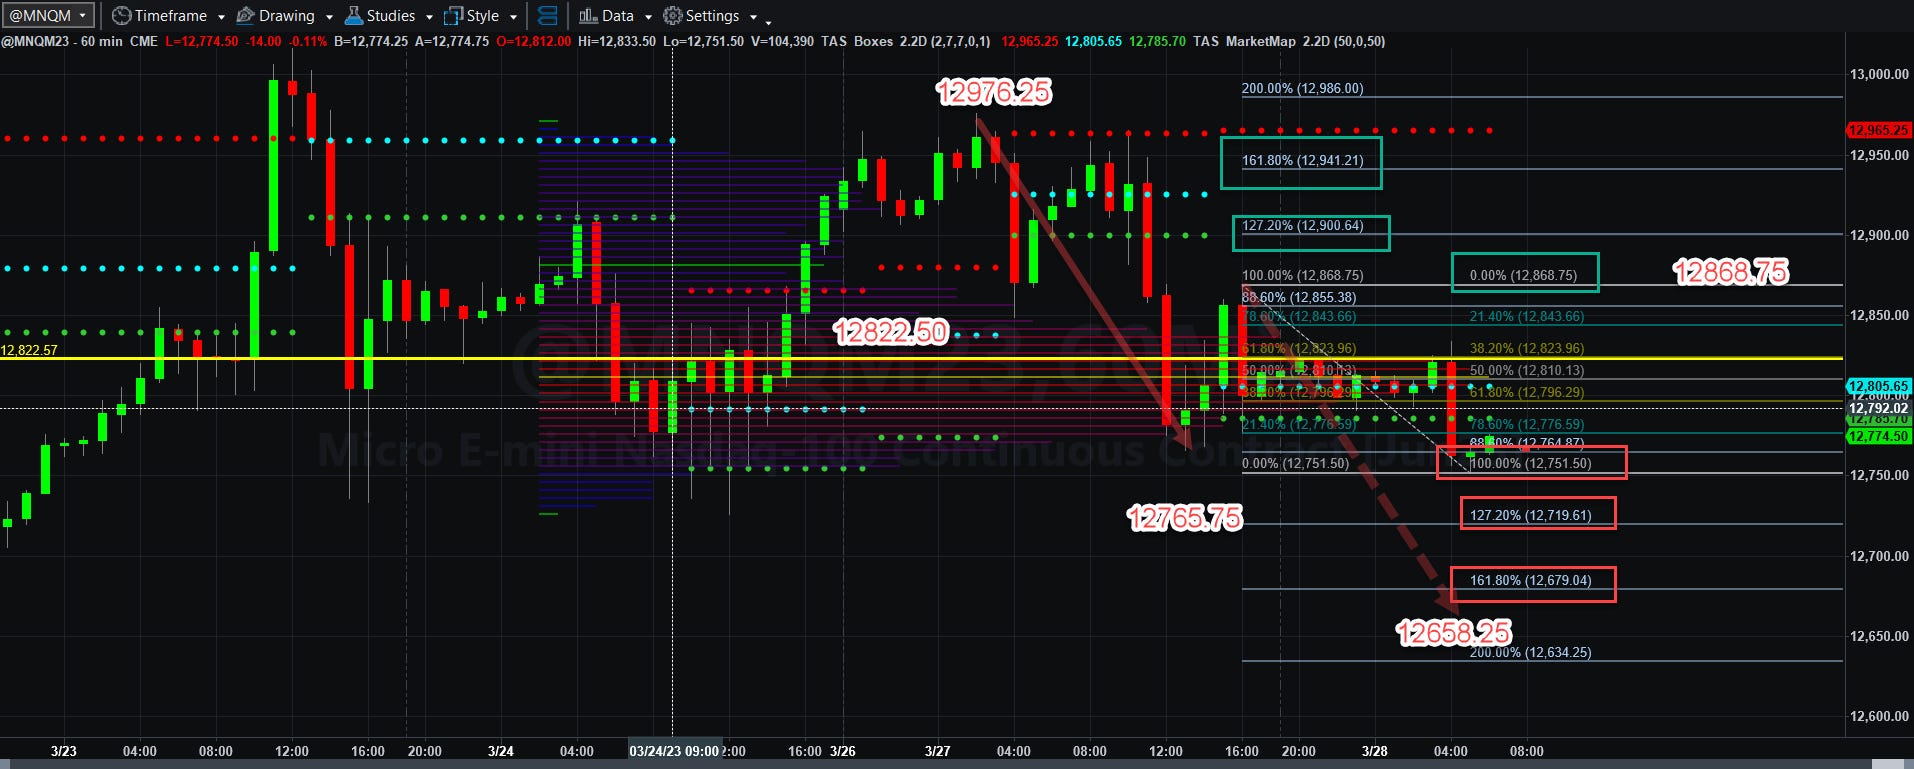
Fibonacci Price Scale With Targets
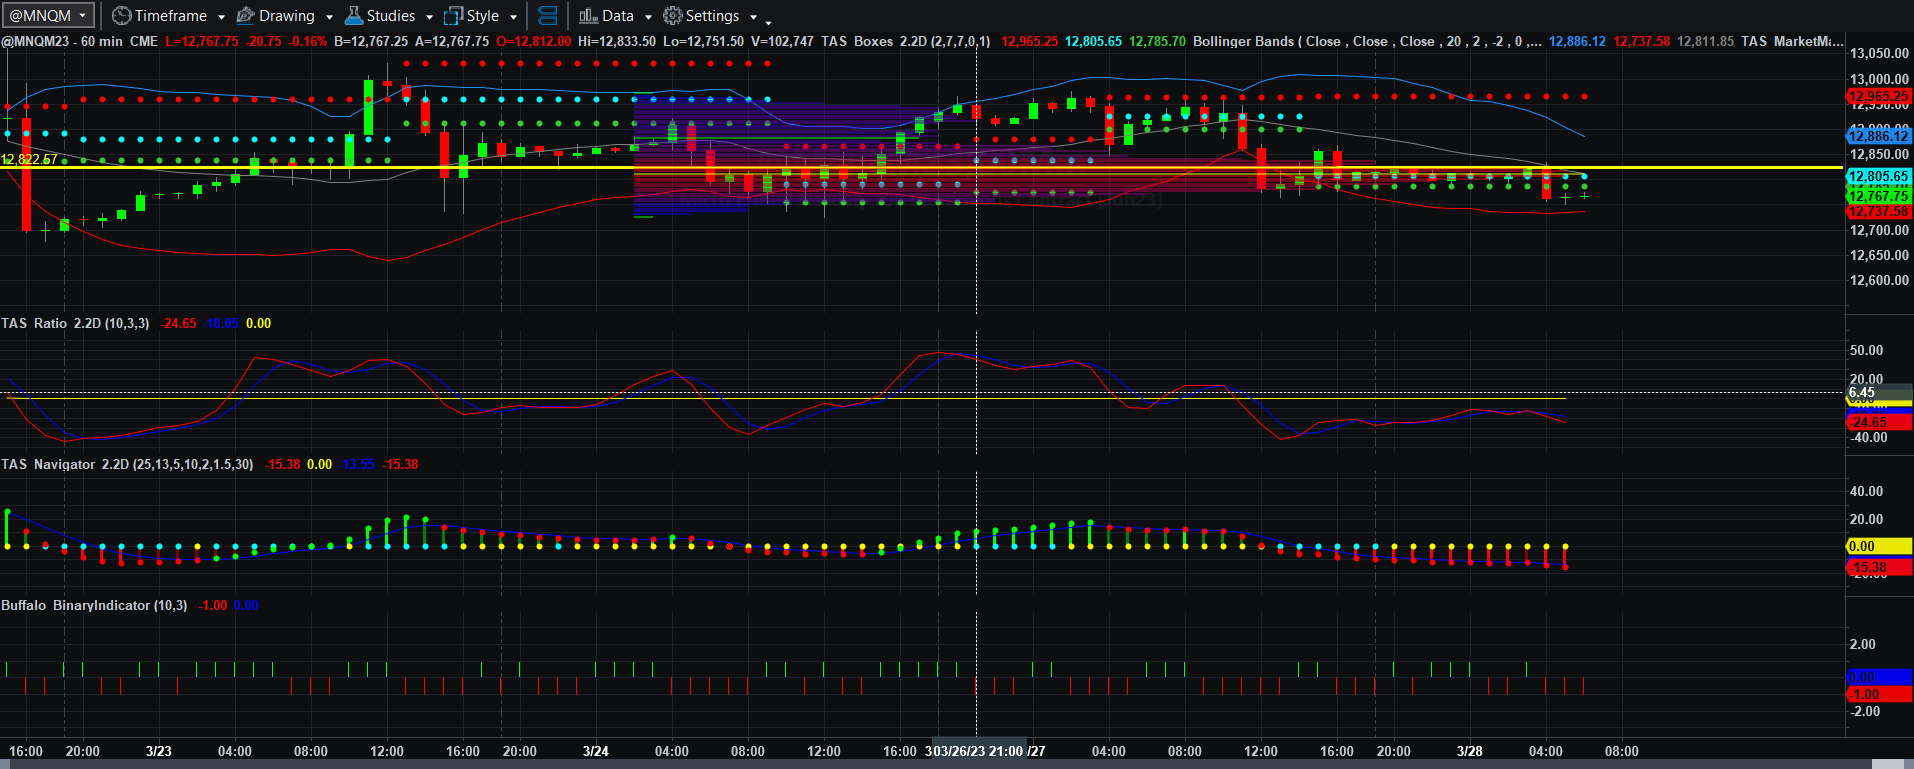
Asia seemed complacent overnight, but there was selling early in the European session for MNQM23, and despite the last few hours’ tepid rally, all the spreads seem a bit bearish.
To keep it simple, with all the long candle sticks in that chart at key pivot areas ( meaning that reactions to trade are sharp, I used the high and the low of the overnight session as the basis of price measurement. Any break outside of that range could be quite dramatic, as markets tend to respond to capture long what was removed on the short side.
If MNQM23 can rally above the 12822.50 VWAP, it could easily run back to 12868.75 and beyond to 12900.50 and even 12941.25 in the next couple of days. If not, 12751.50 could be easily breached, and 121719.50 and 12679 are possible in the next couple of sessions.
If selling remains robust, it is not impossible for a time-asymmetric low of 12658.25, which is quite close to the 161.8% extension of the Fibonacci price scale used in those estimates.
I have no idea how all the peripheral news around this market will shake out. All I will do is watch the price spread and volume spread work together before taking trades with strong volume. I was booted again yesterday on a short trade, which eventually broke after 1130 to the downside (which was 30 minutes past the end of my trading session).
That is all for now. Have a wonderful Tuesday and a wonderful day trading.
Today’s Economic Data Courtesy of Trading Economics dot com. Be sure to refresh the date at the top left.