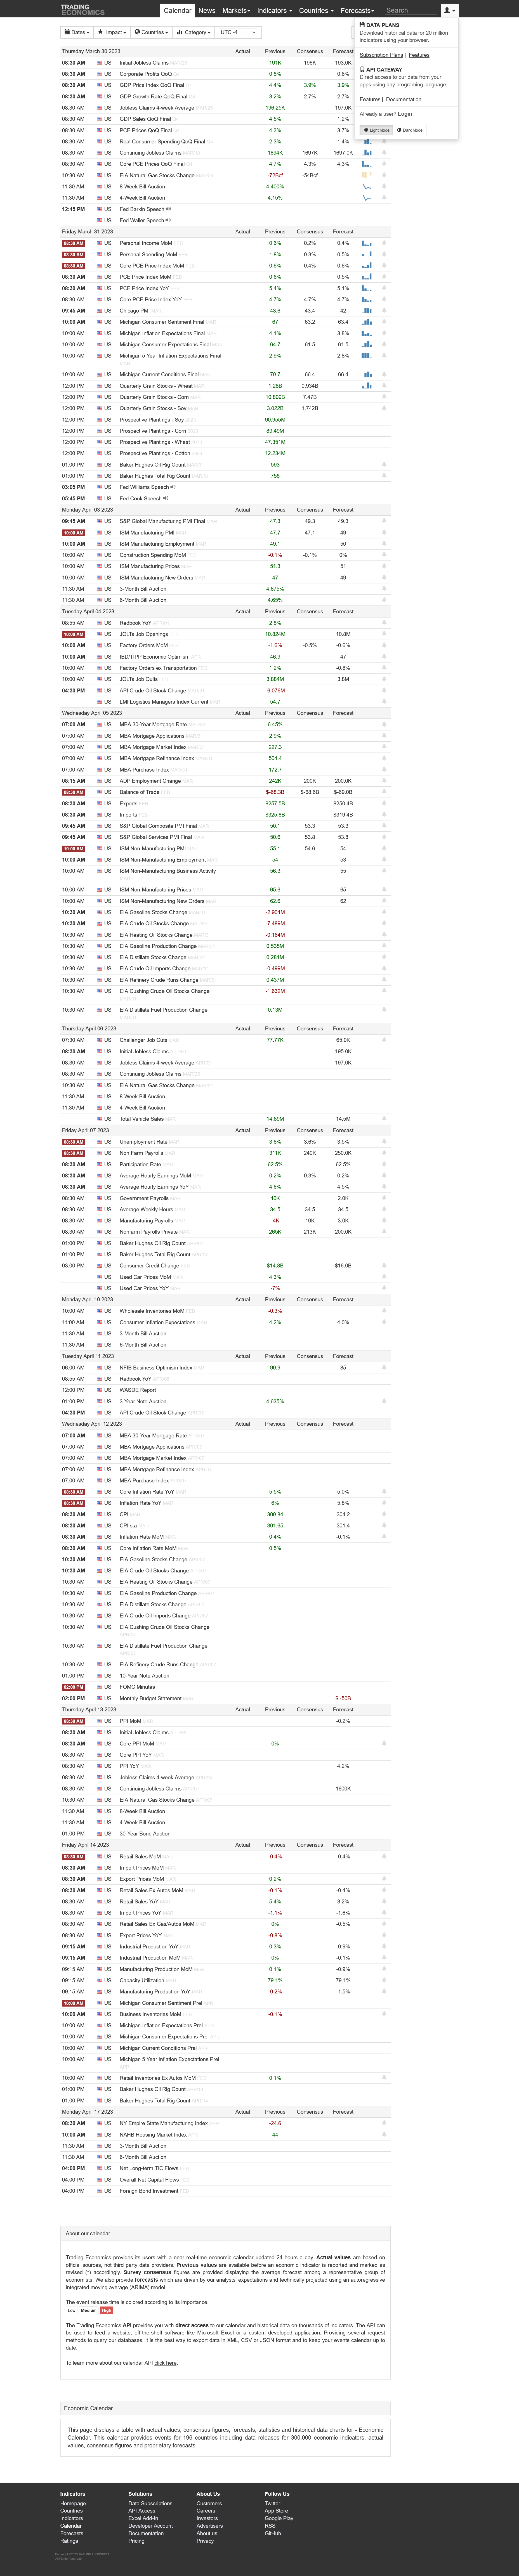
Price, Price Spread, Lagged Price/Volume Spread, and Binary Price/Volume Indicator
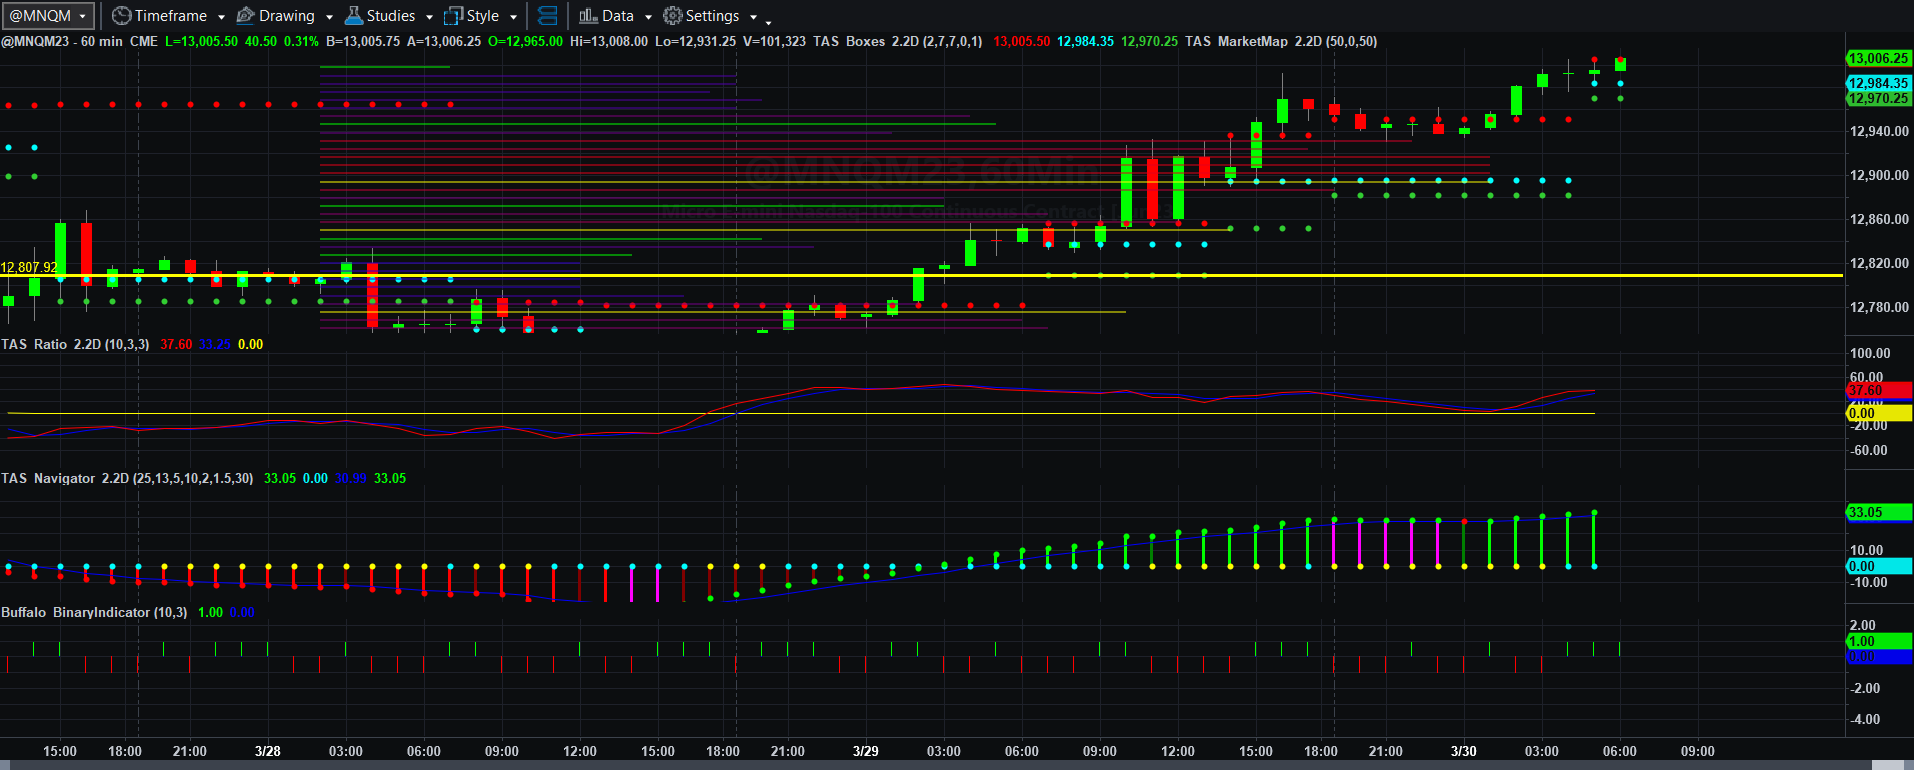
Price and Total Volume With 50-period Moving Volume Average
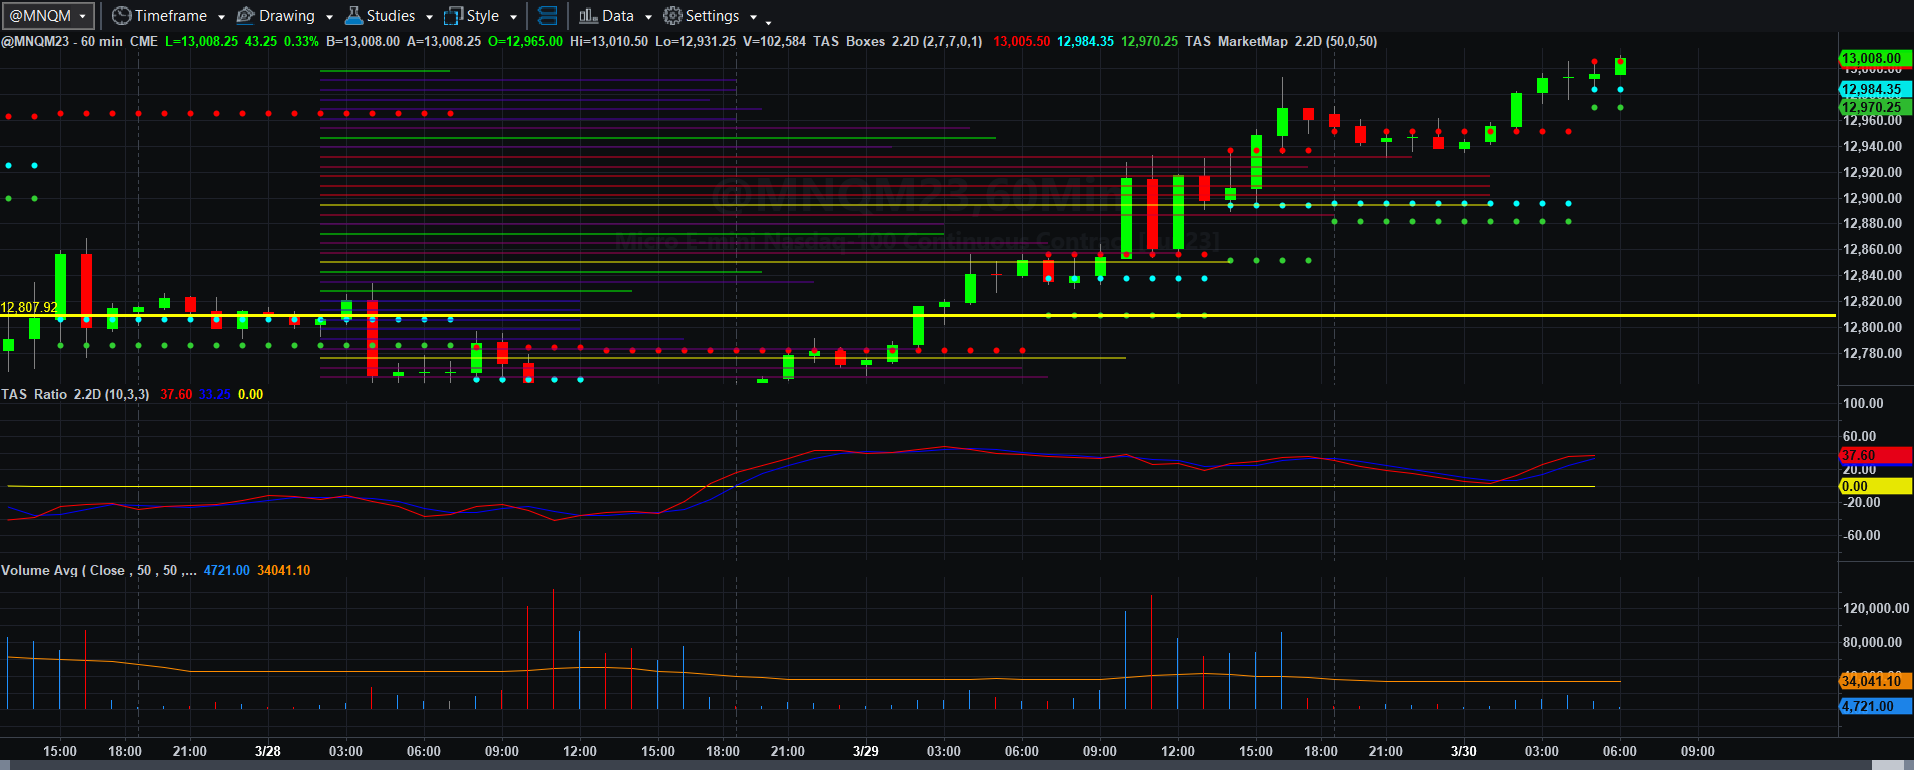
Fibonacci Price Scale With Targets
Last night in the rather uncharacteristic fashion of the previous nights. Asia picked up the buying habit for MNQM23 after a small session of selling and Europe continued to buy, which left us where the basic Fibonacci scale is today, from 12931.25 to 13010.50 which was just exceeded in the 600 EDT hour.
GDP and Jobless claims could send the market much higher or potentially lower, given the Fed-centric market action caused by governmental indecision and politics. All I can do is measure price action. You can see in dotted green lines the potential (NOT PROBABLE) reach we could make via bullish AB=CD action to13094. I have no idea if that will work, but if the rally continues, the odds improve that that target could be reached.
If MNQM23 can remain above the 12894.25 VWAP, then it will continue on beyond 13010 to 12032, 13059.50, and 13089.75 and beyond even 13094 by tomorrow.
If not, we probably turn back to 12931.25 12882.25, and 12852 assuming 12894.25 is broken to the downside.
Right now, I have no idea which way this market will go as we have no idea how traders will react to this data or other general insanity of current economic and political news. All I can do is follow my trade plan.
I scratched (net zero) yesterday on rather crazy volume conditions, but I was happy and moved on to other things as the rally moved forward. We will continue to see volatility like this until true Fed policy is settled. Don’t hold your breath until that happens. I did the number 1 thing traders should do and that is to PROTECT CAPITAL.
More will come soon. Have a happy, productive, and profitable Thursday!
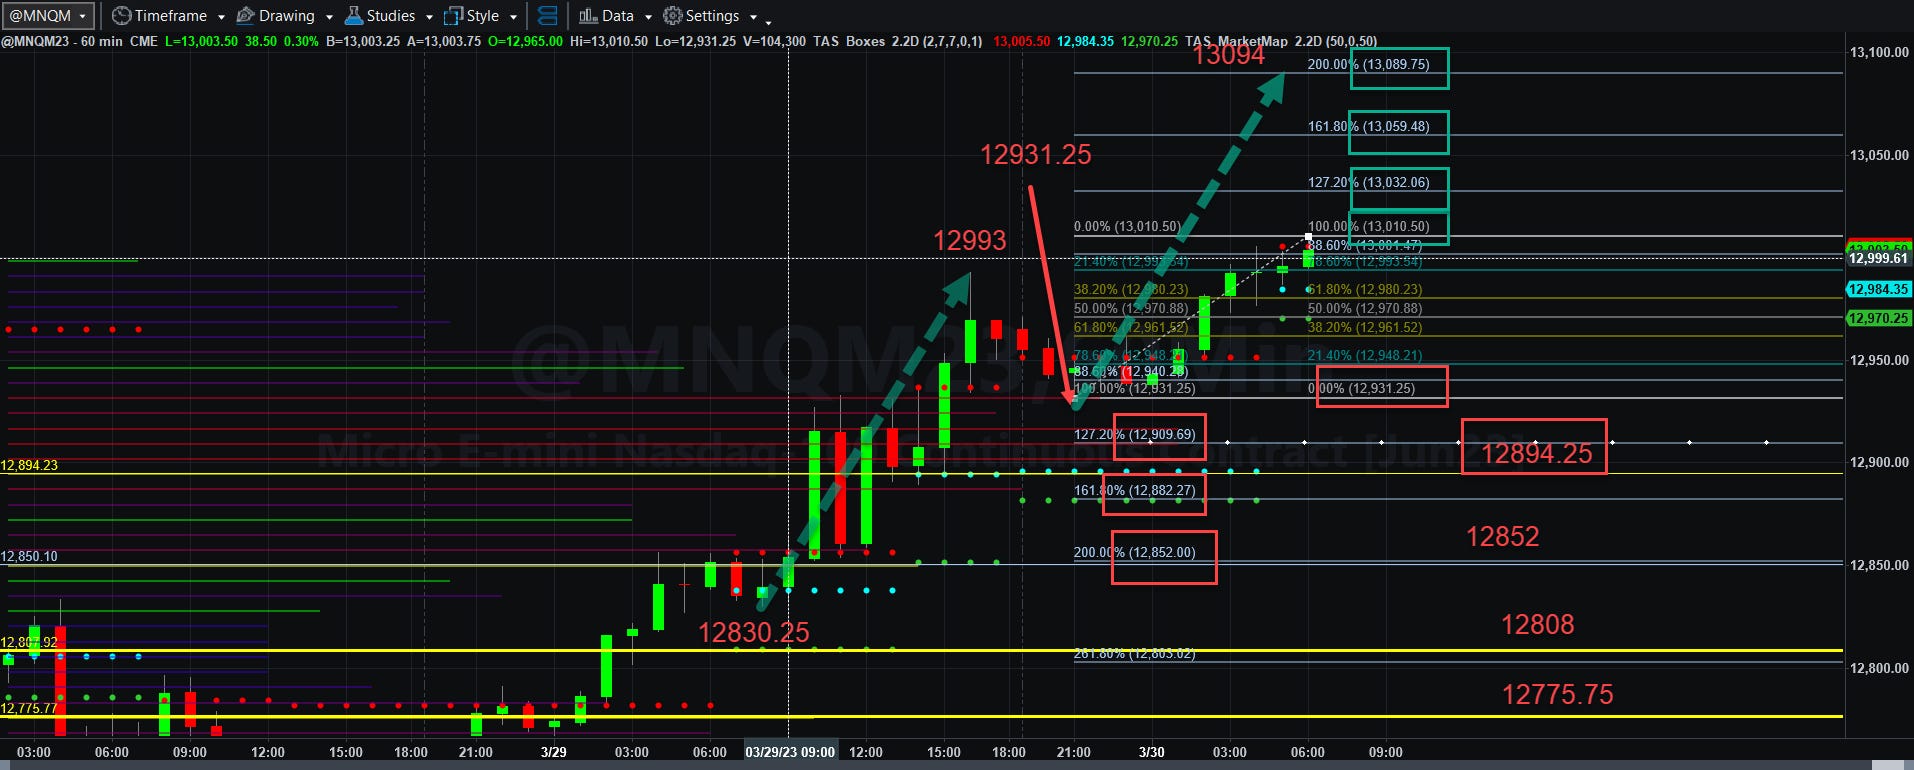
Today’s Economic Data Courtesy of Trading Economics dot com. Be sure to refresh the date at the top left.