

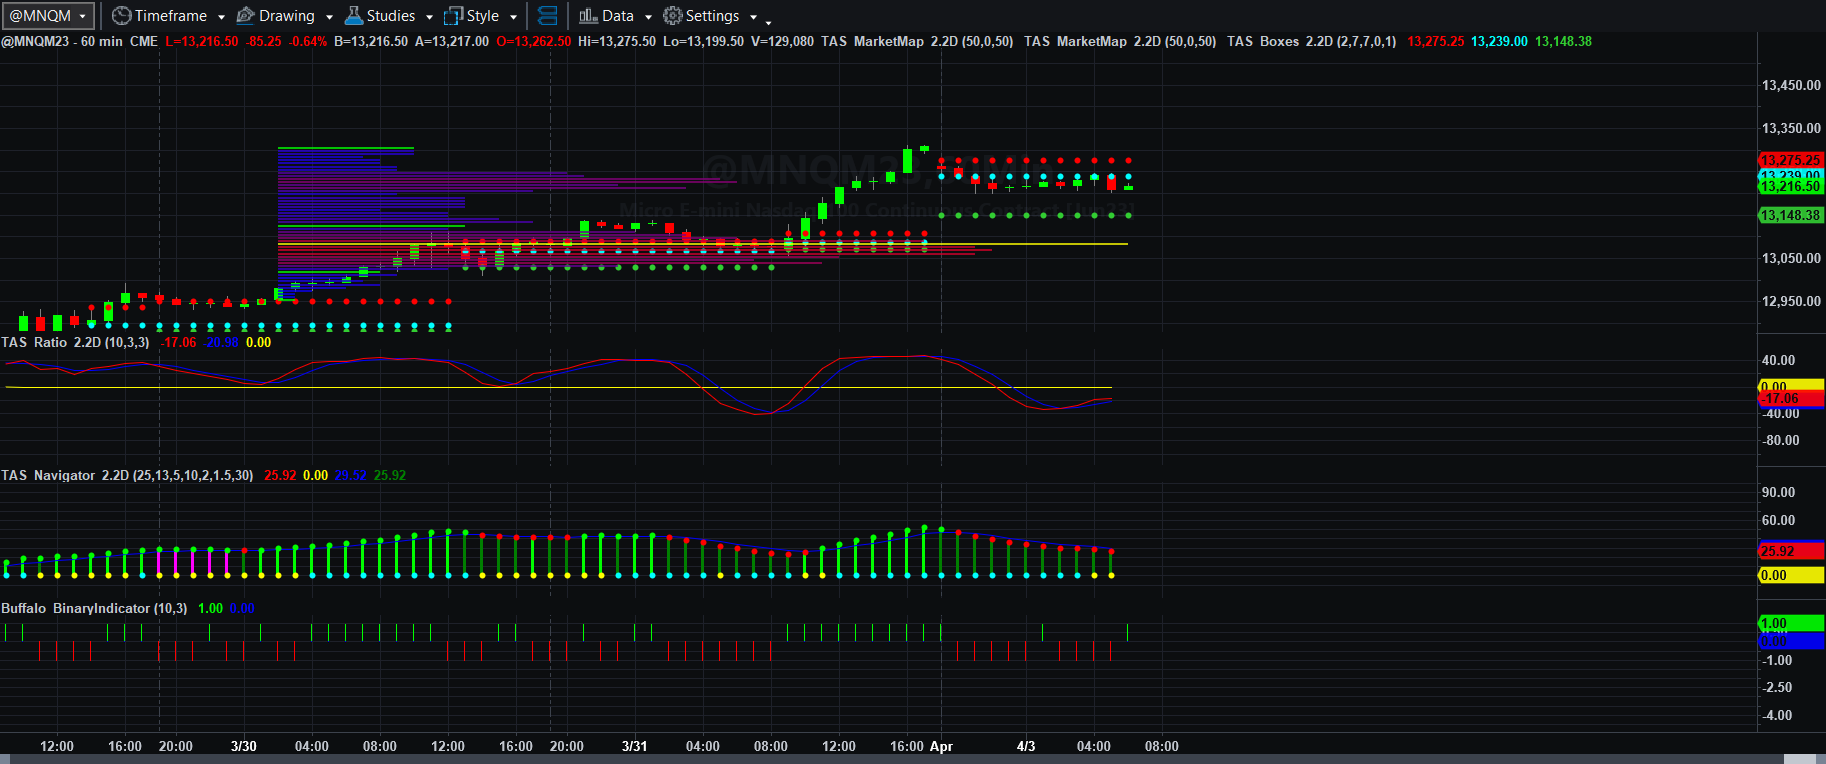
Price, Price Spread, Lagged Price/Volume Spread, and Binary Price/Volume Indicator
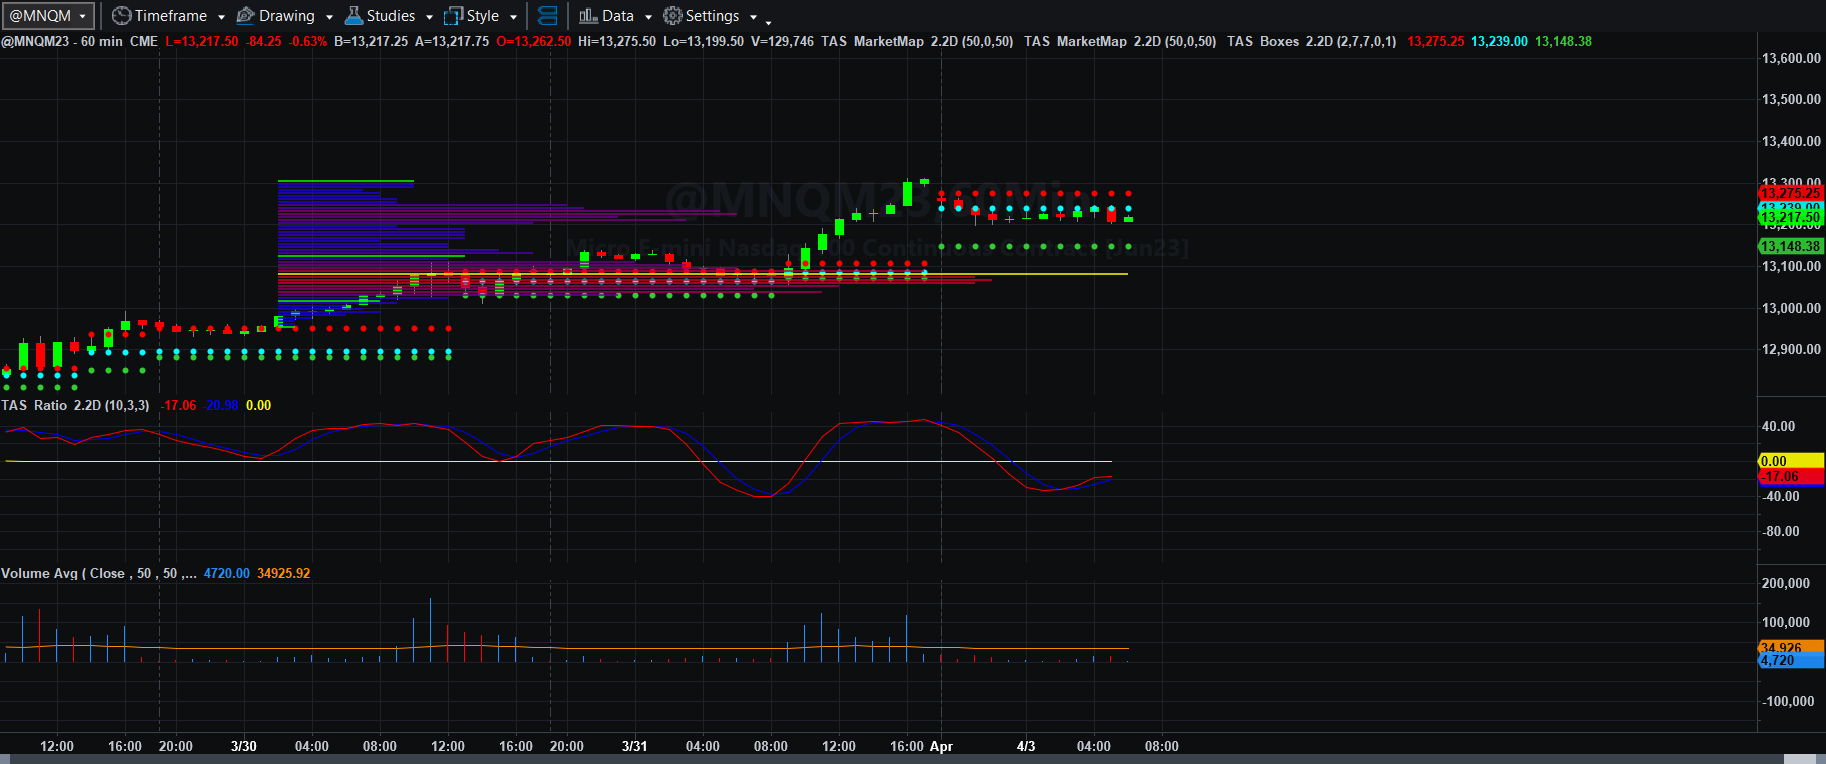
Price and Total Volume With 50-period Moving Volume Average
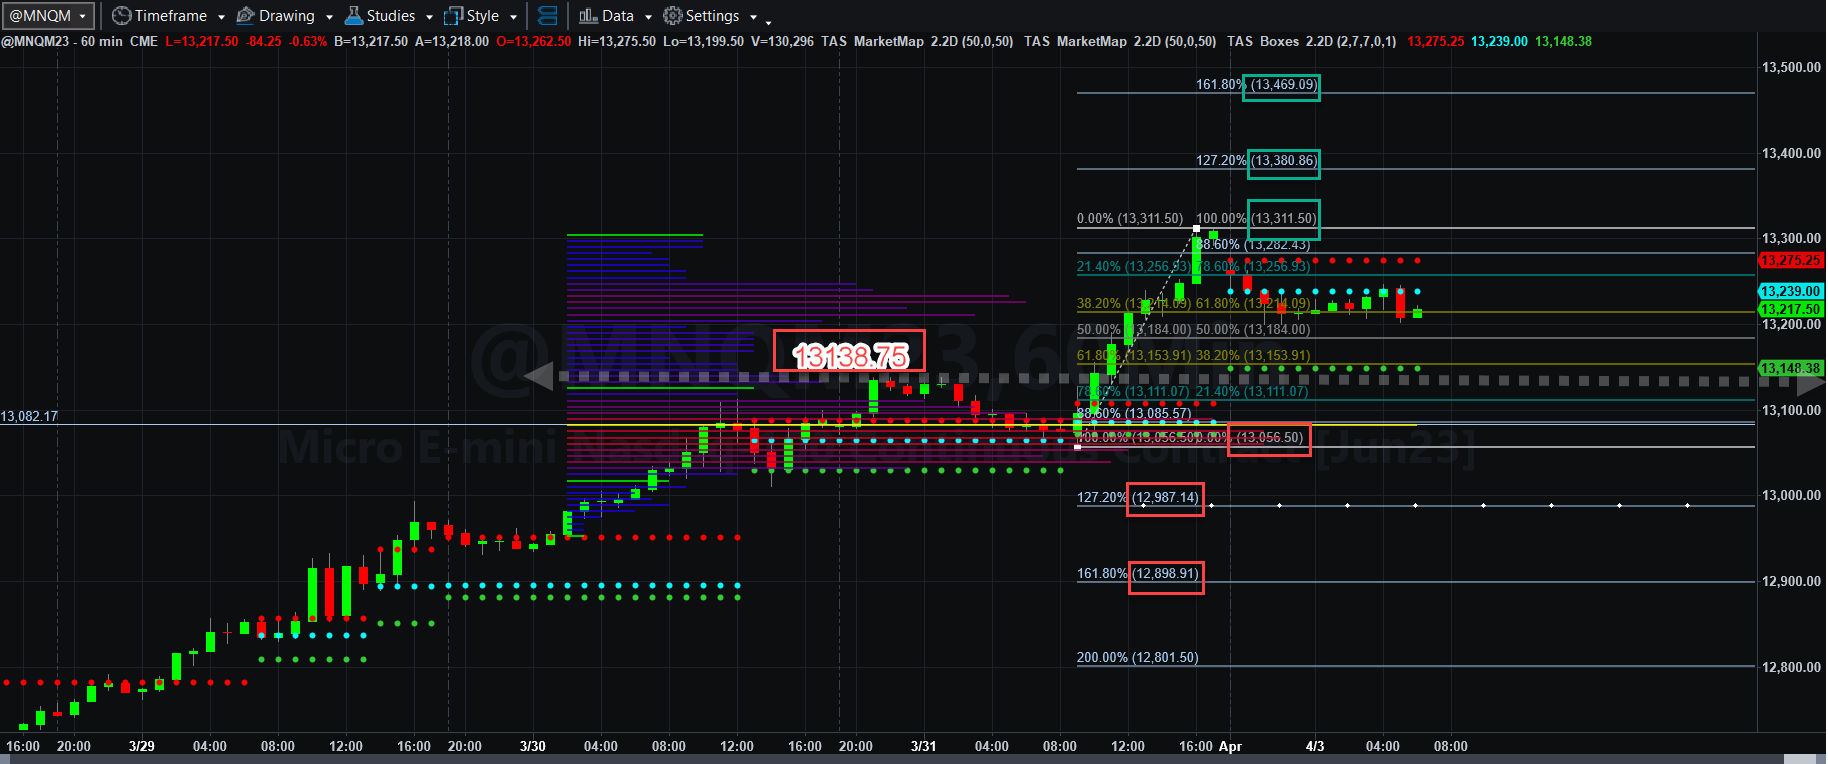
Fibonacci Price Scale With Targets
As seems to be ritual in MNQM23, Asian and European traders either shave off the excesses of every rally or cover short positions on every selloff and today we have the former case in clear display, though the selloff has been fairly shallow thus far.
If MNQM23 can remain above the VWAP line of 13138.75, odds are decent that we can see highs retesting Friday’s high of 13311.50, and perhaps rallying to 13380.75 and beyond to 13469 over the next couple of days.
If not, then we likely retest support around the 0.618 retracement level clat 13154 and price structure support at 13138.75. if the price breaks below the swing low at 13056.50, then 12987 and 12899 could be hit in the next couple of days.
I am not going to project how the manufacturing and construction data is going to affect price action. All I can do is take a look at how price momentum, Fib patterns, and volume and volume profile match up with my trading plan.
I made a booboo in the video I produced yesterday (and that YOU should have watched) when I mentioned profits. I pulled out net 25 NQ points long early in the session and I was off to other business after that.
We will see what happens today. Have a fantastic and profitable day today! More soon.
Today’s Economic Data Courtesy of Trading Economics dot com. Be sure to refresh the date at the top left.
