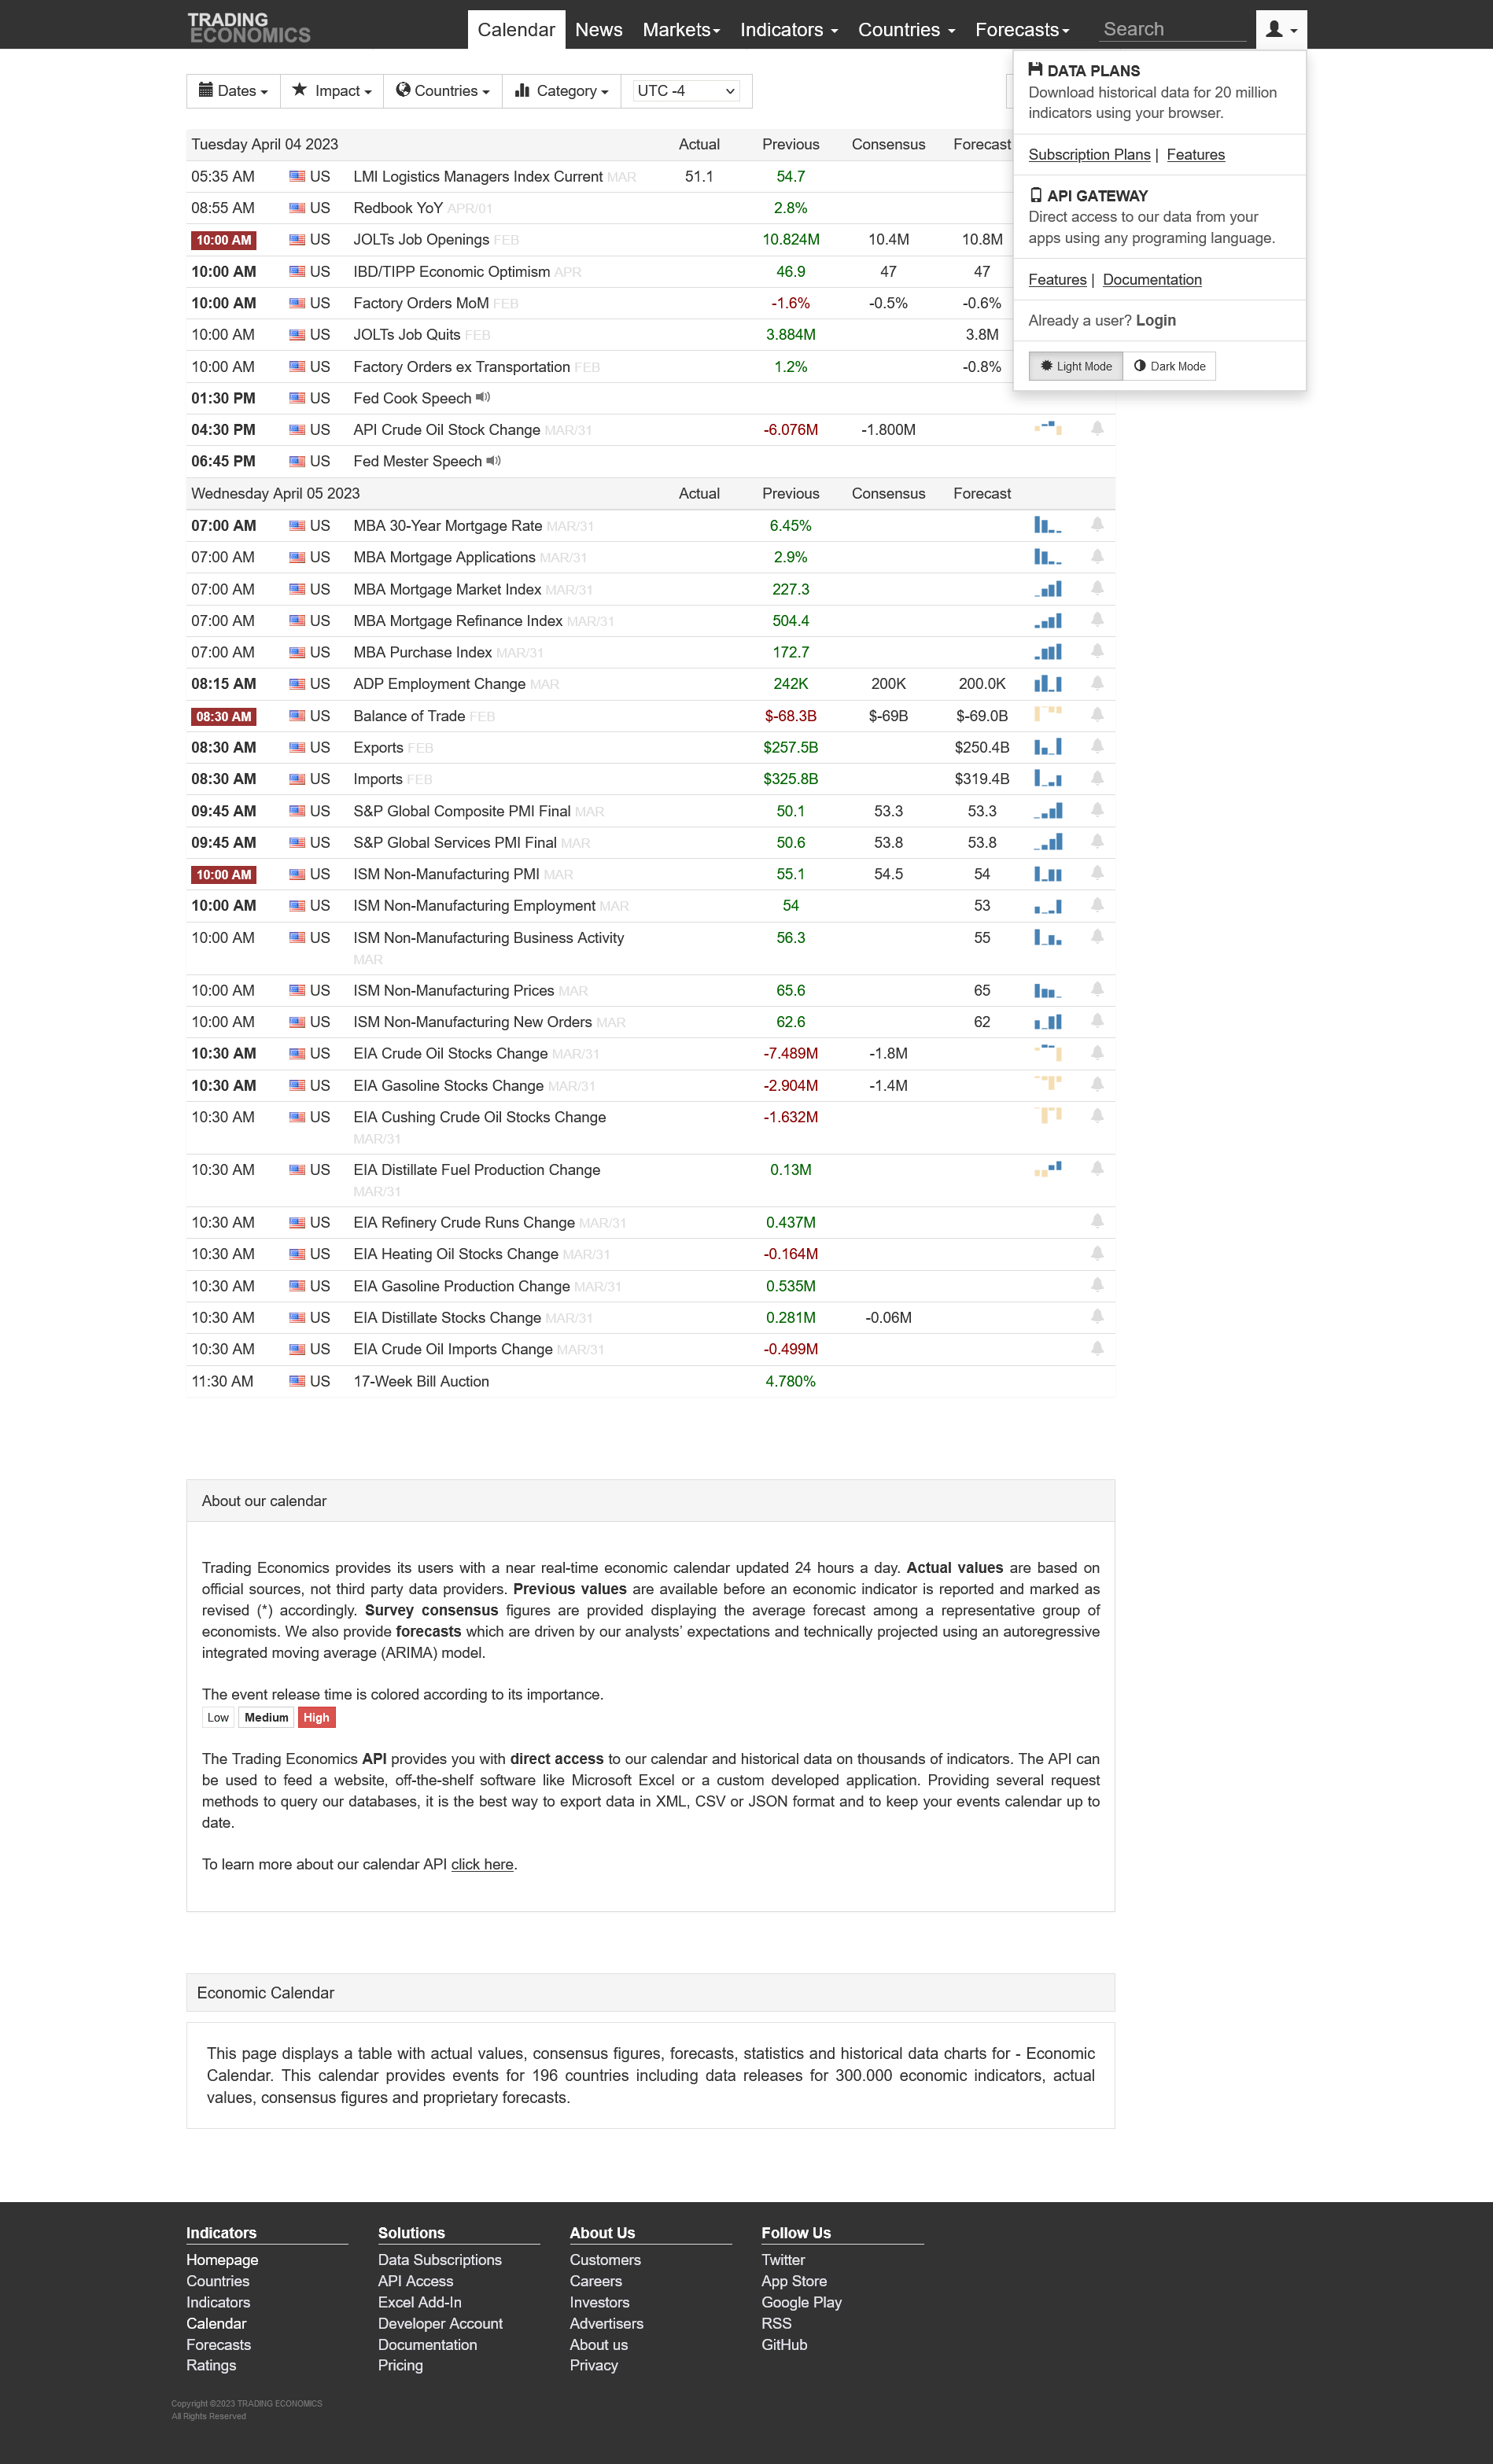
Price, Price Spread, Lagged Price/Volume Spread, and Binary Price/Volume Indicator
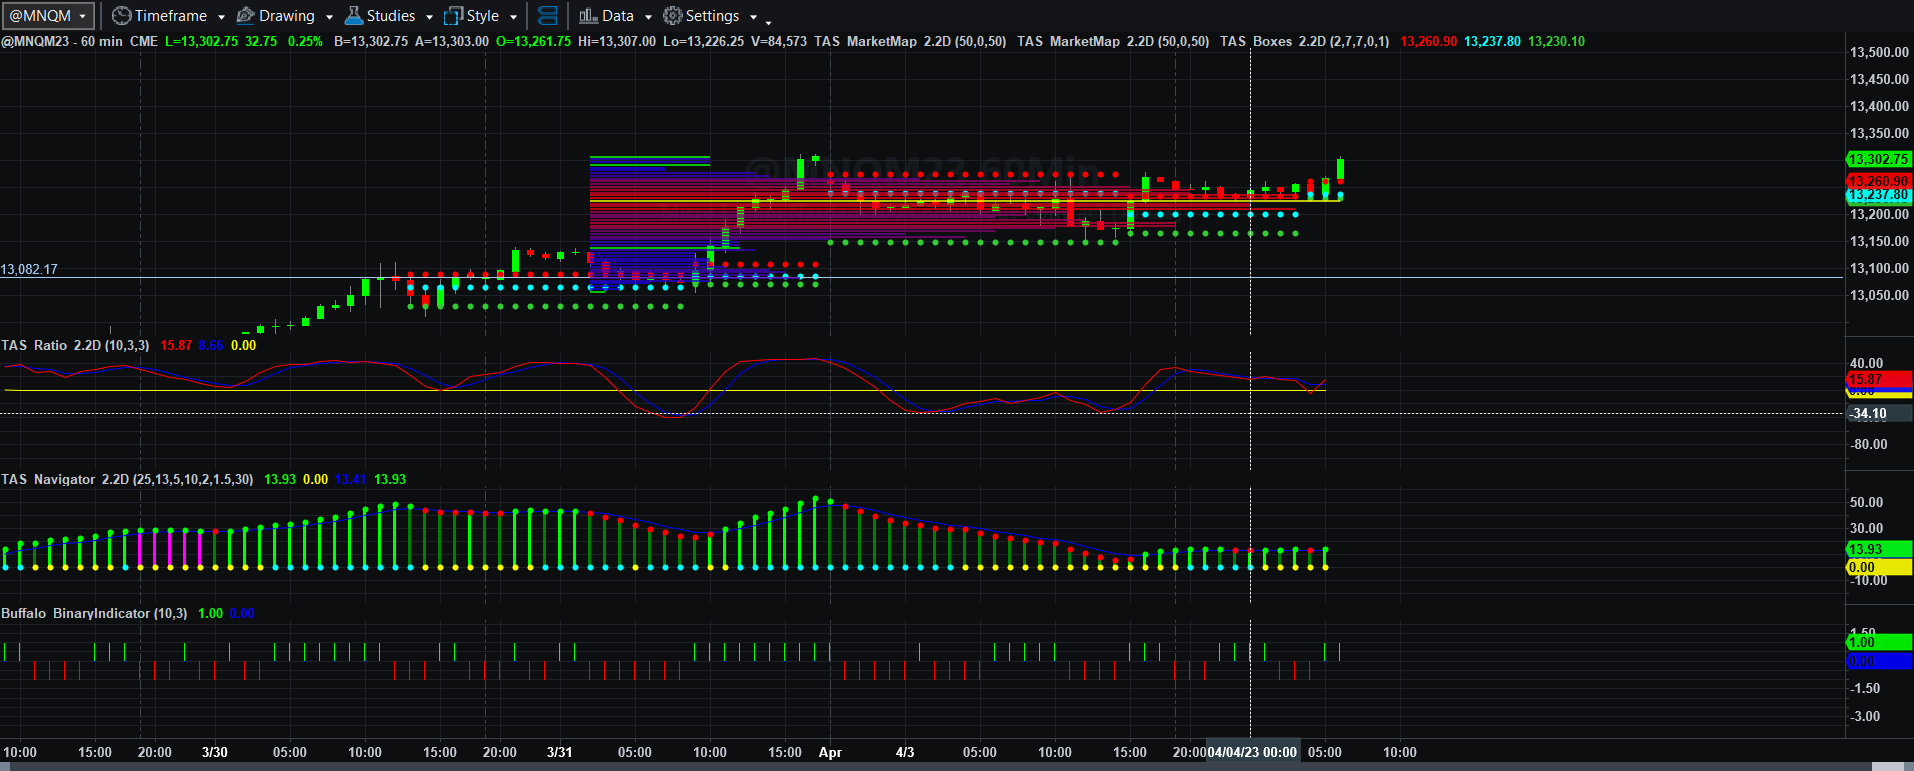
Price and Total Volume With 50-period Moving Volume Average
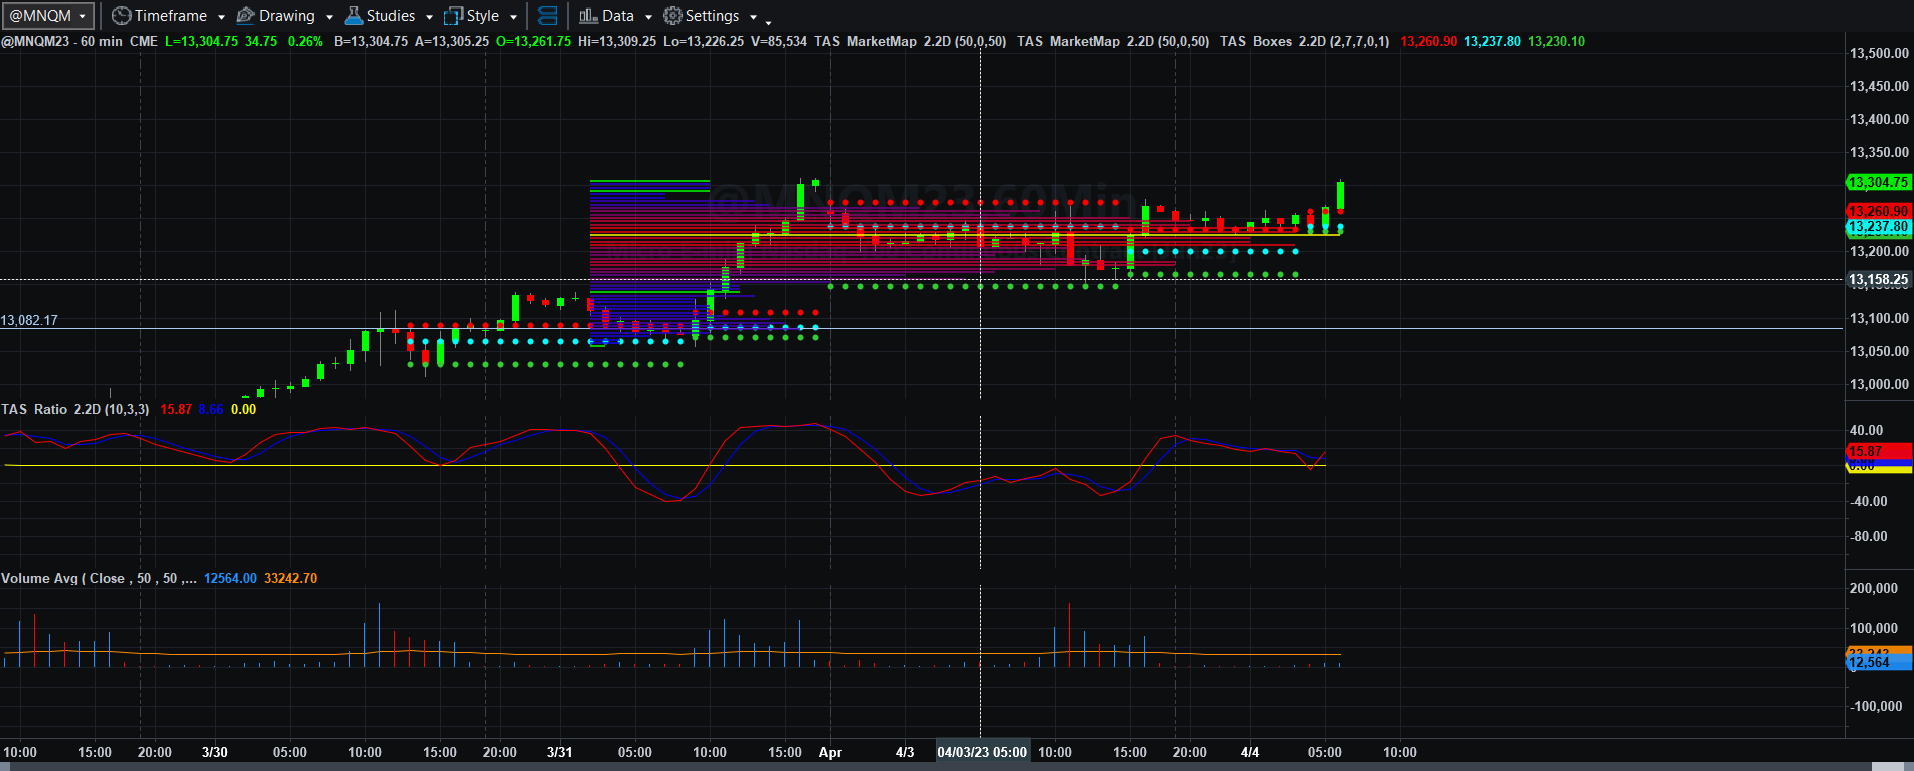
Fibonacci Price Scale With Targets
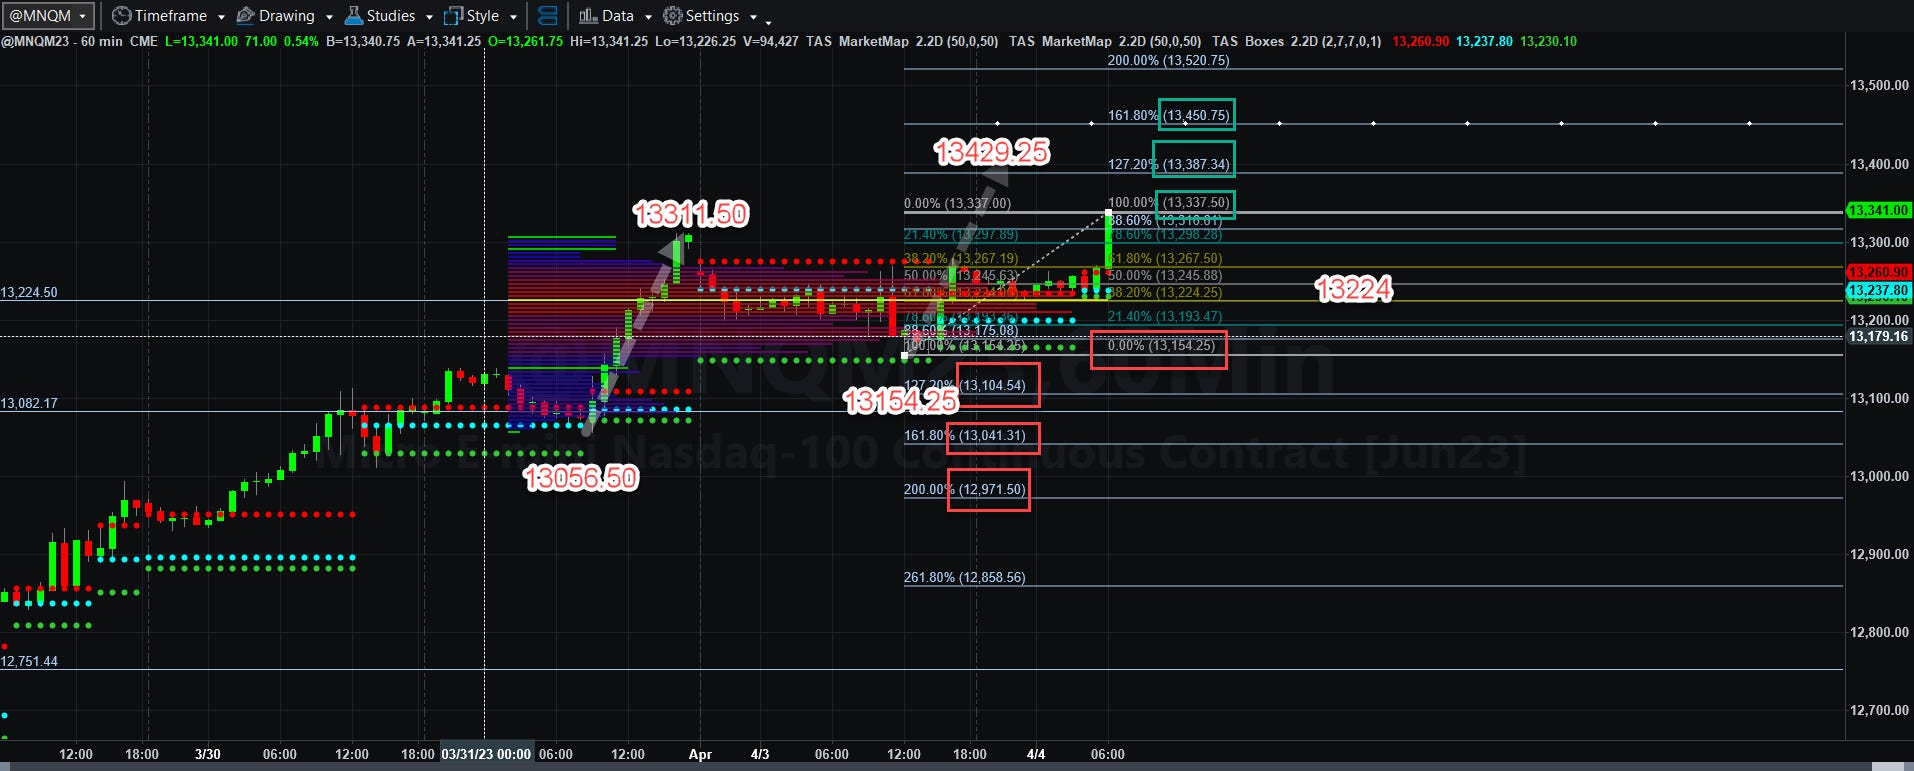
The calendar issue is fixed for now so the DATE IS RIGHT TODAY! Sorry for the error yesterday.
Today’s chart seems fluid, as after a rather mild selloff back to the 13224 area in Asia and sideways trade to break out strongly at the 0500 EDT hour as it seems traders are less worried about interest rates and the cheap money casino fever makes a comeback of sorts. We will see with the JOLTS picture and comments from the Fed governors today if that is the case but in early trade (not totally seen on this chart, we have broken through to 13348.75.
If we can remain above the VWAP at 13324.50, we have a shot at running to and beyond that 13348.75 to perhaps 13387.35 to 13450.75.
If not it’s a fairly short trip back to that 13324.50 VWAP line back to 13154.25, 13104.50, and 13041.25
We will simply have to wait to see if energy prices hamper business activity, but it does appear for the briefest of times as it did at the end of 2022. Seems that buyers want another shot at the 14 handles or higher, whether it is justified or not. As long as the cheap-time-value worthless US Dollars are allowed to flow, the bulls will run. There is potential room up to 14393, but I don’t that that is on the radar screen today.
Don’t ask me how long that lasts. That is why I always measure downside targets when the gas runs out of bullish traders. We will simply have to see.
Picked up 32 NQ points long yesterday and went on to other businesses. I will simply have to see what happens as the market opens.
More is coming soon.
Today’s Economic Data Courtesy of Trading Economics dot com. Be sure to refresh the date at the top left.