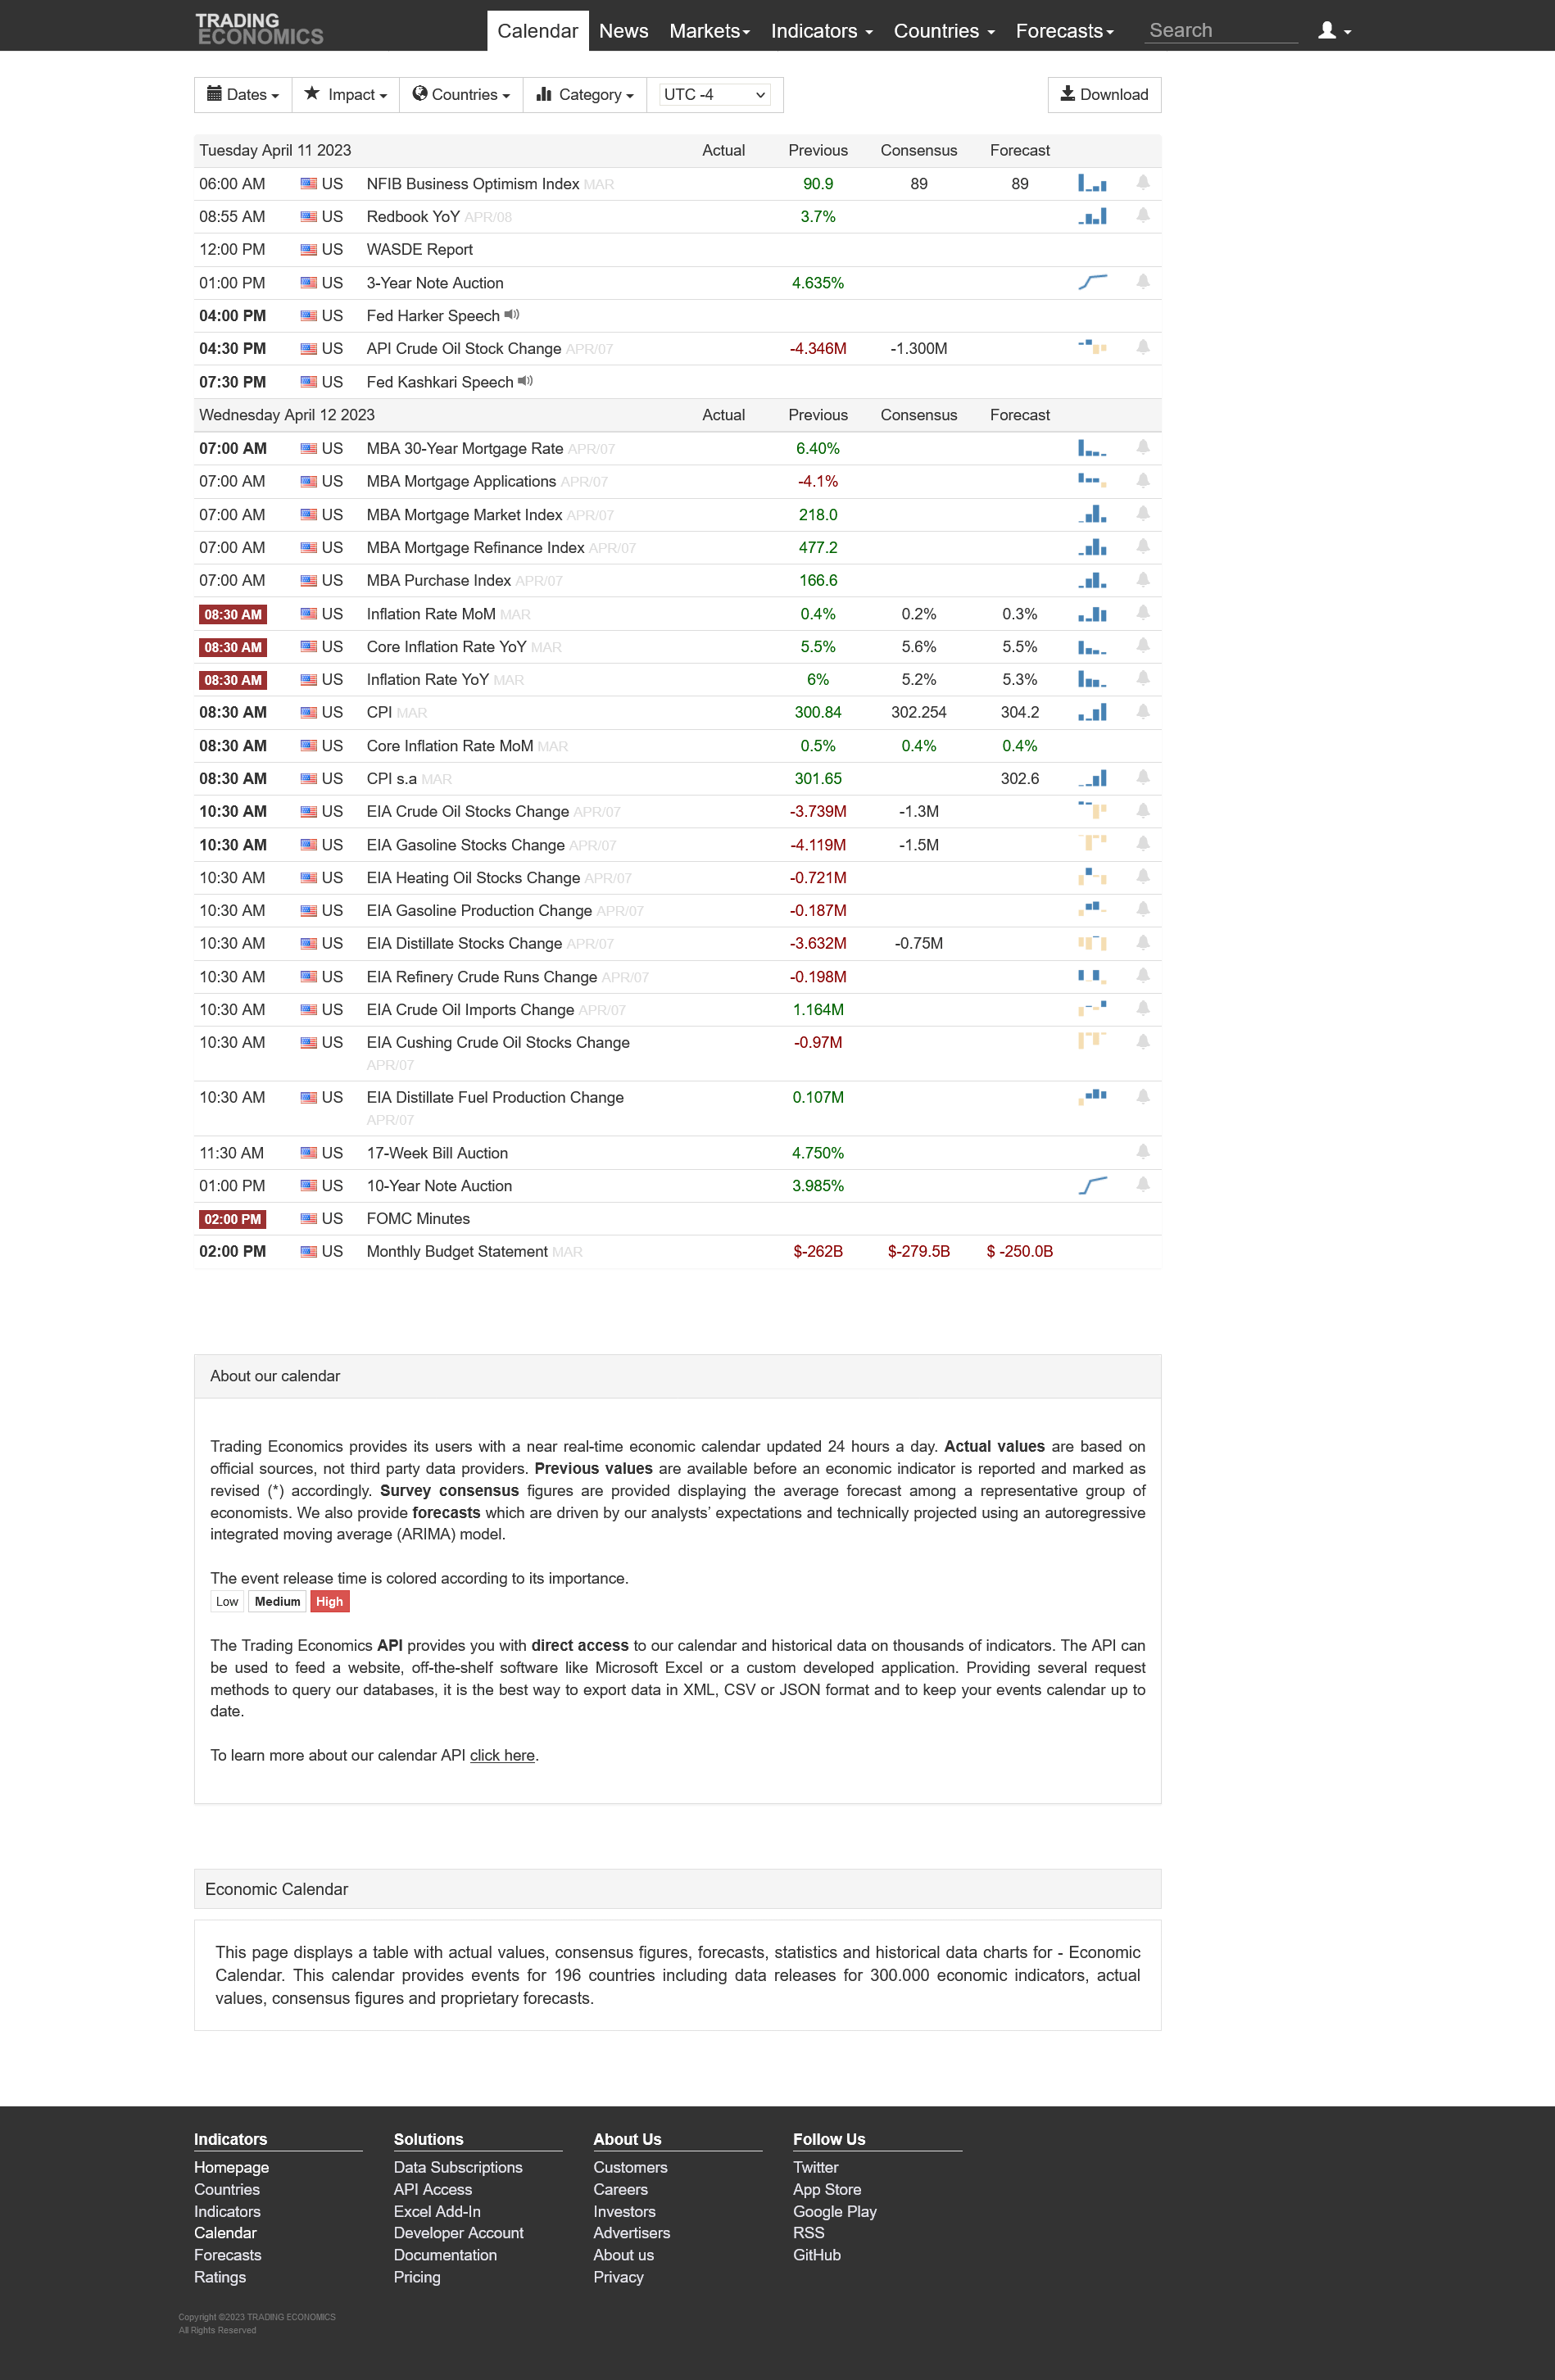
Price, Price Spread, Lagged Price/Volume Spread, and Binary Price/Volume Indicator
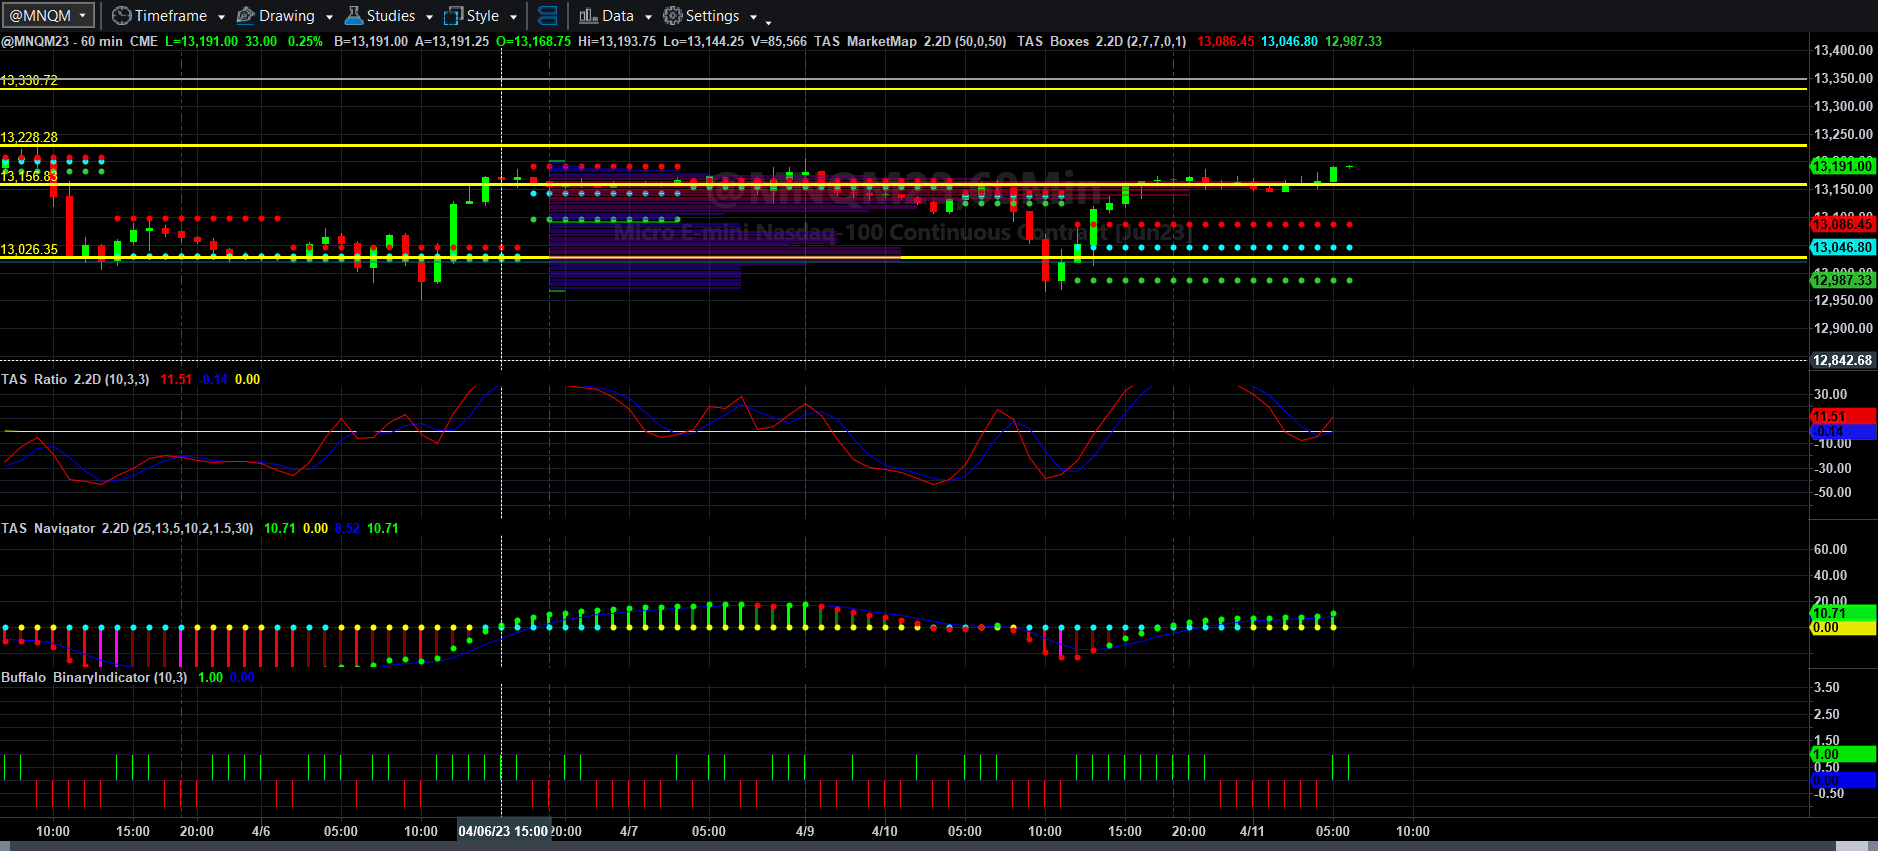
Price and Total Volume With 50-period Moving Volume Average
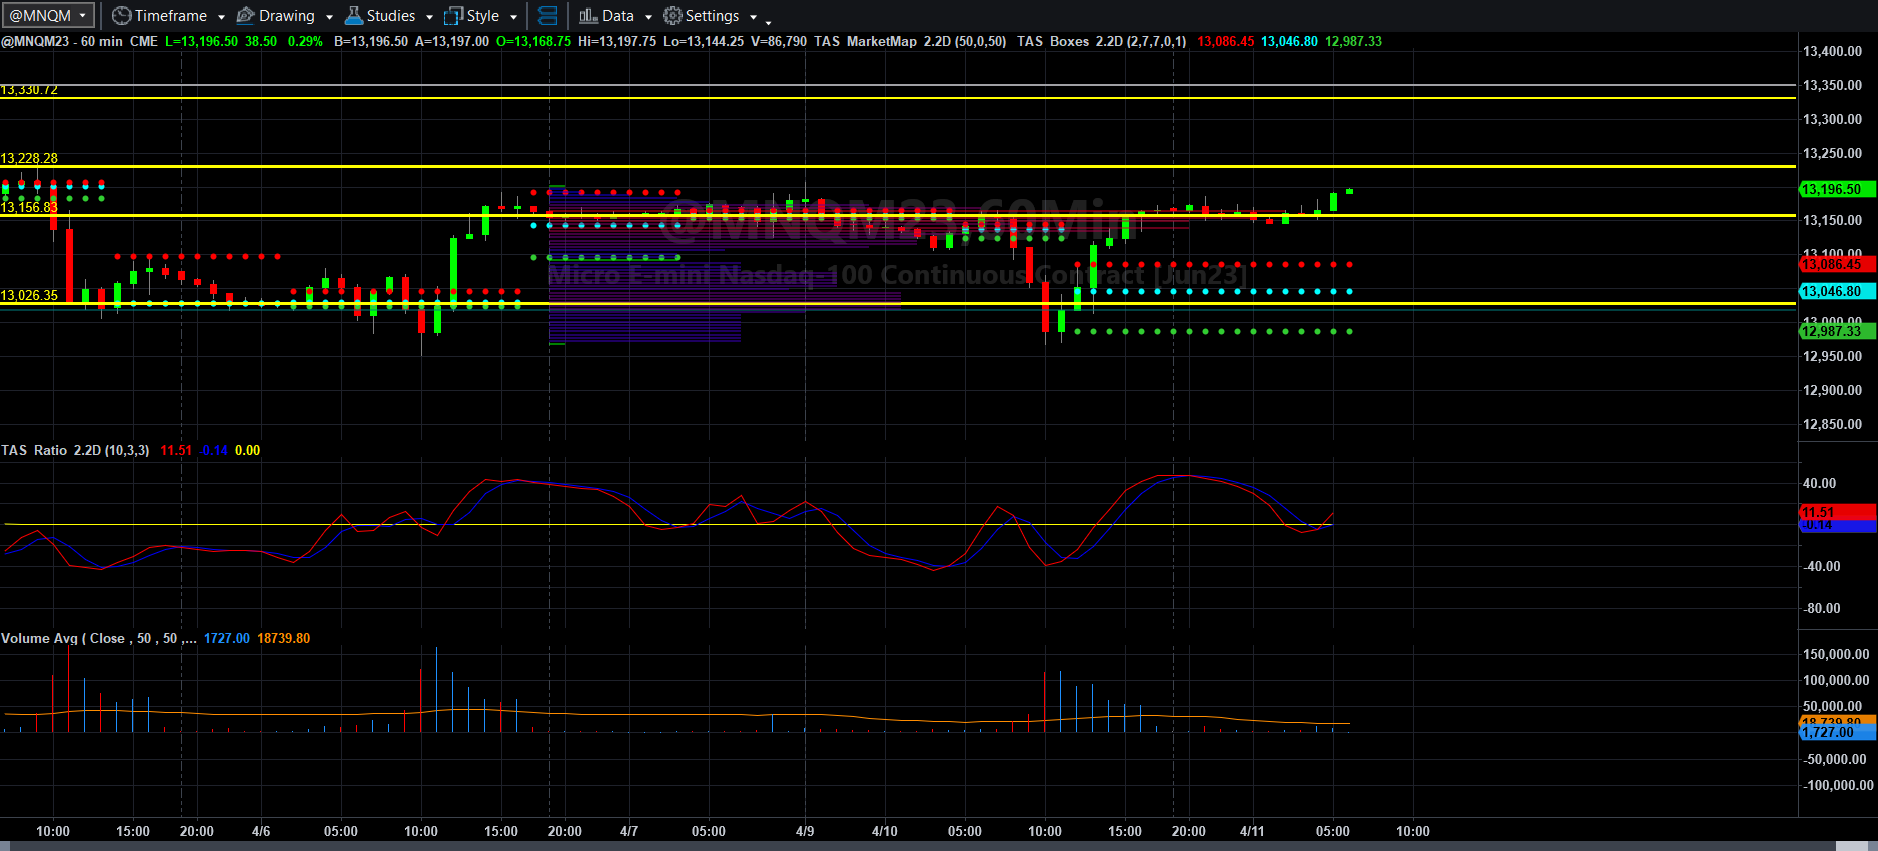
Fibonacci Price Scale With Targets
Once again, we had a selloff based, perhaps, on the perception that inflation was running a bit hotter than economists (who are never wrong, right?) expected, but once again, Asians purchased MNQM23 overnight and it appears that the Europeans are stabilizing it near yesterday’s highs. We are seeing a replay of opposing reactions to economic news, given the confused and inconsistent nature of policy actions being played out on the charts. That is why I remain agnostic of any trend and simply follow what volume, price and volume momentum, Fibonacci patterns and extensions, and the general market volume profile indicate is the path of least resistance for the price to move.
If MNQM23 can remain above 13156.75, it has a shot to take out 13206.25. rally past the 13228.25 VWAP line toward 13271.25 and eventually above 13330.75 to 13353.75 in the next couple of days. If not, then MNQM23 likely tests support at 13087, 13026.25, and perhaps 13013, back to the low of 12967.50. If that is broken, then this contract could see 12902.50 and even 12820 over the next couple of days.
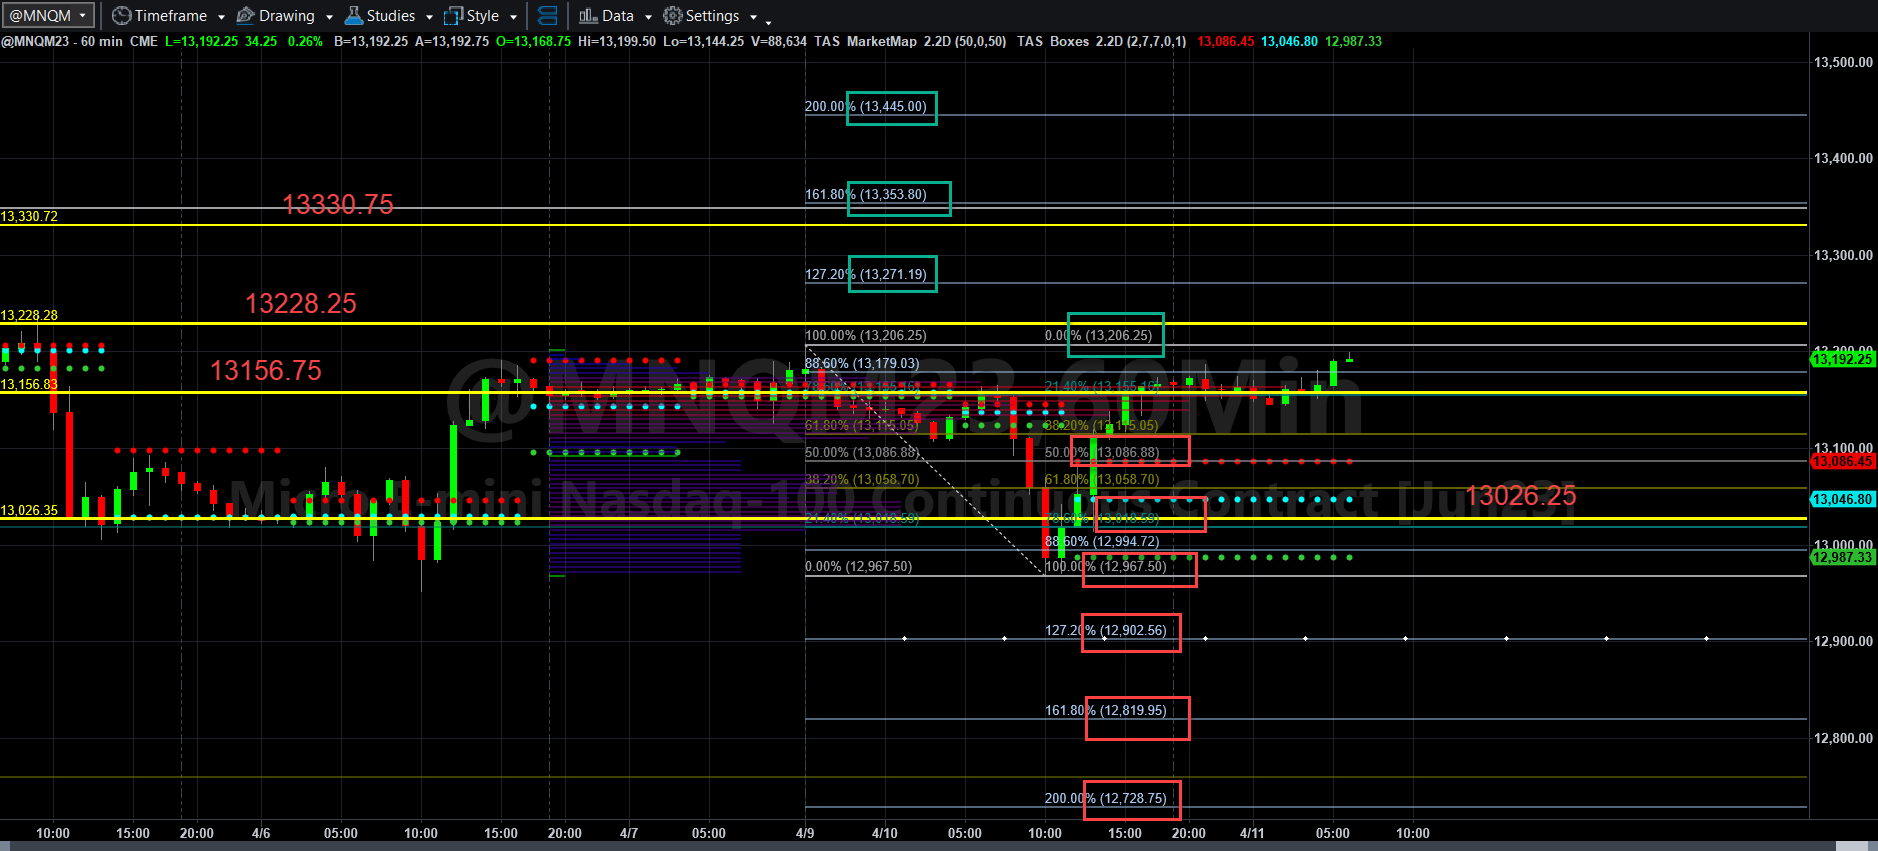
The heavy inflation data begins to hit tomorrow, and we will see which way traders take the price. To assume to know the answer is probably foolish. That is why I trade what I see. I covered 27 NQ points per contract short yesterday and went back to other business. I am trying to hit reasonable targets to profit and scale with as always, and limiting risk in every way I can, including stop loss protection.
More will come soon. Have a productive, profitable, and pleasant Tuesday.
Today’s Economic Data Courtesy of Trading Economics dot com. Be sure to refresh the date at the top left.