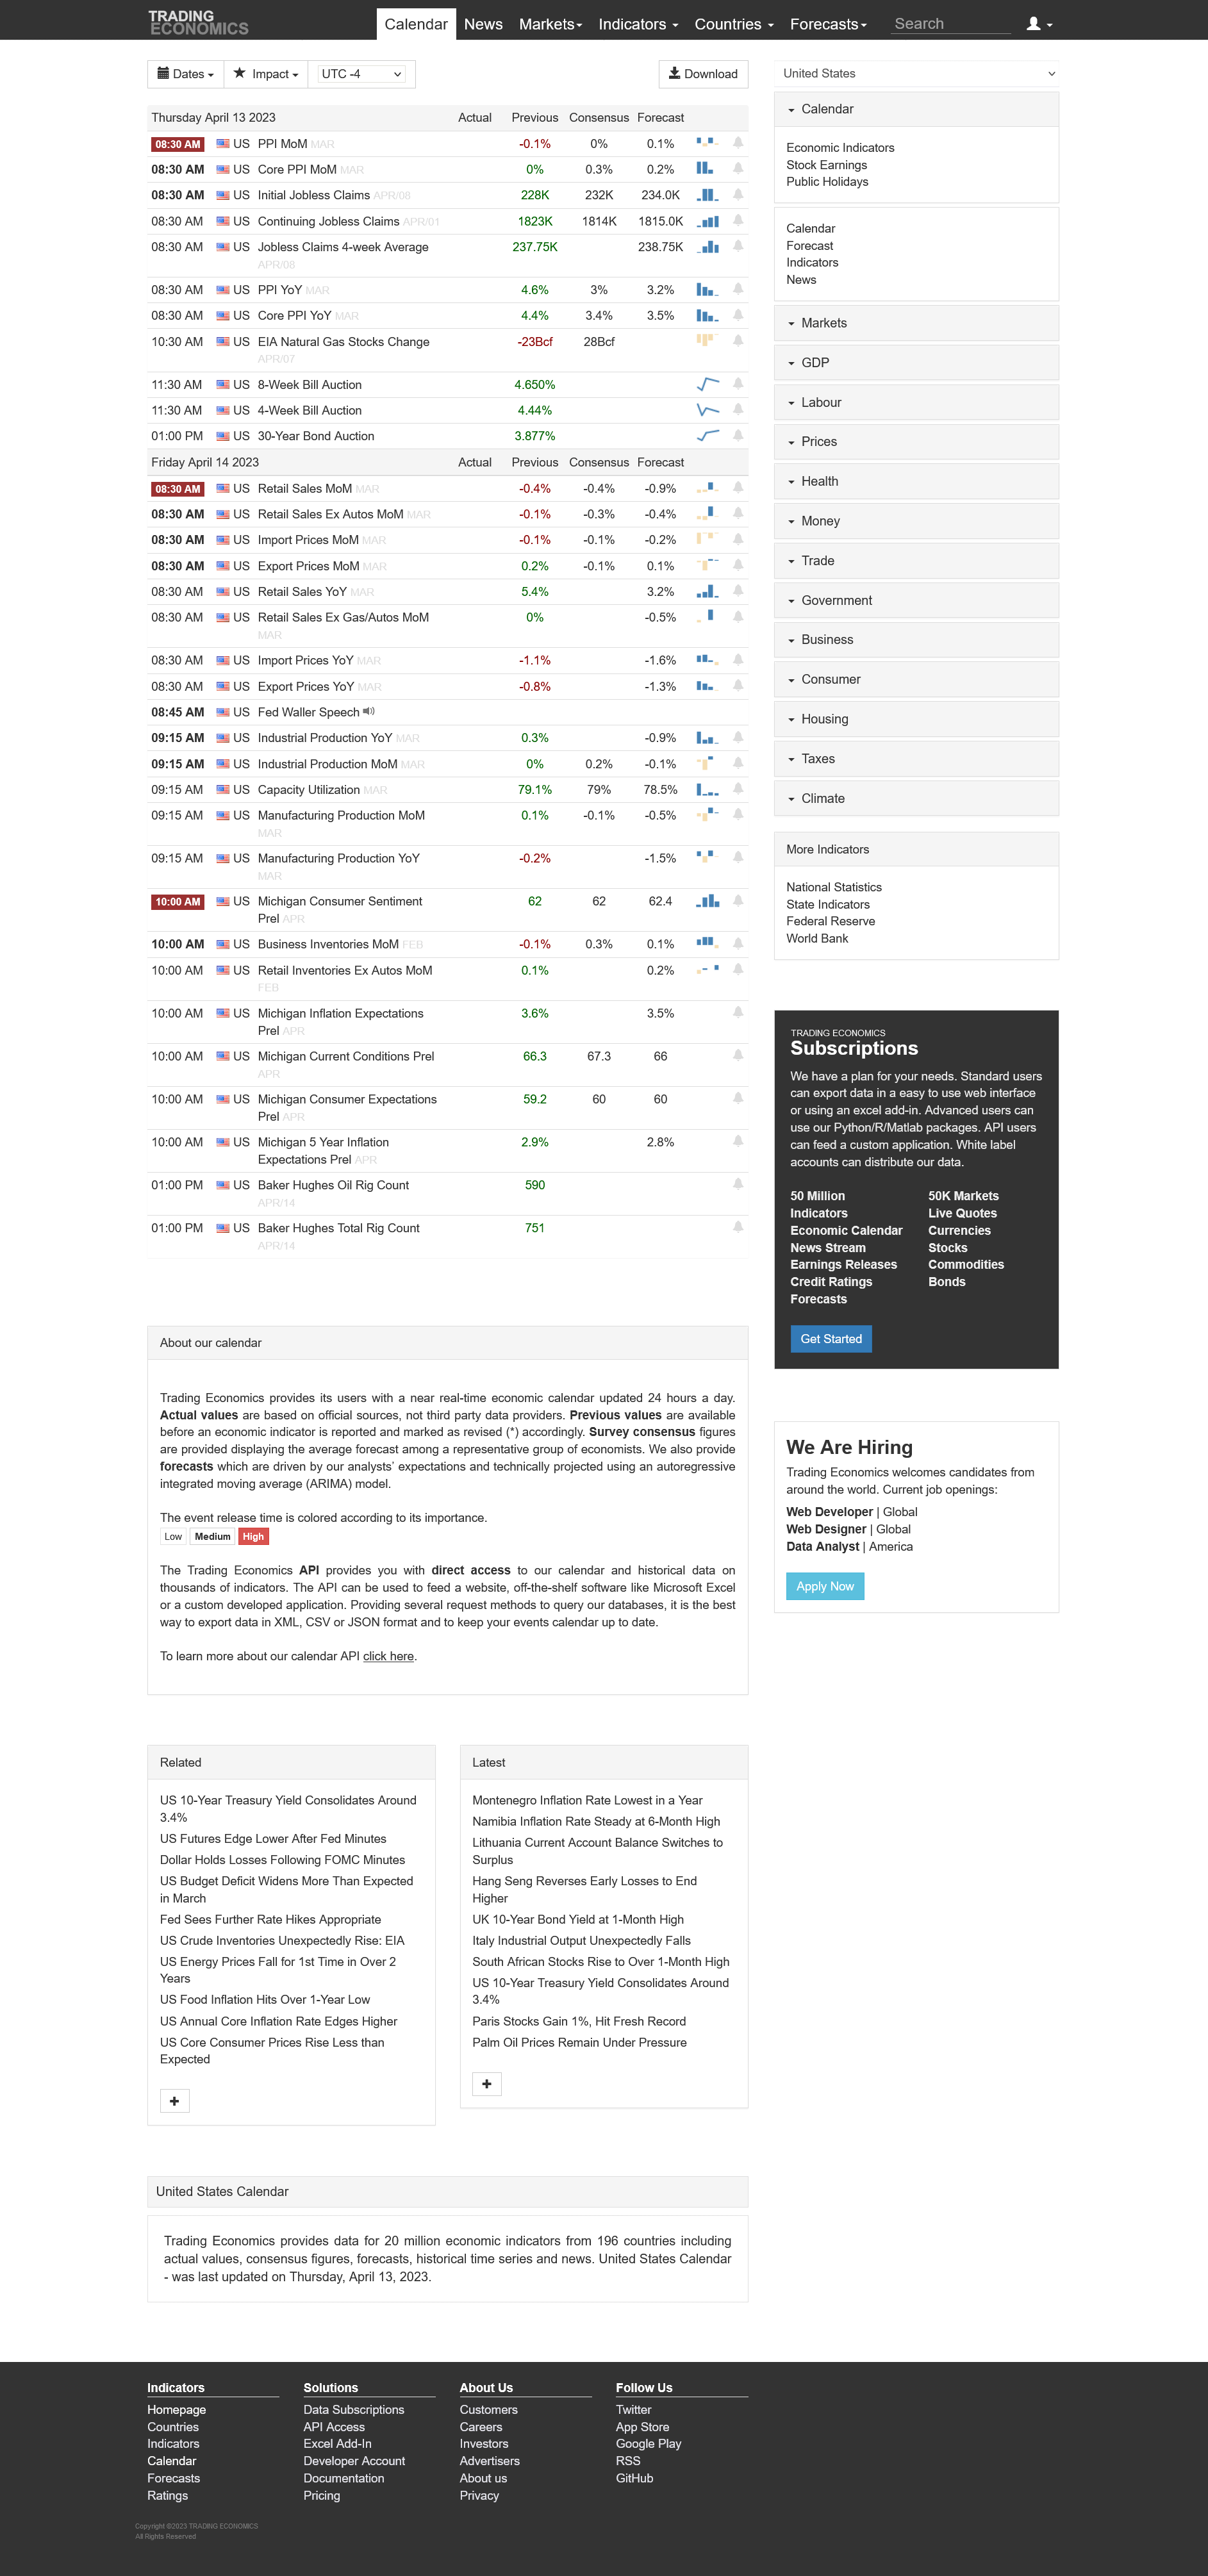
Price, Price Spread, Lagged Price/Volume Spread, and Binary Price/Volume Indicator
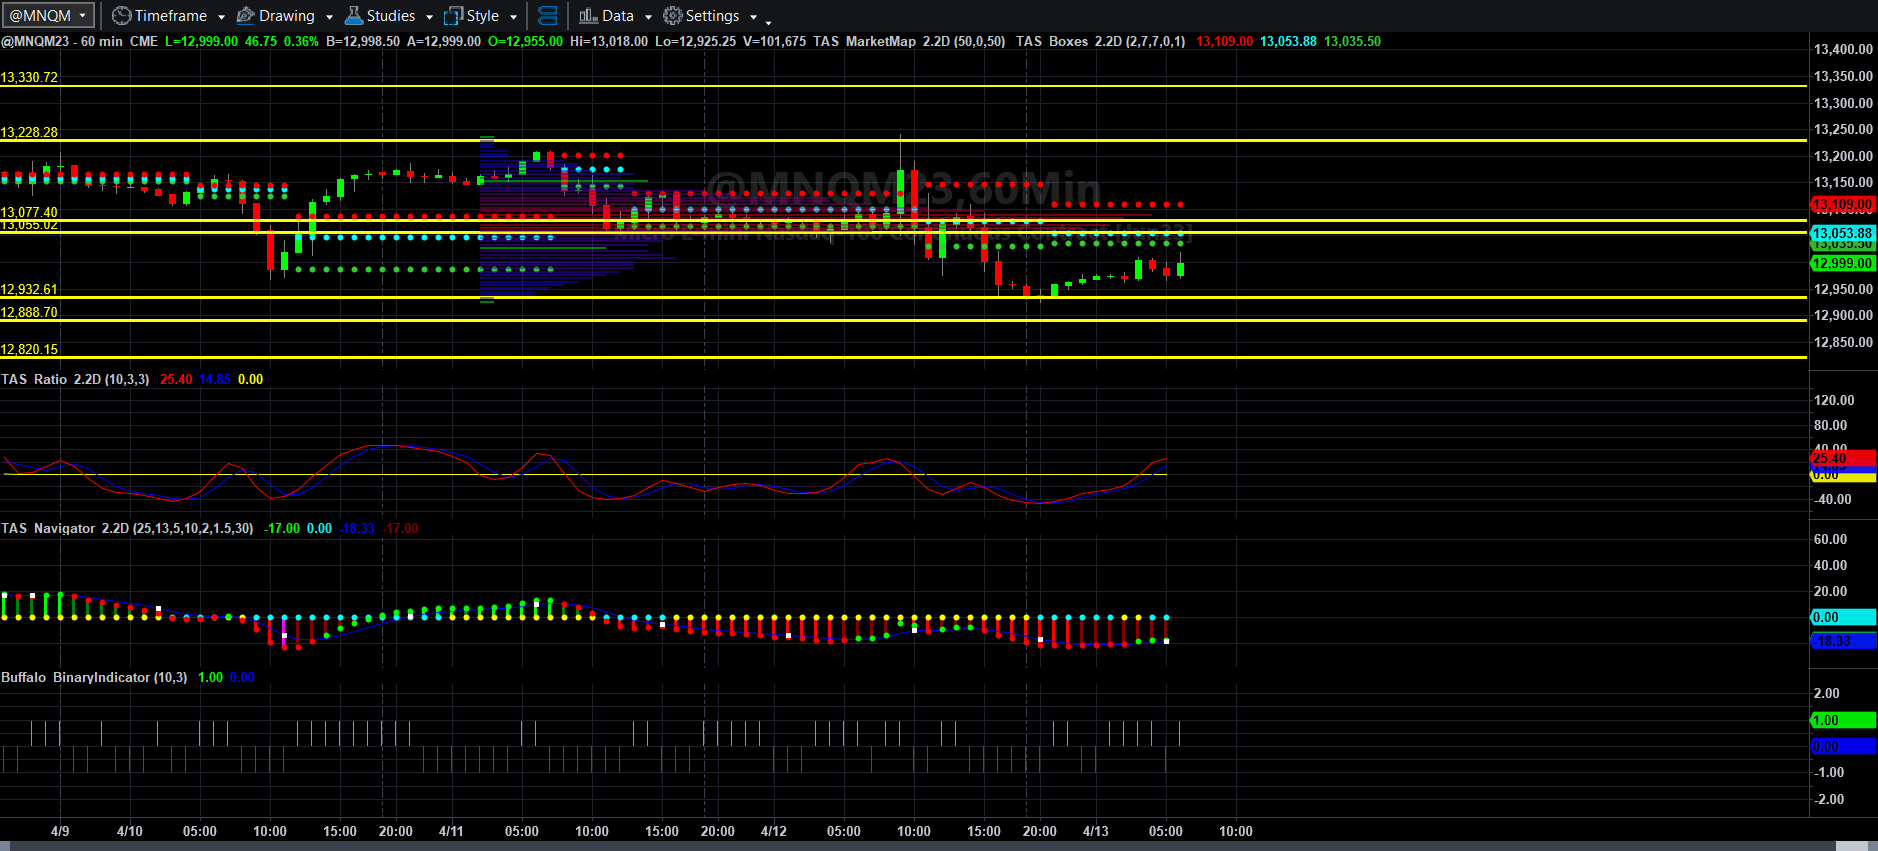
Price and Total Volume With 50-period Moving Volume Average
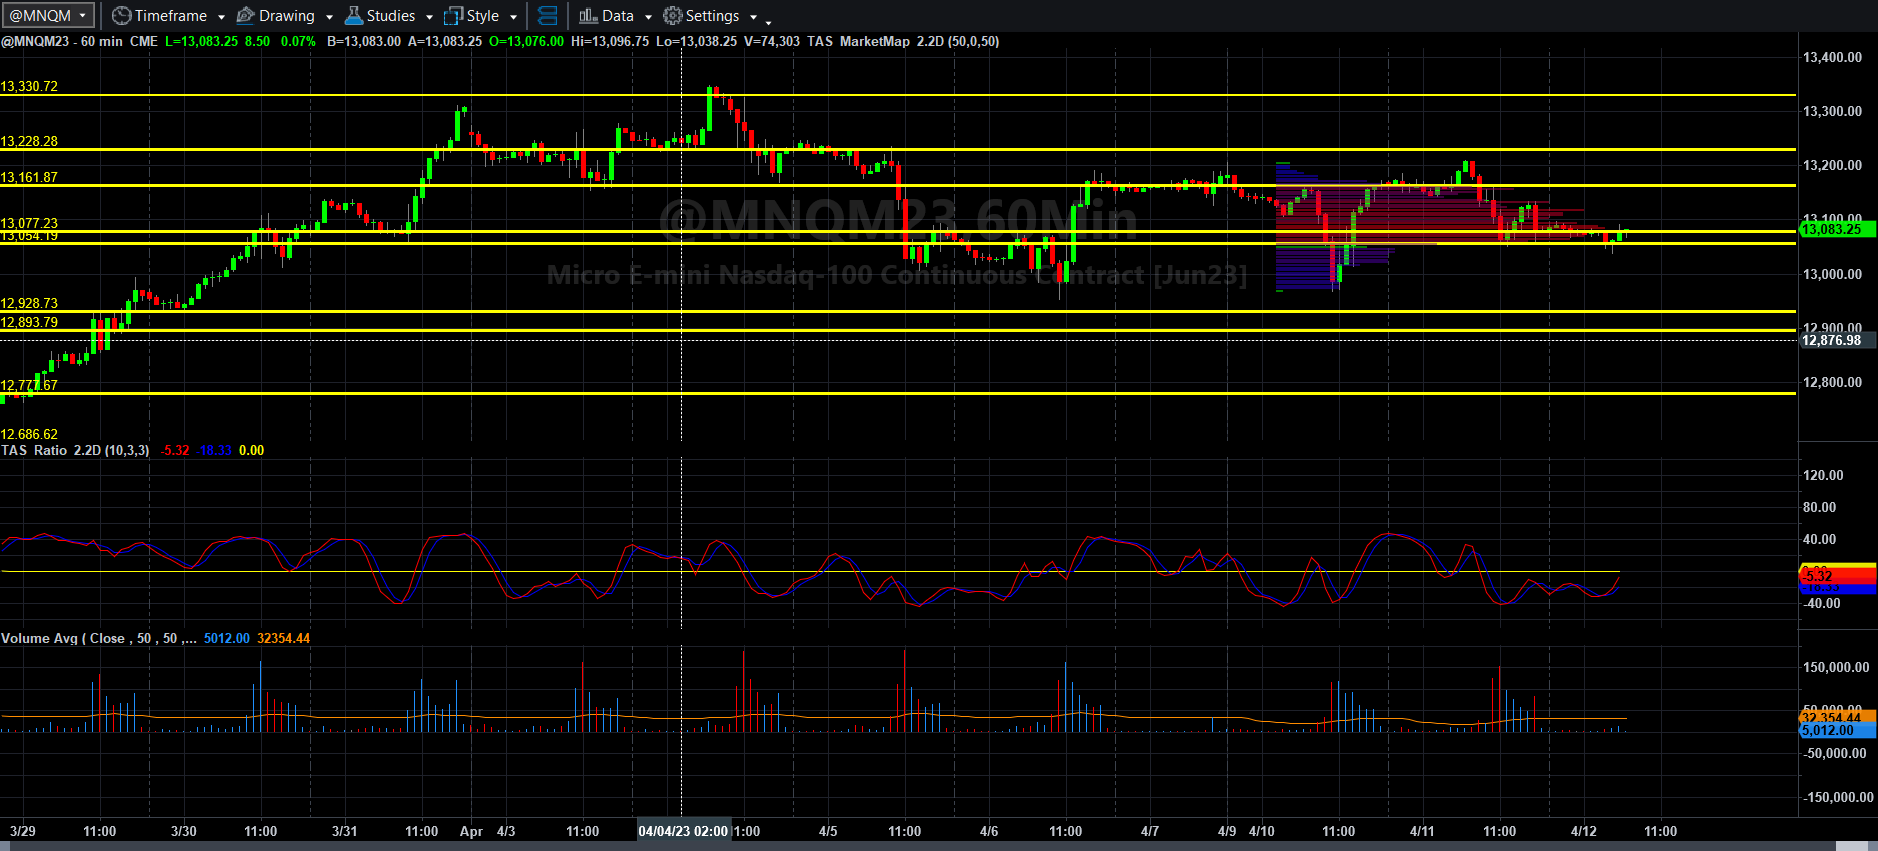
Fibonacci Price Scale With Targets
Yesterday’s core PPI data was indeed negative (or perceived negatively) by traders, and the selloff began in earnest. Overnight, Asians attempted to continue selling but as 0000 EDT Thursday rolled around, some buying began, though a bit tepidly, in Europe. Still, however, the hourly retracement has just gotten back to the 38.2% retracement of that previous bear swing, which could be a bearish sign for later this morning. With this market’s inherent thirst for the latest tidbits of supposedly “predictive” notions of future Fed policy (like PPI could be), ANYTHING CAN HAPPEN, and probably will, given the casino-mentality of this market over the last 5 years.
If MNQM23 can remain above 128932.50, then it has a shot to rally, relatively quickly, back to 13109 and really back toward 13159 and 13222.50, and perhaps beyond in the next couple of days. If not, It’s a quick trip back toward 12925.25, 12879.25, and potentially 12811.50. A potential price-symmetrical (not time-symmetrical) AB=CD pattern could complete around 12843.75 if the bears have their way, but no one knows for certain if that hits.
Yesterday I set a spread trap taking both a short profit and an even larger long profit for 118 NQ points, which helped erase the sting of the previous day’s double boot and moved the equity rock forward once again. I will be very cautious as always and look only for the best setups that match the direction of volume combined with price momentum and Fibonacci extension targets. If it is not there in the first couple of hours, I will move on with my day and come back Friday.
That is all for me today. Have a wonderful Thursday, and go out and execute your trade plan for a profit as well. More comes soon.
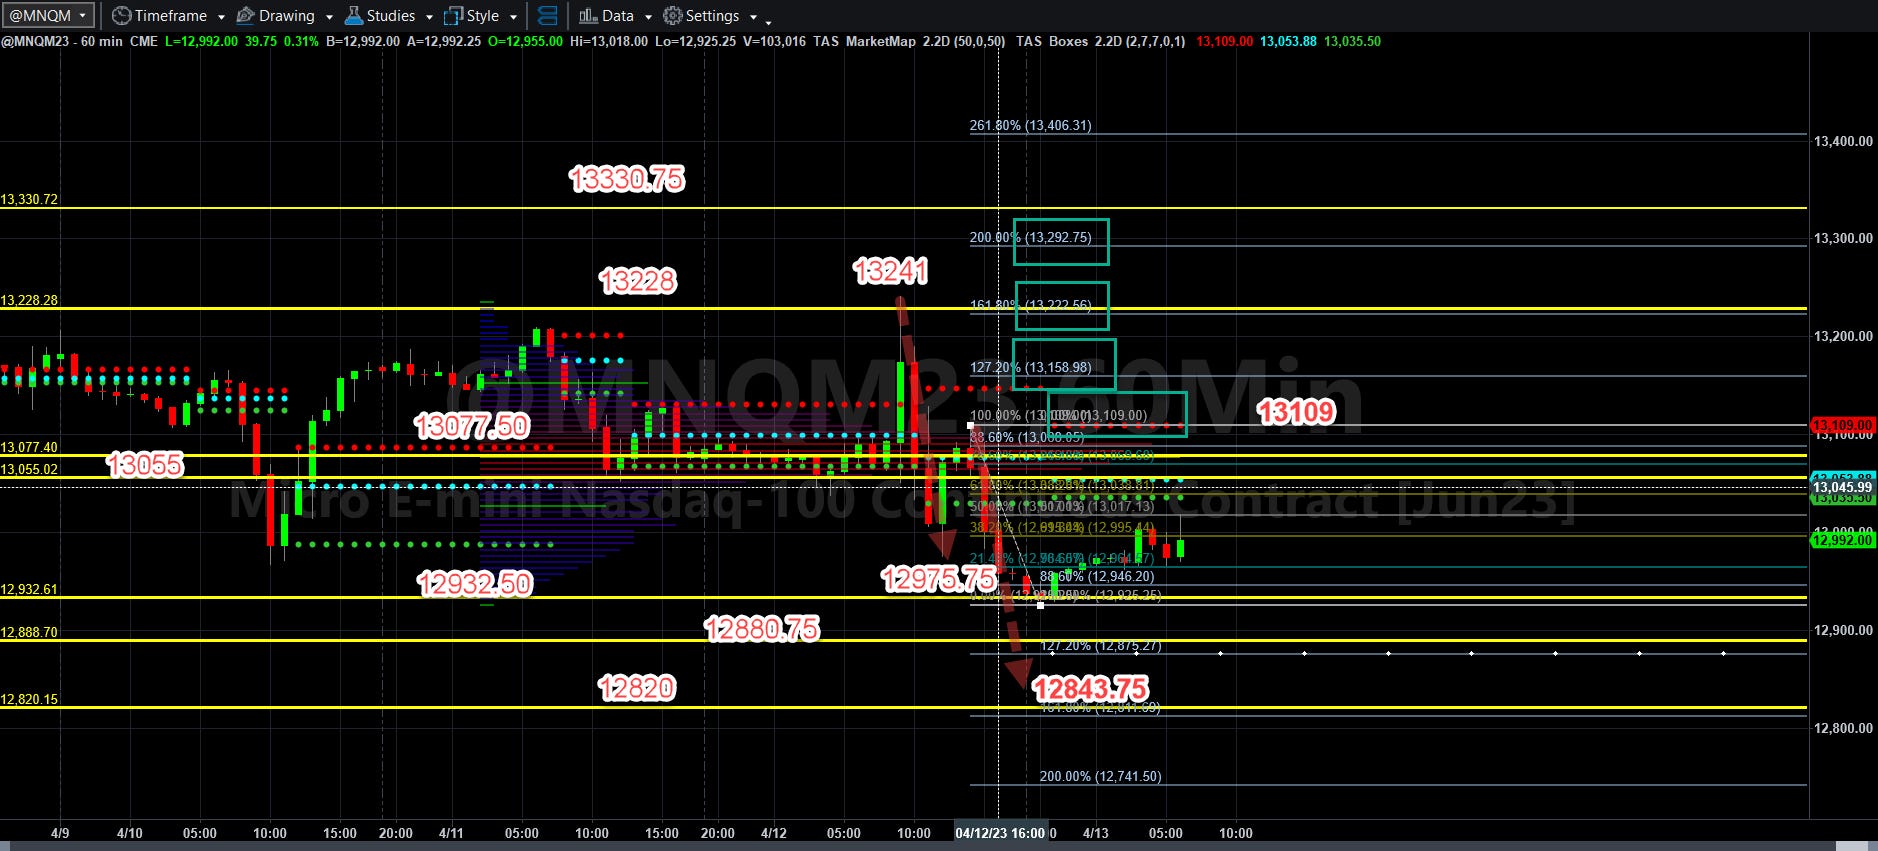
Today’s Economic Data Courtesy of Trading Economics dot com. Be sure to refresh the date at the top left.