

Price, Price Spread, Lagged Price/Volume Spread, and Binary Price/Volume Indicator
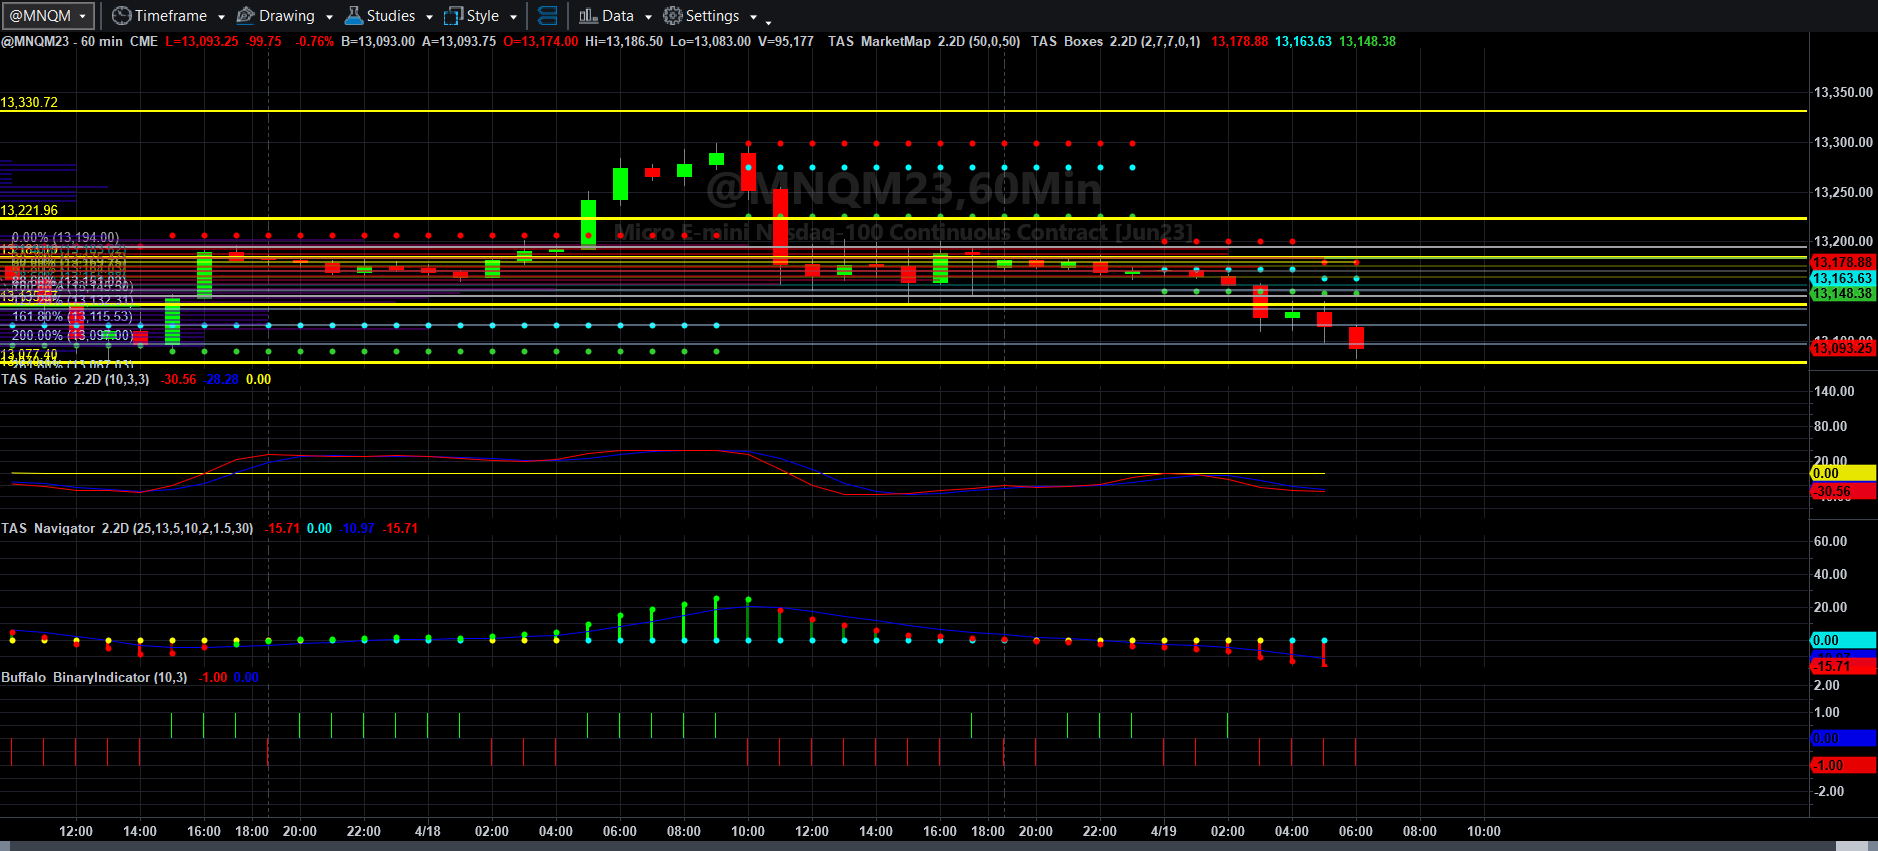
Price and Total Volume With 50-period Moving Volume Average
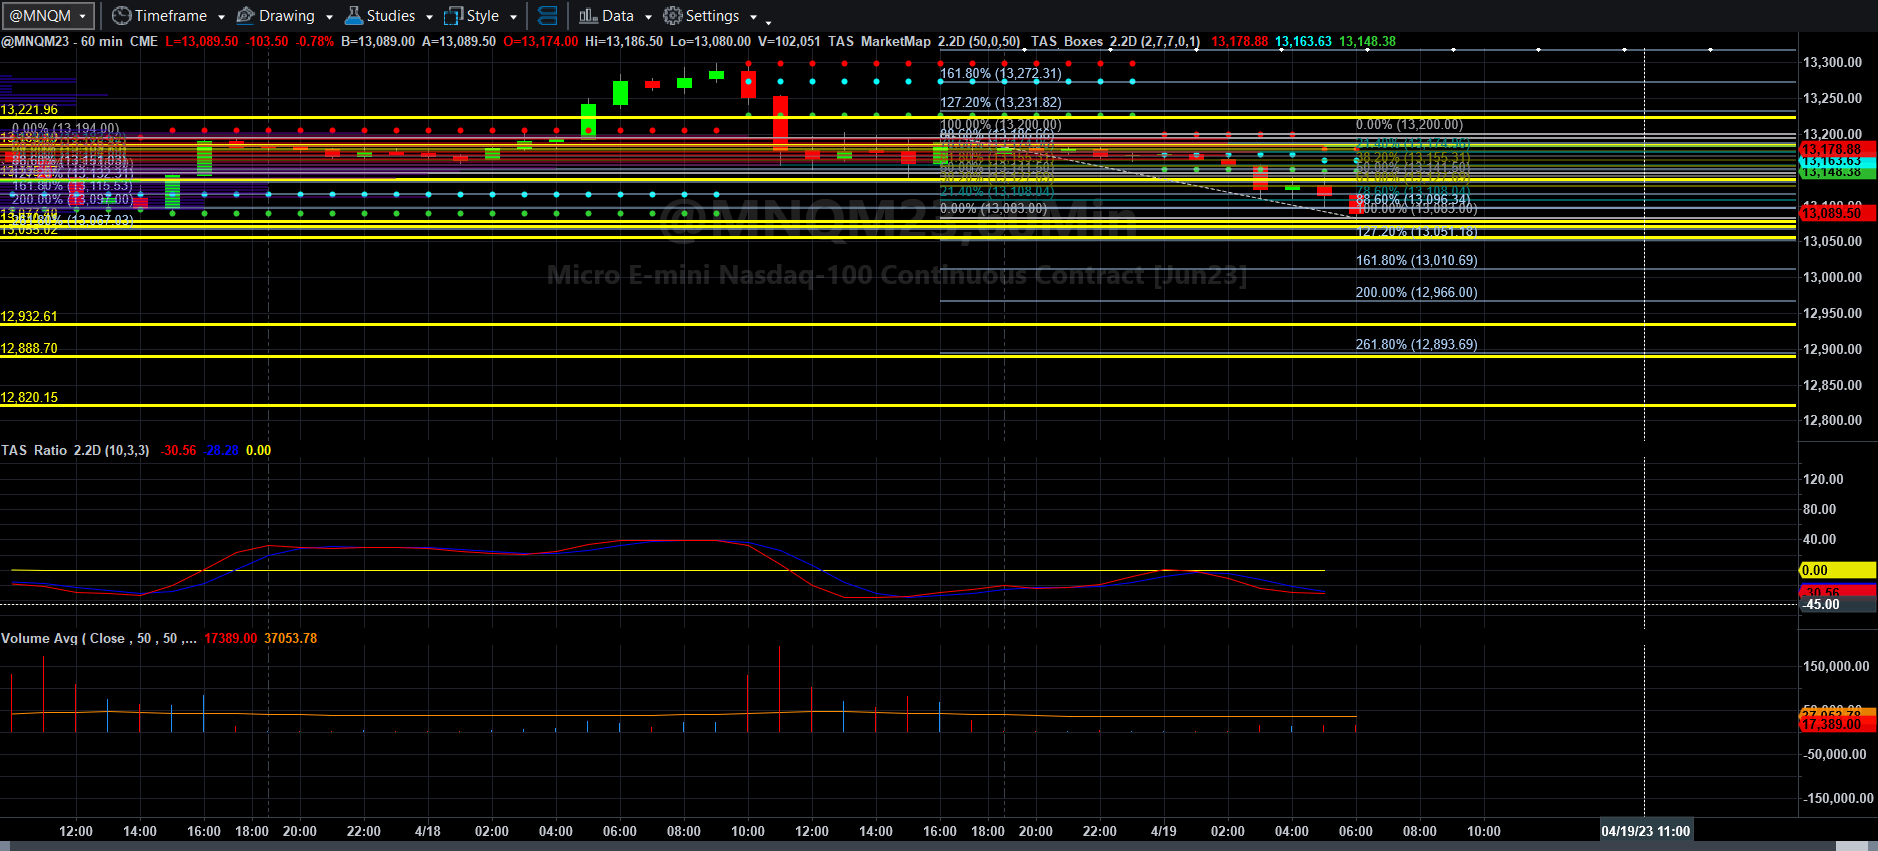
Fibonacci Price Scale With Targets
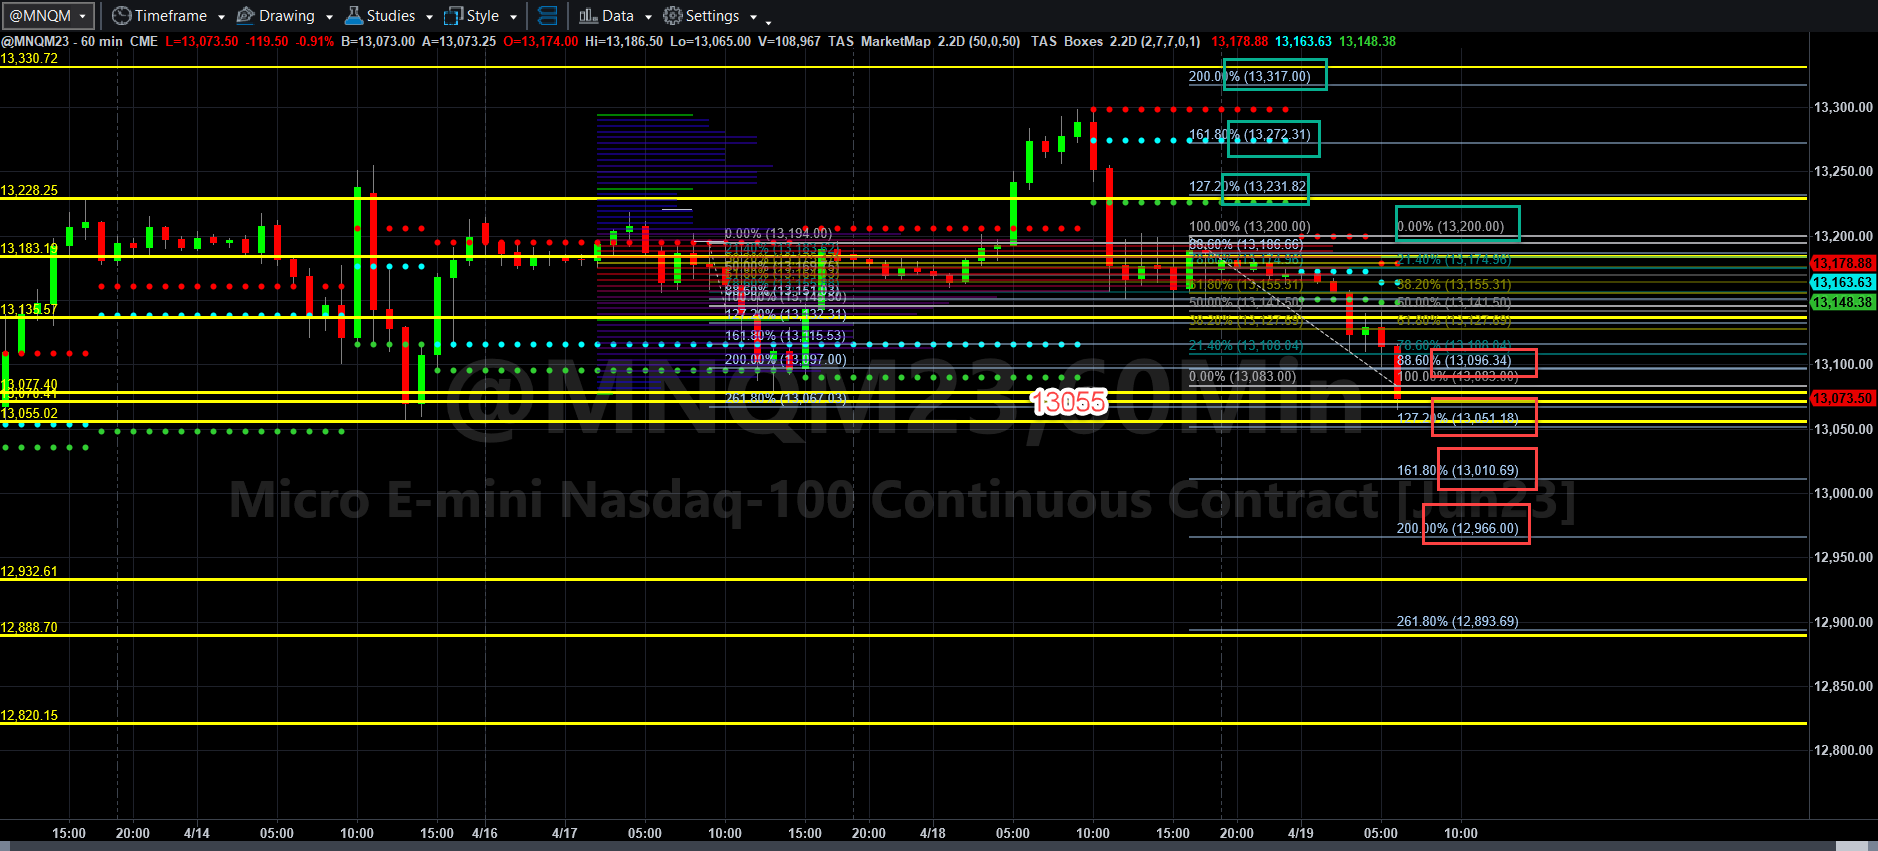
Got off to a bit of a late start, and if you can see the Fibonacci levels and targets above, we have already broken through the previous 0500 EDT swing low at 13083 headed to a retest at least of 13055, and if that fails, we will likely see MNQM23 fall to 13051, 13010.75 and 12966 over the next couple of days. If we can regain 131350 (the center VWAP line basically, we probably have a chance to regain 13183 and 13200. If buyers get busy, it could also tag those Fibonacci levels at 12232 and 12317 and once again attempt to take out the 13330 area which seems hard to displace currently.
With minor nuisances like new major layoffs at tech companies like Meta and threats of nuclear war, if US forces take Ukrainian uranium, there could be further pressure on these markets, but outside of that, I still believe the levels we keep climbing up to and falling back from are posturing for the next Fed funds rate announcement in May.
I have no idea what it will do, and no one else really does either.
I will continue to press for volume-backed breakouts in either direction that have price moments and sufficient gaps in the market profile to profit from. I got rebuffed on two shorting attempts yesterday but did NOT fully take the boot, thus protecting equity. These volume spikes may be difficult to work against, but with better trade management, they will also not degrade my equity position. That accomplishes job 1 of a trader and allows faster scaling of equity.
More will be coming soon. Have a peaceful, productive, and profitable Wednesday!
Today’s Economic Data Courtesy of Trading Economics dot com. Be sure to refresh the date at the top left.
