

Price, Price Spread, Lagged Price/Volume Spread, and Binary Price/Volume Indicator
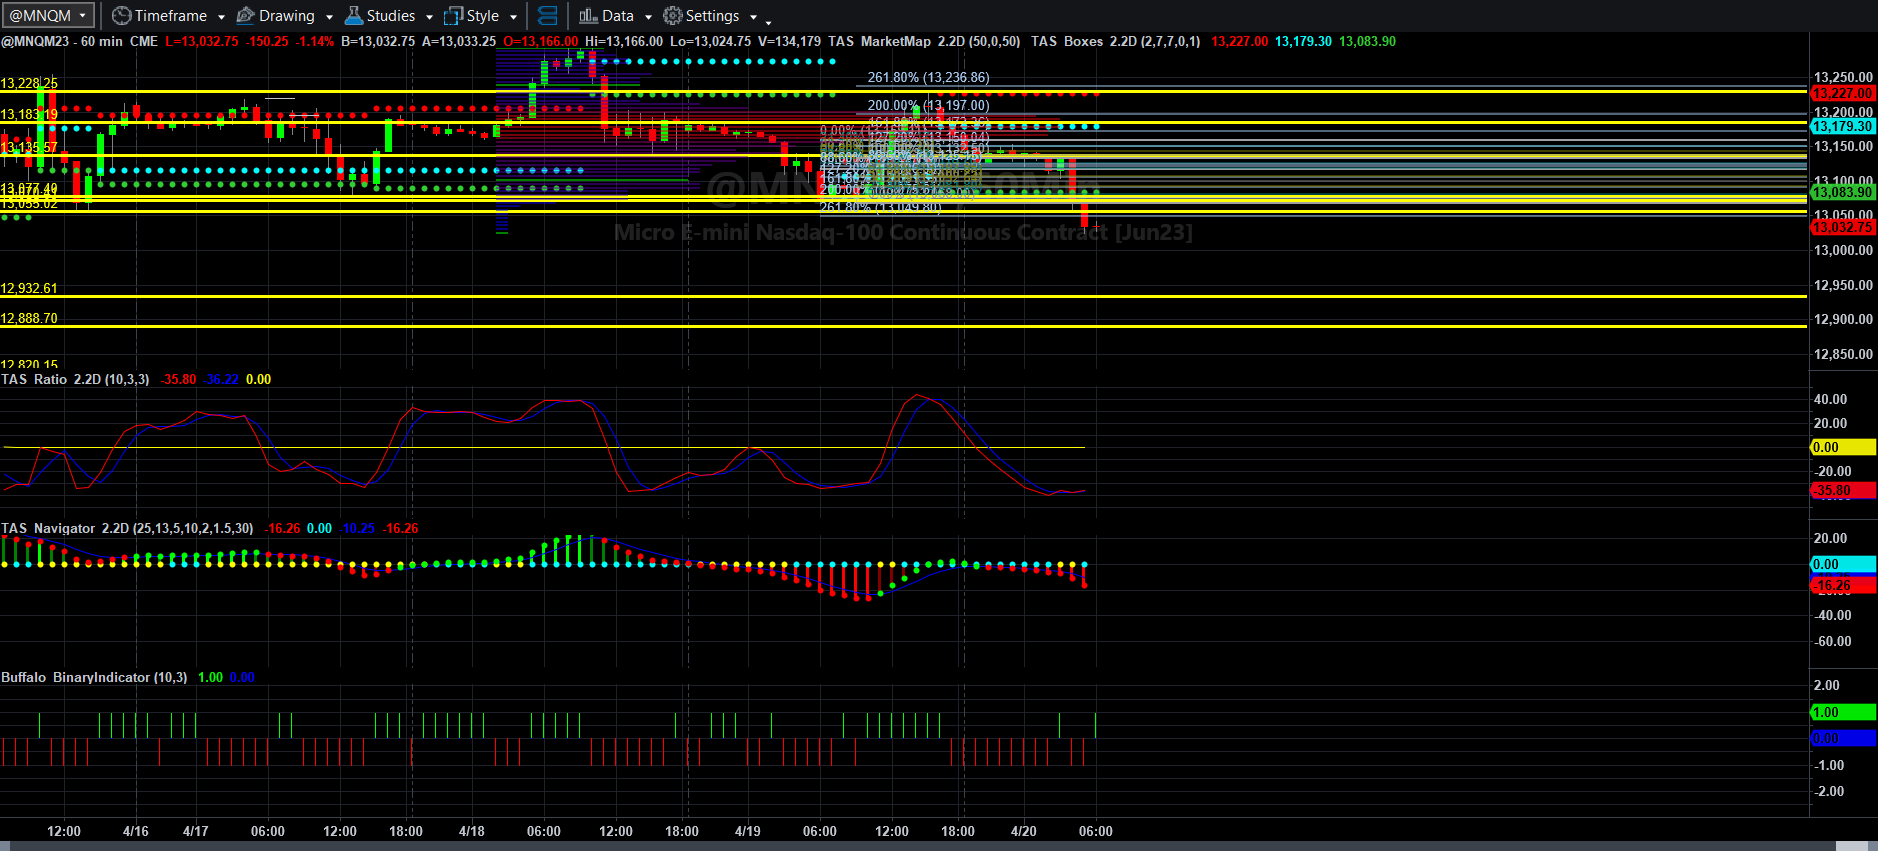
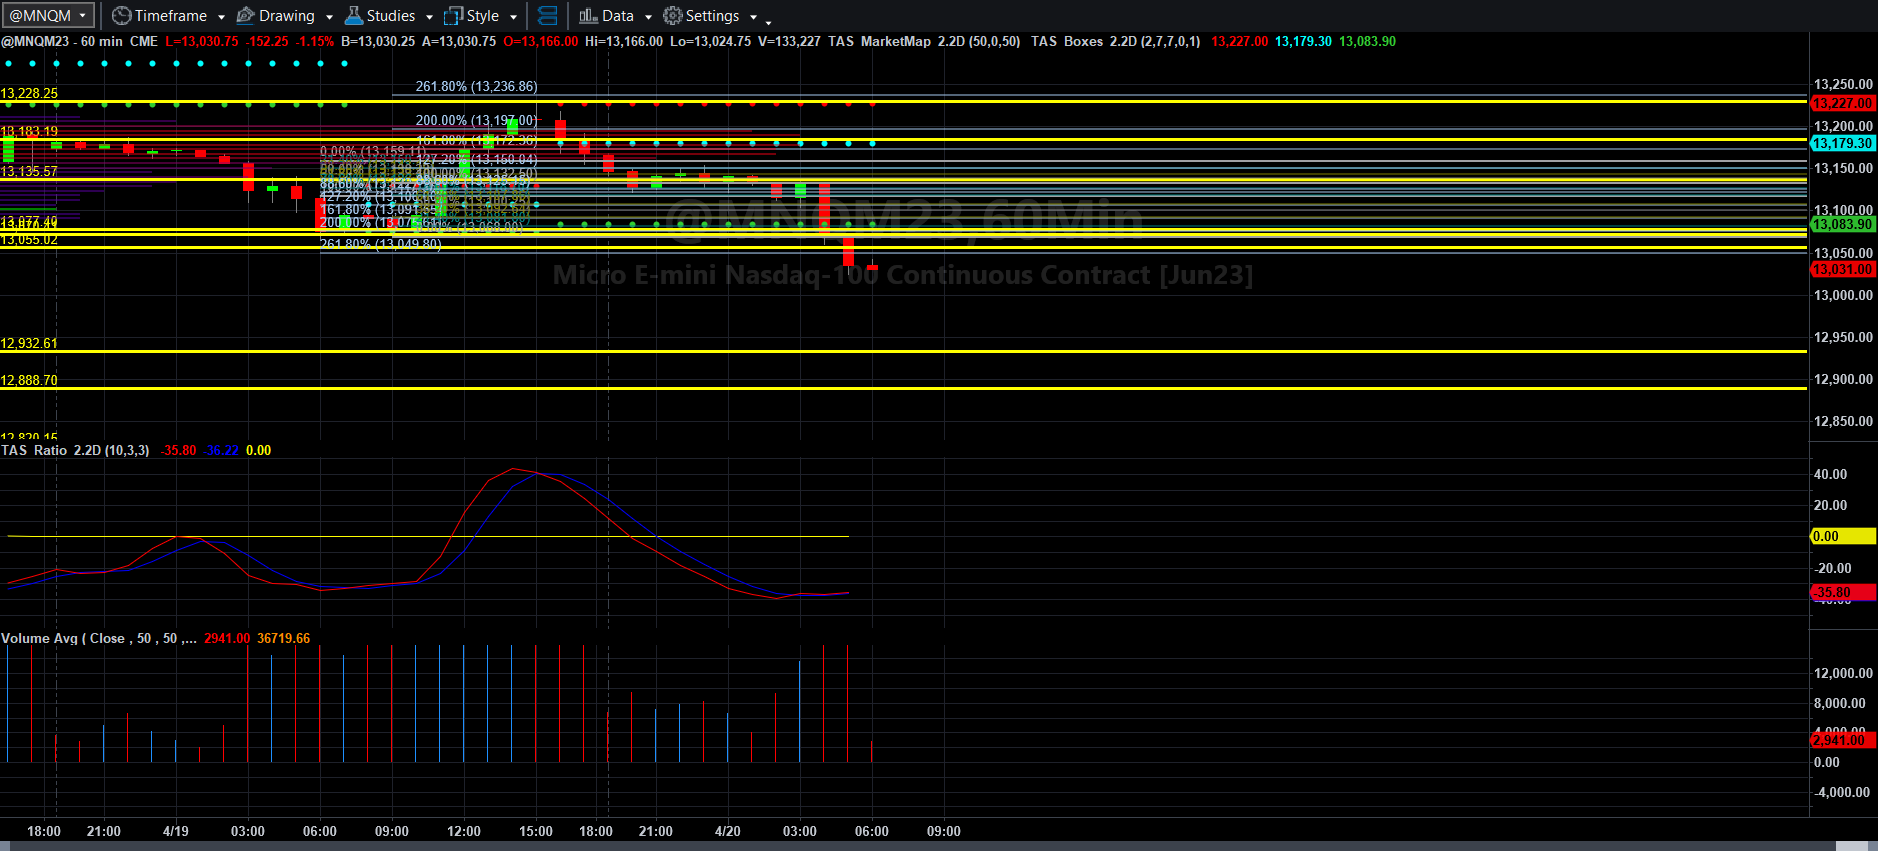
Price and Total Volume With 50-period Moving Volume Average
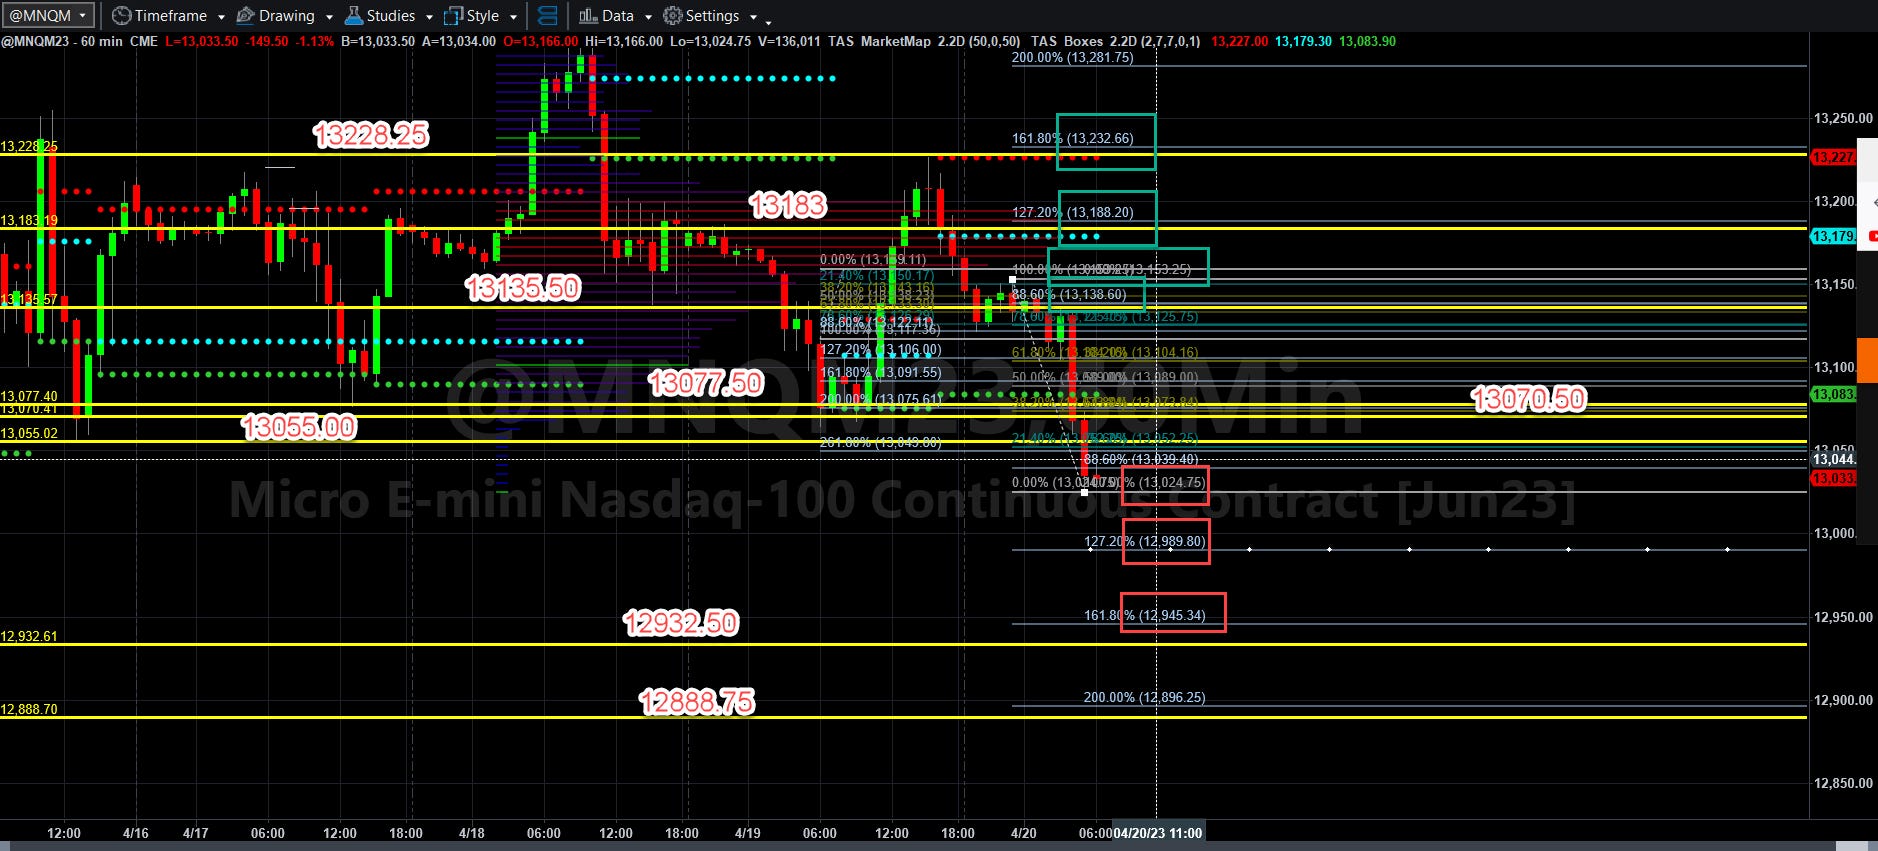
Fibonacci Price Scale With Targets
As seeming as it has become typical many days with MNQM23, when U.S. Market close, the opposite price action happens in Asia and Europe. Overnight Asians absorbed the excesses of the rally and Europe seems to have piled on in their late morning session, as traders become nervous over tech company margins and layoffs.
While some market technicians are still confident that a rally could be in place that could last a while, rednecks like me who have been charting a long time still question how confident traders are with Fed policy and particularly with Congressional budgetary policy designed to make American families achieve third world economic standards. This would certainly be the case if Americans are forced into buying electric cars without subsidies (which is what SHOULD happen). The only problem with that is that to do that, you have to basically bankrupt electric car companies that cannot be profitable without subsidies. I have been complaining about this since 2010. Are y’all finally picking up my point yet or are you still fuzzy on that concept?
Getting back to charts, if MNQM can rally above that concentration of VWAP lines below 13077.50, it has a shot at getting back to 13135.50 to 13138.60 and over the next couple of days back to 13153.25 13188.25 and back above 13232.50. If not, the wide gap in VWAP lines sets up a selloff back through 13024.40 to 12989.75 and 12945.50 or even lower as Friday ends.
I have no idea how it will all turn out. It depends on who shows up. I think the reality of this market sits between David Keller’s analysis and mine, but the reality is that I think anyone who uses logic is that extrinsic factors related to policy wonks and criminal politicians can taint and twist any trend model you have currently. If you don’t think Congressional and Fed policy doesn’t influence markets, then why did Elon Musk suddenly slash prices, making Tesla and other tech names react negatively? You can’t estimate that event with moving averages or Fib levels. All you can do is react to them when they show up in your charts, depending on the timeframe you use.
That is why I trade the way I do until sane economic policy or final capitulation to the economic damage created by political thugs and their policy mavens happens. I was able to pick up 25 NQ points net long, closing one loss short without getting booted and taking the next trade LONG for a nice profit. The equity rock moved forward yet again yesterday.
That is all for now. Have a profitable, fun, and productive Thursday. More will come soon.
Today’s Economic Data Courtesy of Trading Economics dot com. Be sure to refresh the date at the top left.
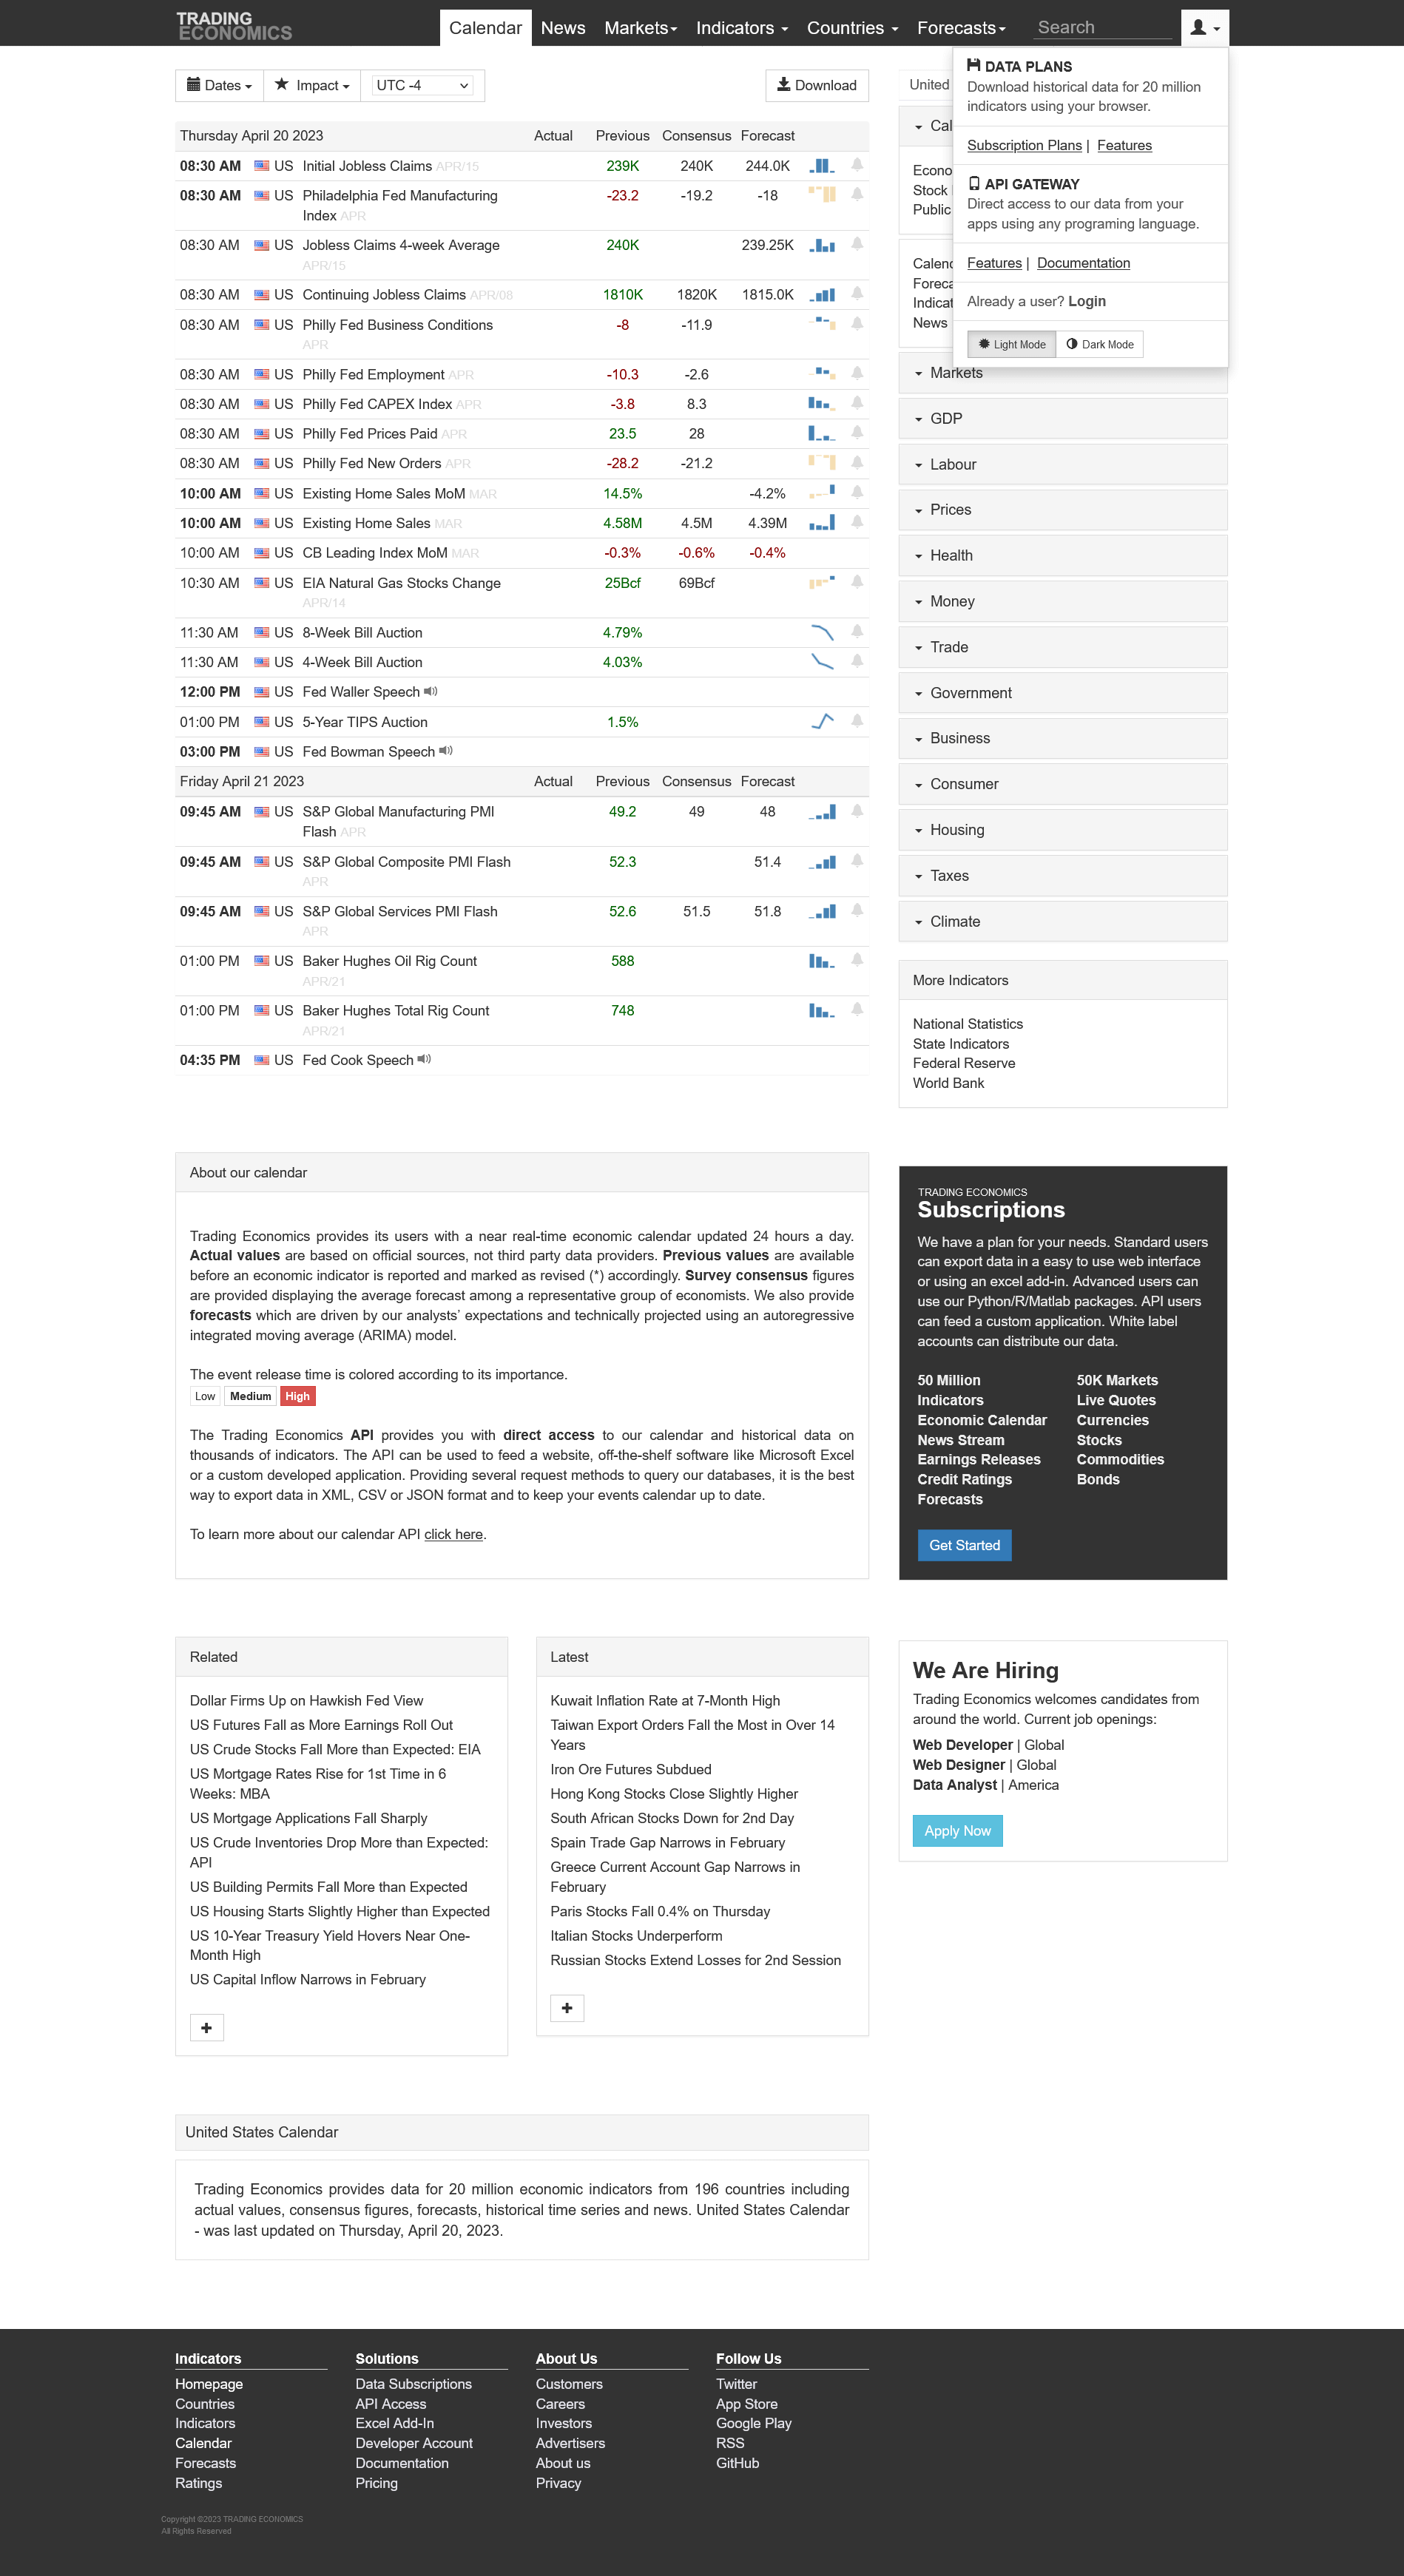
there's like 50 Fed speakers today........