

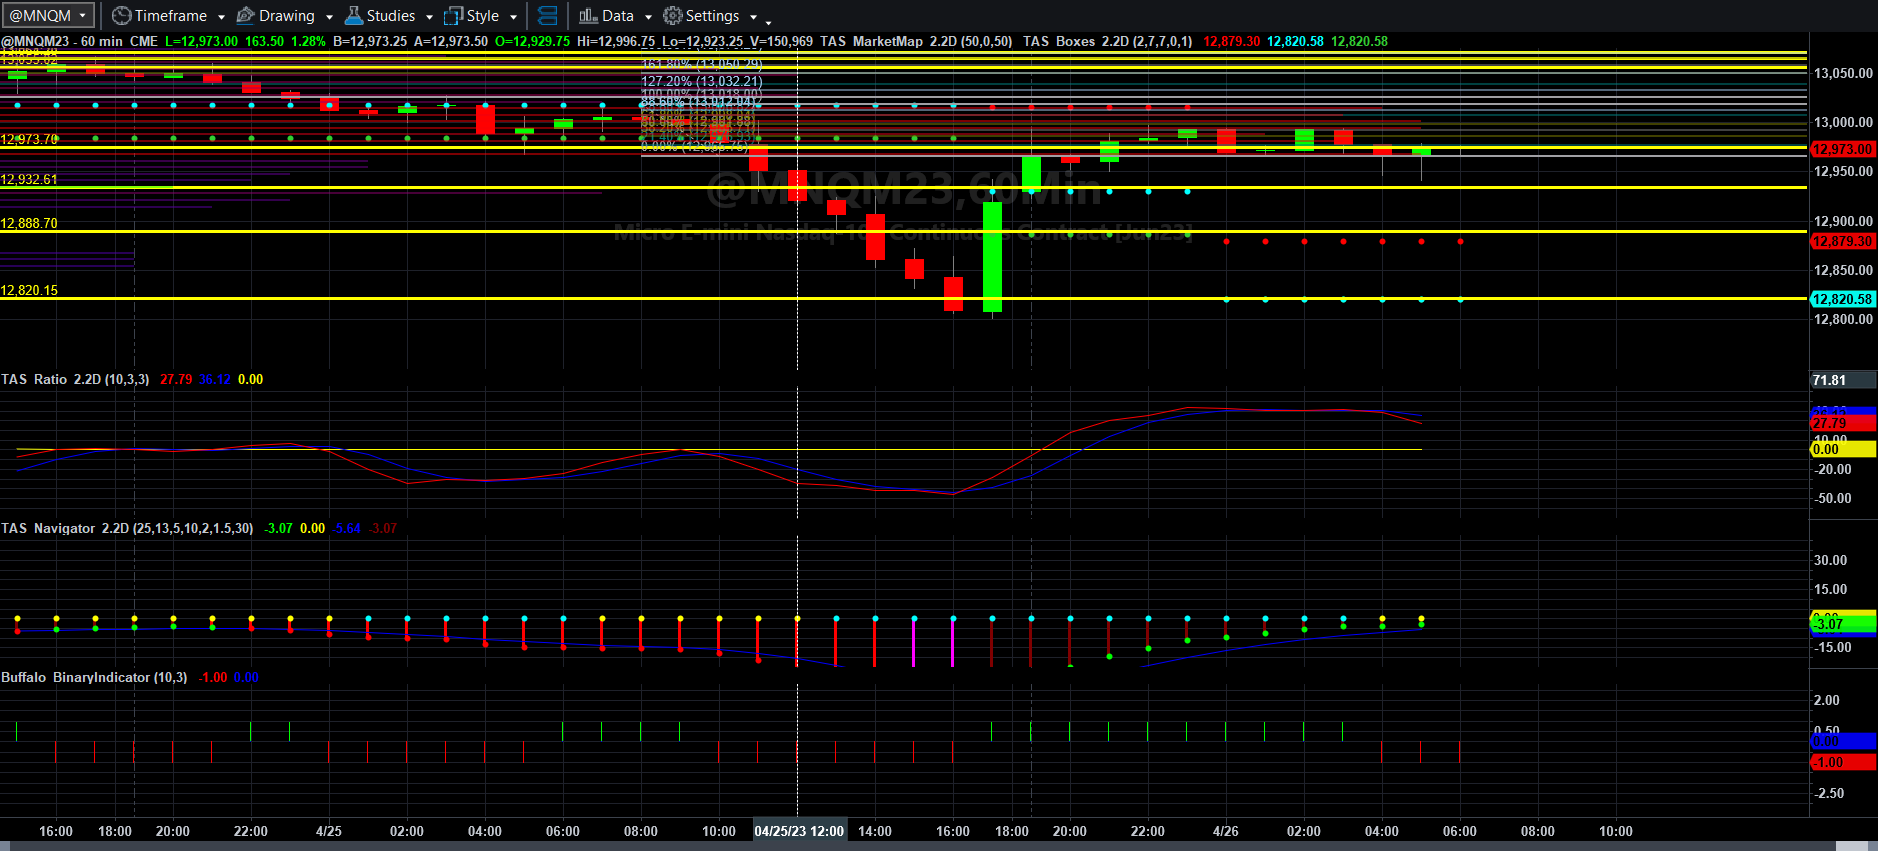
Price, Price Spread, Lagged Price/Volume Spread, and Binary Price/Volume Indicator
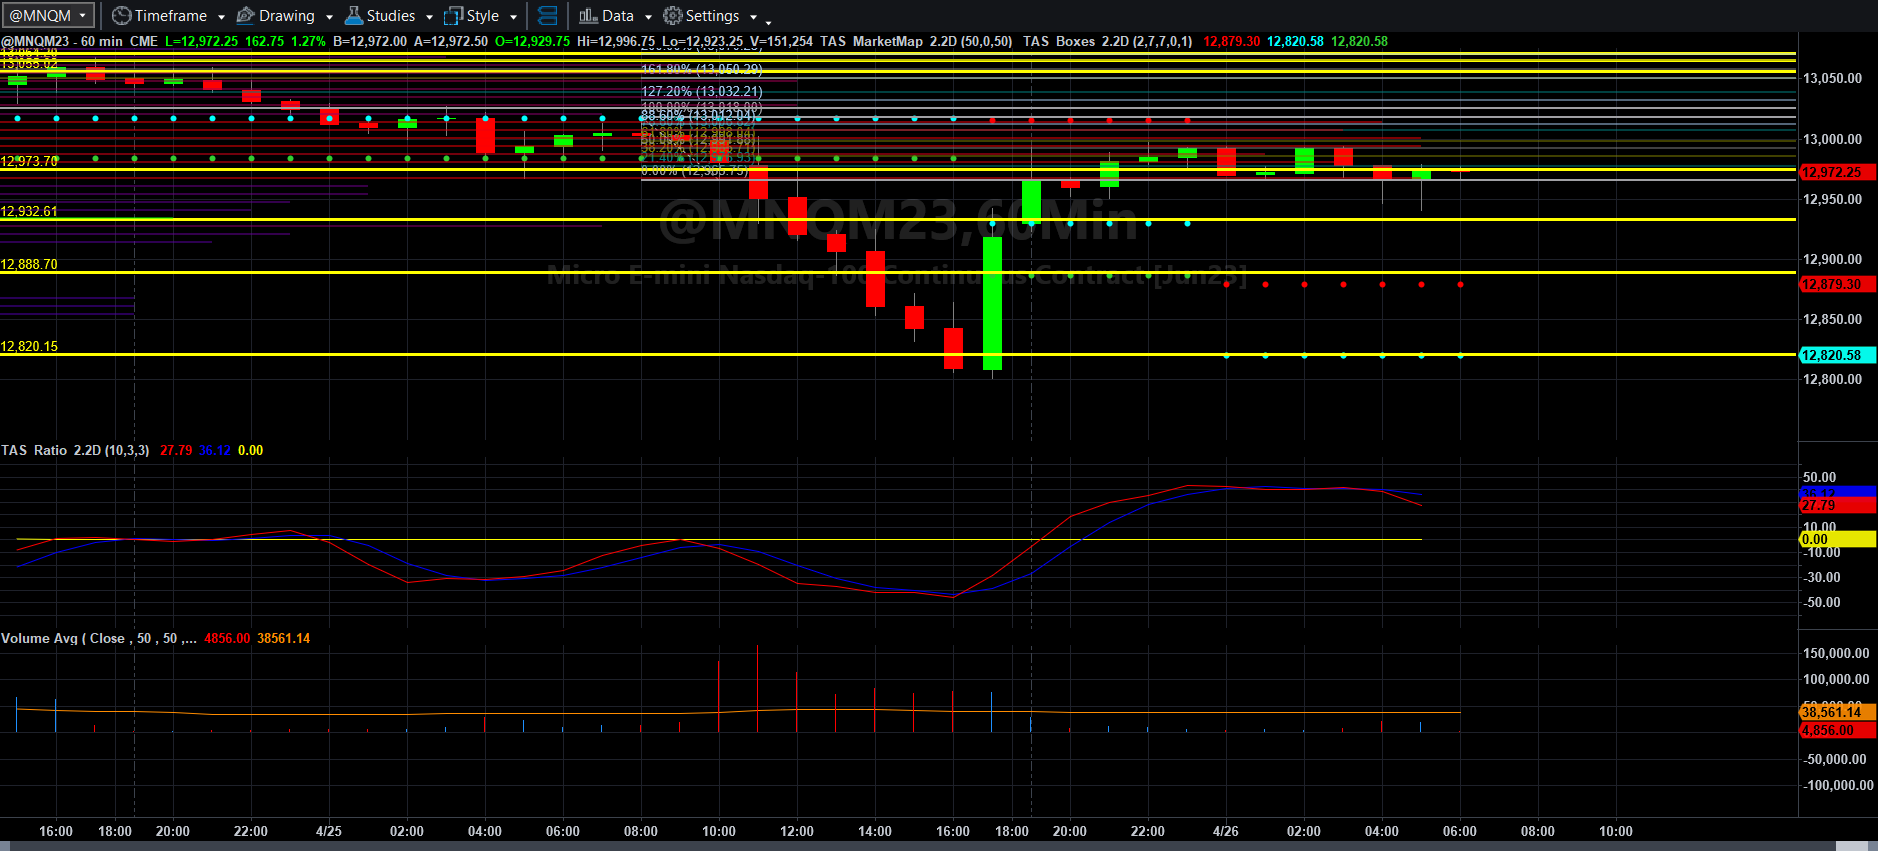
Price and Total Volume With 50-period Moving Volume Average
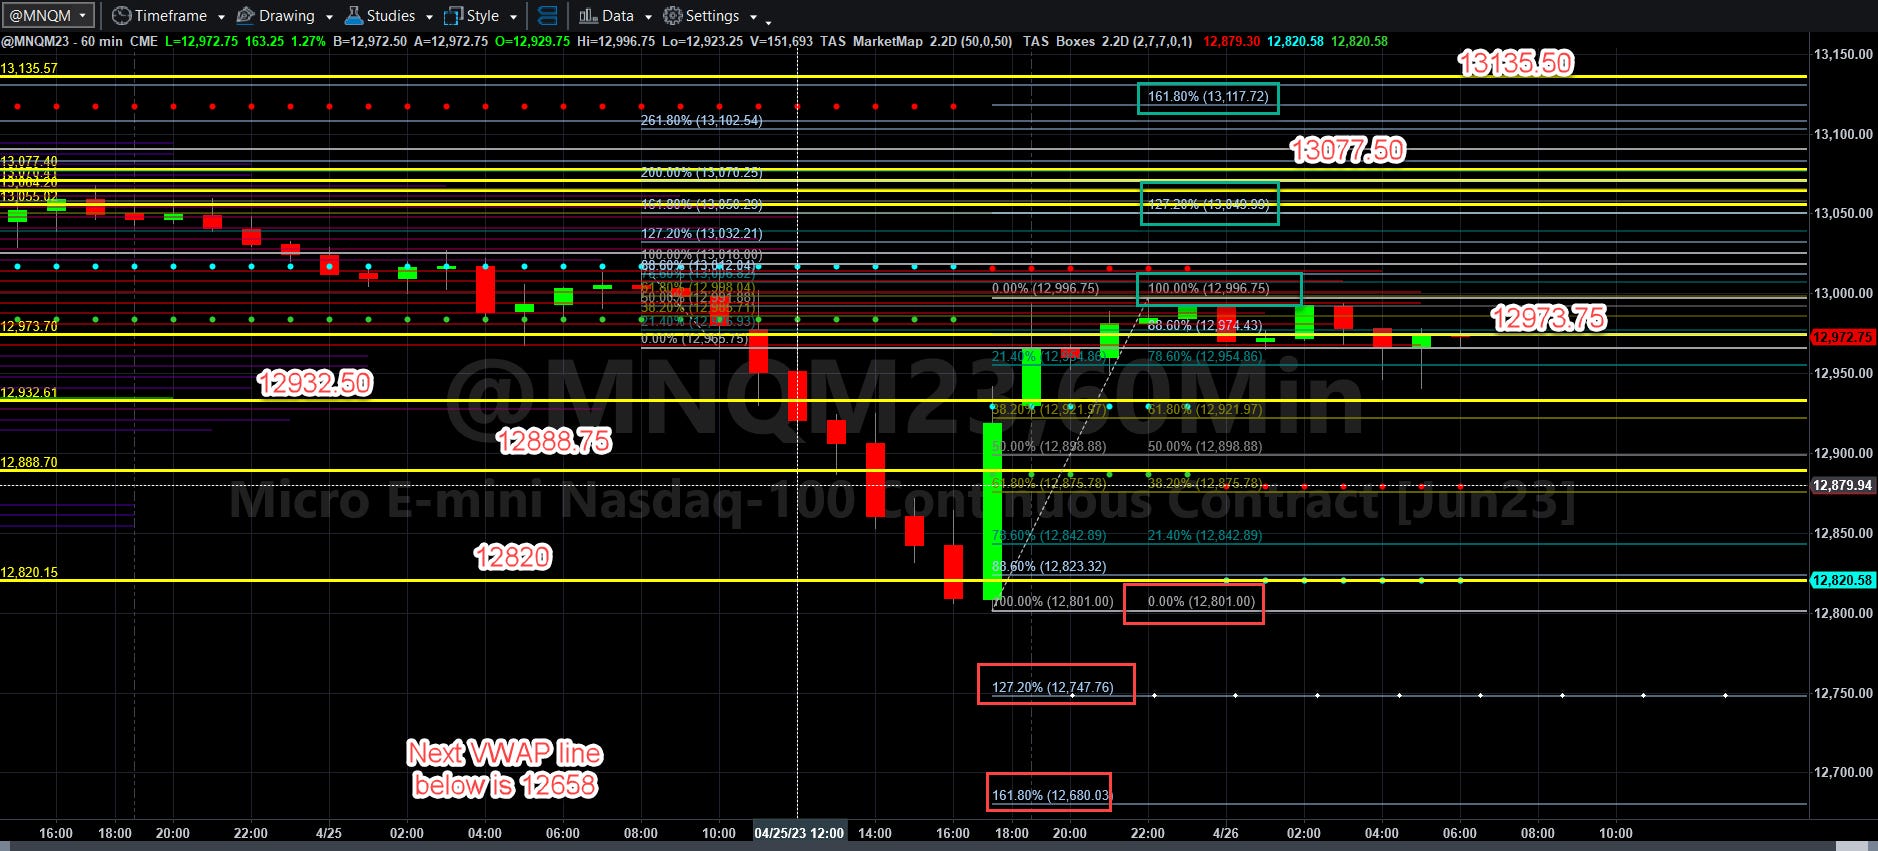
Fibonacci Price Scale With Targets
Yesterday’s downside targets were hit as banking news for First Republic Bank and worries about earnings began to take hold of traders. What is of course interesting is that once we approached the outer bounds of the 12820 VWAP line, we got a class melt-up. Asia idled prices for MNQM23 just below 13000 (12997 basically) and European traders have done nothing this time but hold prices somewhere near that area.
You can go to Bloomberg to read Goldman’s claim that the quants are out of “free money” ammo and that some kind of crash is ahead, but I ask you, do you not think that Goldman seeks to profit from that rumor? I think it is more constructive to look at what the markets are telling you through the charts than to fearmonger. Hourly charts have to a degree turned bearish, but as I said previously, all of this is posturing for next week’s unemployment and Fed rate decisions. News is coming from all sides, bullish and bearish, and it will be dealt with. NOTHING IS CERTAIN AT THIS POINT.
If MNQM23 can rally above 12973.75, then it has a shot to blow through 12996.75 and reclaim the 13 handles at 13050 and perhaps, if prices can break the thick VWAP wall that ends around 13077.50, get back to 13117.75 in the next couple of days (and perhaps back above 13135.50).
If it does not, it would not take much to push MNQM23 back to 12888.75, back to support at 12801 (which would basically eliminate the low volume melt-up of yesterday). If sellers really get active, then 12747.75 and 12680 would be the next targets to the downside over the next couple of days. The gaps at this point in the trading action are wider now to the downside than to the upside.
As you know, however, government pronouncements, our current insane news flows, and world events can change all this in a heartbeat. Earnings can help things too, but in this environment, anything can cause the toilet to flush or the champagne to flow. I will choose trading decisions based on data, setups, and my trade plan.
If you saw comments in yesterday’s post, I tend to cut off trading after 1100 EDT to 1115 EDT at the latest. I was net short yesterday morning, but the erratic volume kept me from holding short, yet I did manage a 6 NQ profit. I had to shift gears to other businesses right as the market sold off drastically. I am happy with that, as I did not lose money and pushed the rock forward. Another trader without the time restriction and with slightly different risk parameters than my own rode the price down to the target and bailed before the melt-up.
I am reading a book from a hedge fund trader that discusses techniques for trading slightly longer timeframes (this hedge fund trader is a day trader). Now that VXN is settling down, I will look a taking hourly trades on occasion as I continue to scale. That would allow me more time to work on all my projects (and I have a ton of them) and continue to profit maximally when markets move as they did yesterday.
Will that happen today? I have no idea. That is why I trade what I see on the chart.
More will be coming soon. Have a profitable Wednesday and a happy and productive one also.
Today’s Economic Data Courtesy of Trading Economics dot com. Be sure to refresh the date at the top left.
