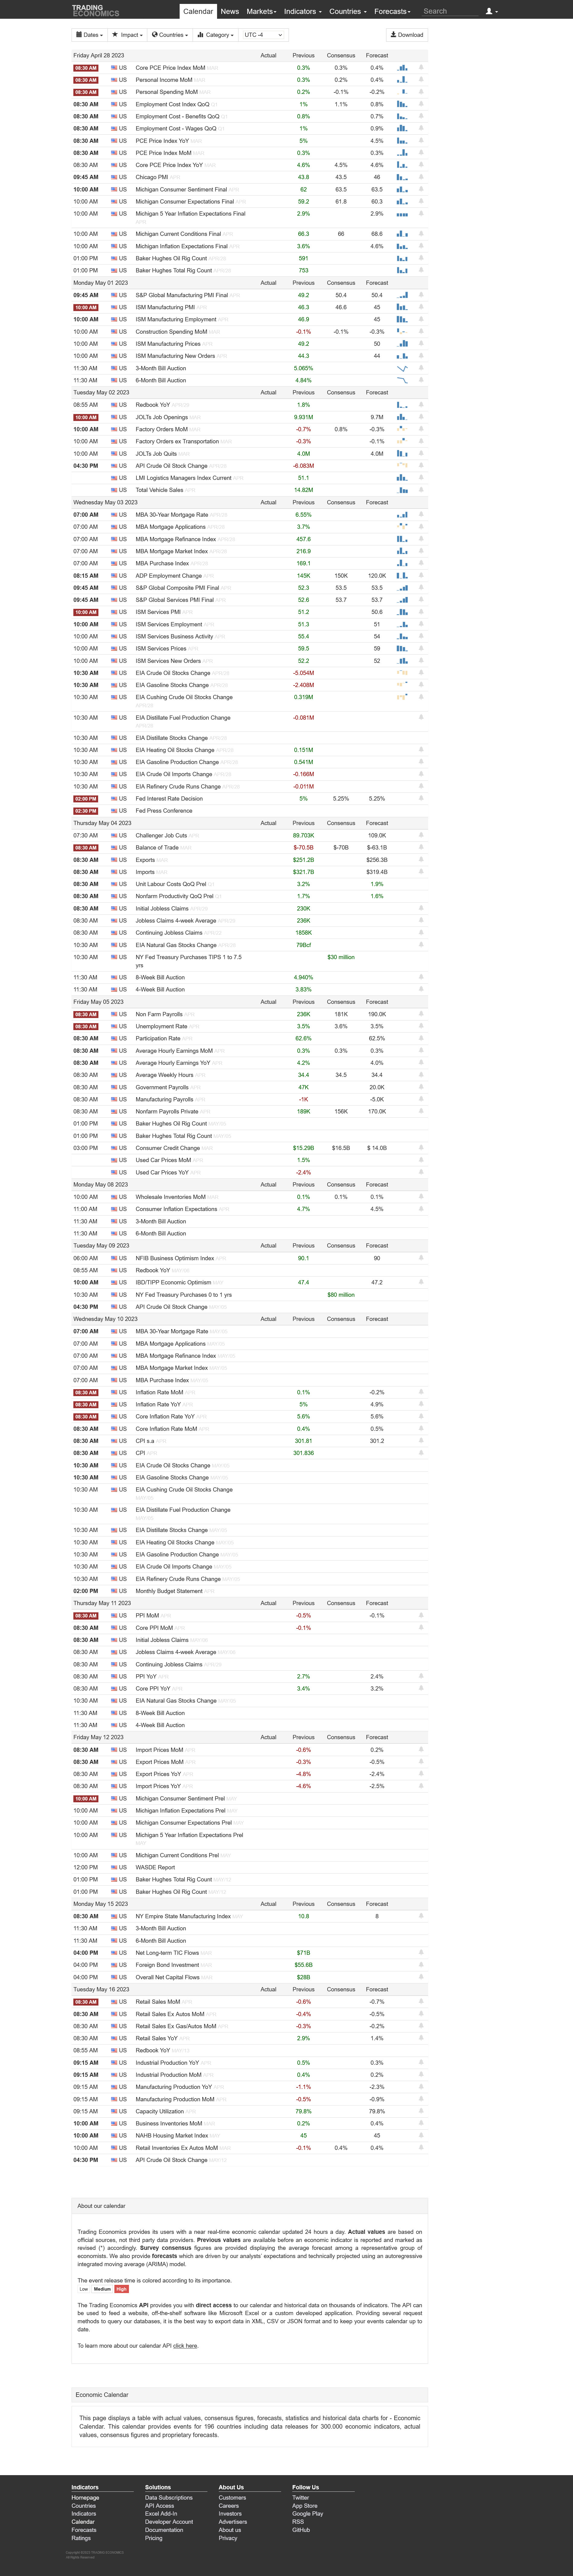
Price, Price Spread, Lagged Price/Volume Spread, and Binary Price/Volume Indicator
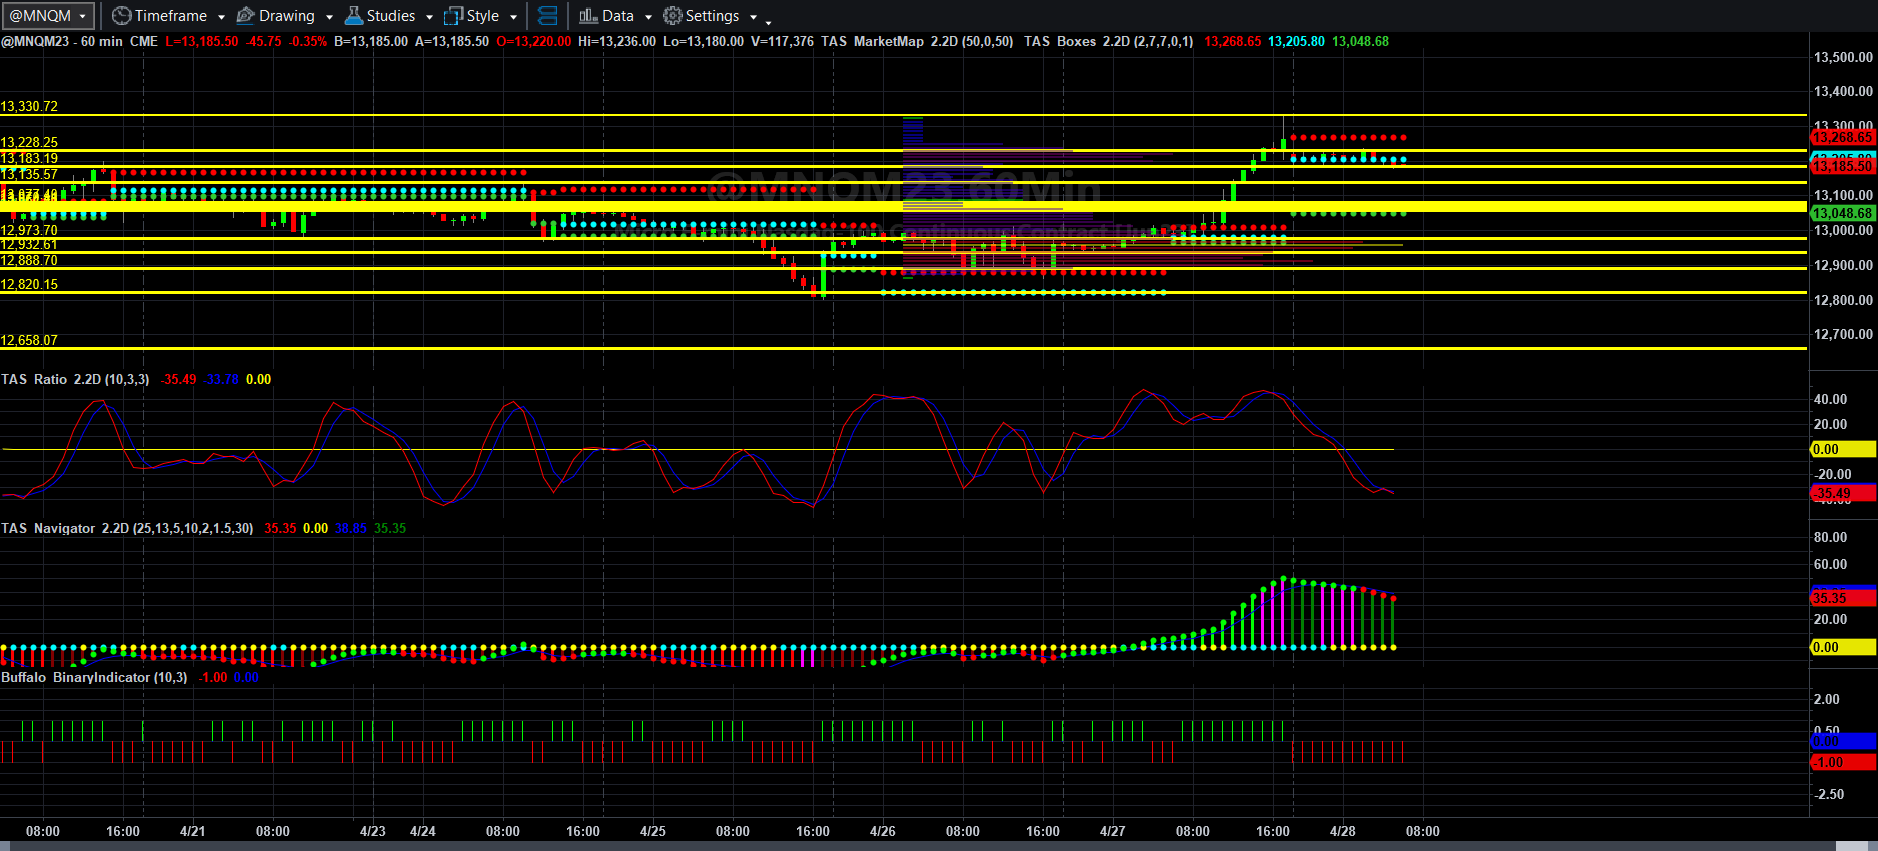
Price and Total Volume With 50-period Moving Volume Average
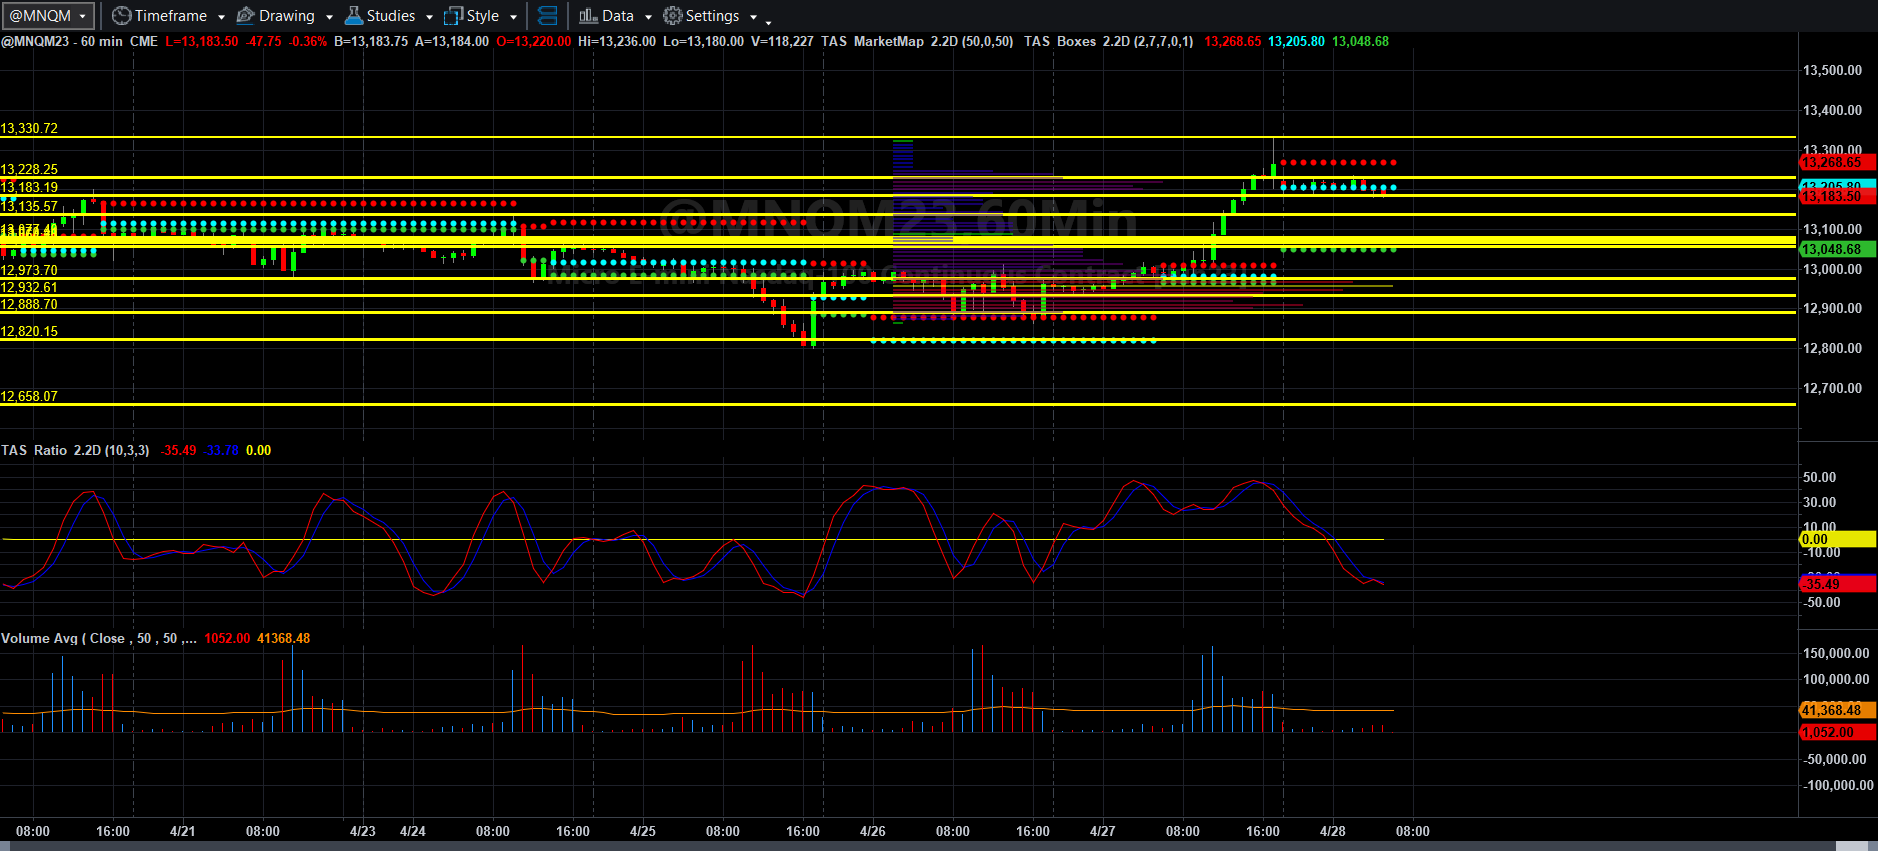
Fibonacci Price Scale With Targets
Yesterday’s data seemed to indicate an inflationary slowdown (perhaps) and the market rallied right into the 13330.75 area and once again could not close above it, giving me, at least, the indication that rate cuts (which we may or MAY NOT see next week) could be the only way the price of MNQM23 can rise above that seemingly solid level and move higher. There is news this morning that Amazon cloud services are in the midst of a business slowdown, but there are slowdown indications in many places. There are indications and counterindications of everything good bad ugly beautiful, and particularly insane things going on. I will instead focus on what the charts are tending to show.
The breakout yesterday was the first indication of a shift from lower lows and lower highs to higher lows and higher highs in the hourly chart. The permanence of that shift may be hinted at today but likely confirmed next week, as today is Friday.
If MNQM23 can remain above 13183.25, it has a good shot at blowing out the 13220.25 VWAP line and rechallenging the 13330.75 VWAP to 13331.50,13426, and perhaps even 13546.50 early next week.
If not, it could be a very short trip back to 13077.25, 13058.50, and if that cluster of hourly VWAP lines is broken to the downside again, 12983.75 and 12889. Is 12820 and lower possible? It is if sellers really get active, but if not, it could hit early next week.
I really don’t know what will happen, as these moves seem rather synthetic given the way government data gets tossed out, contradicted, and reshuffled. We should see how sentiment moves in larger measures as unemployment data and Fed decisions hit this week.
I was desirous of leaving an additional contract on long yesterday, but I did not as I had to seriously contend with another issue in another business. I picked up 28 NQ points long and went on with the day. MNQM23 took advantage of all the gaps in commercial interest and ran like a scalded puppy to that biggest resistance line. Hopefully, full-time breakout traders rode it to that resistance level.
Notice how Fibonacci levels are in fairly high confluence with VWAP lines at the moment. We will see if that continues going forward, but volatility can sometimes wreck that relationship, bullish or bearish.
That is all for now. Have a fantastic, profitable, and productive Friday.
More will come this weekend.
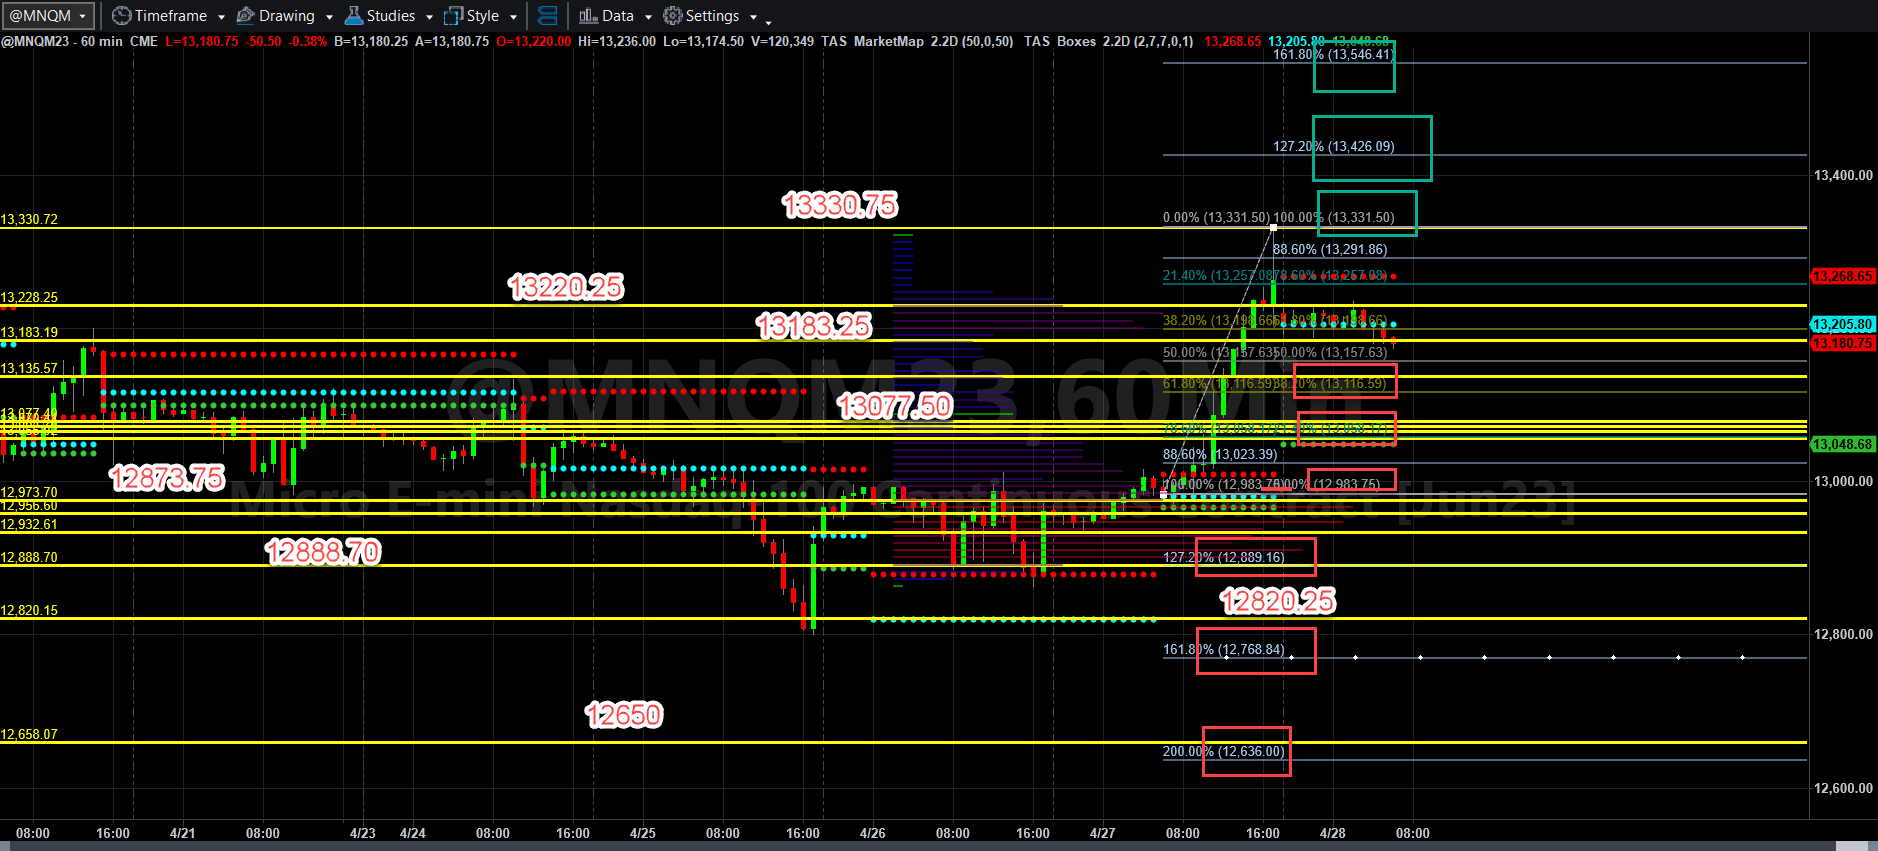
Today’s Economic Data Courtesy of Trading Economics dot com. Be sure to refresh the date at the top left.