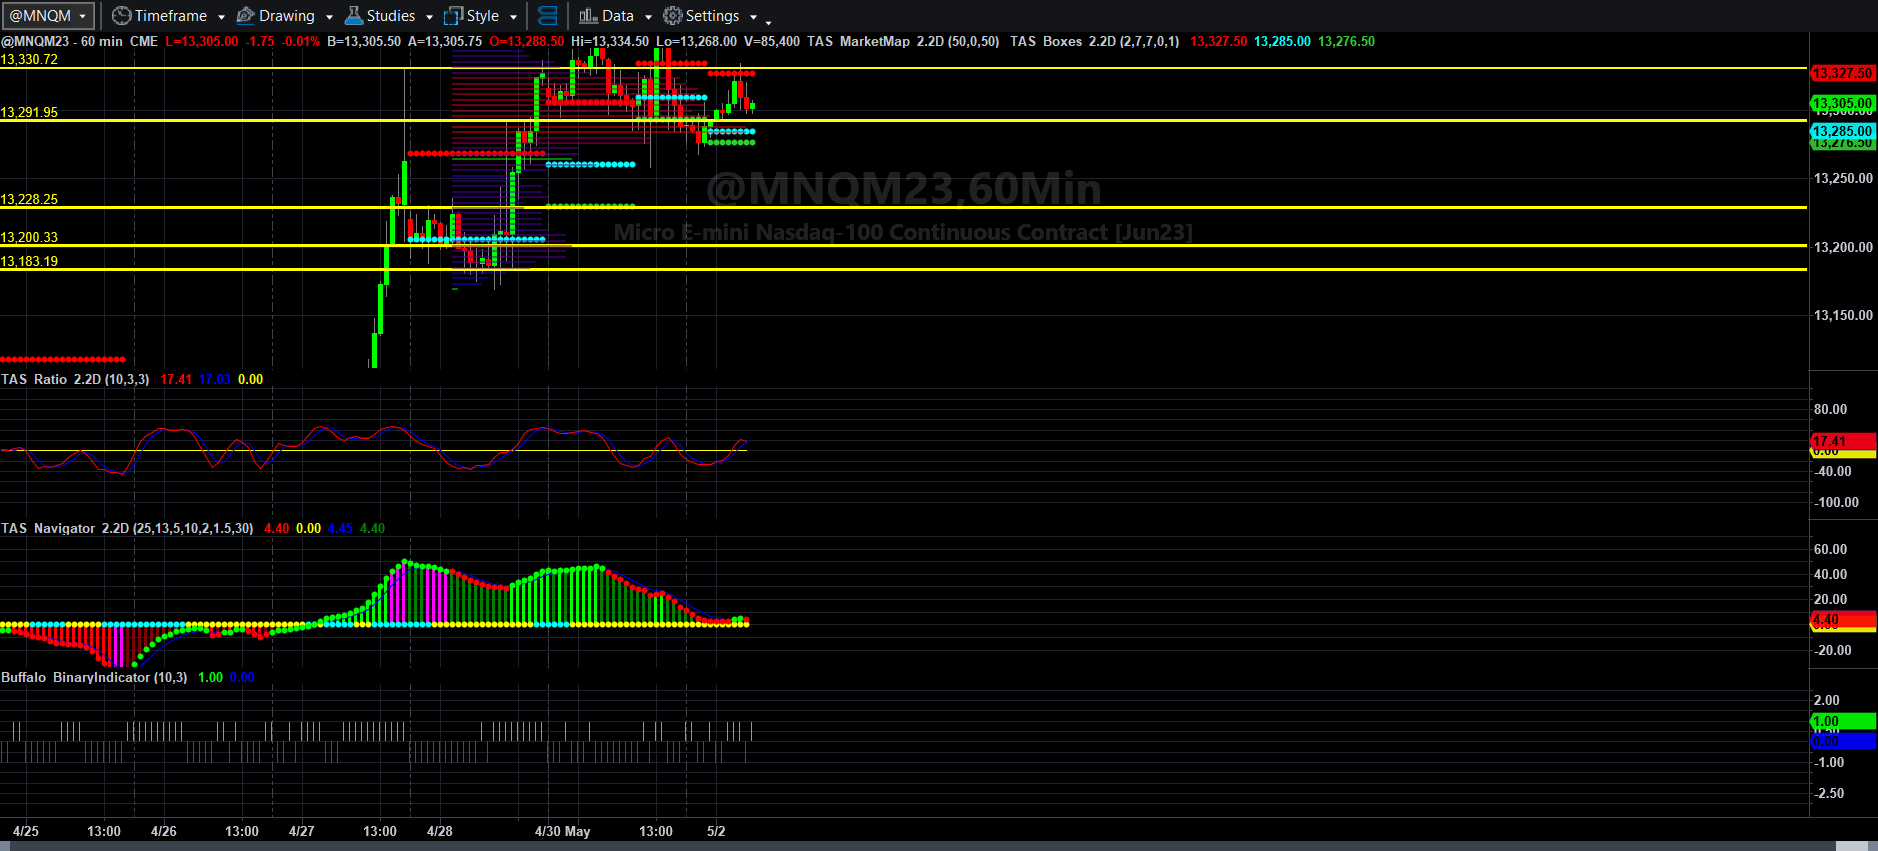
Price, Price Spread, Lagged Price/Volume Spread, and Binary Price/Volume Indicator
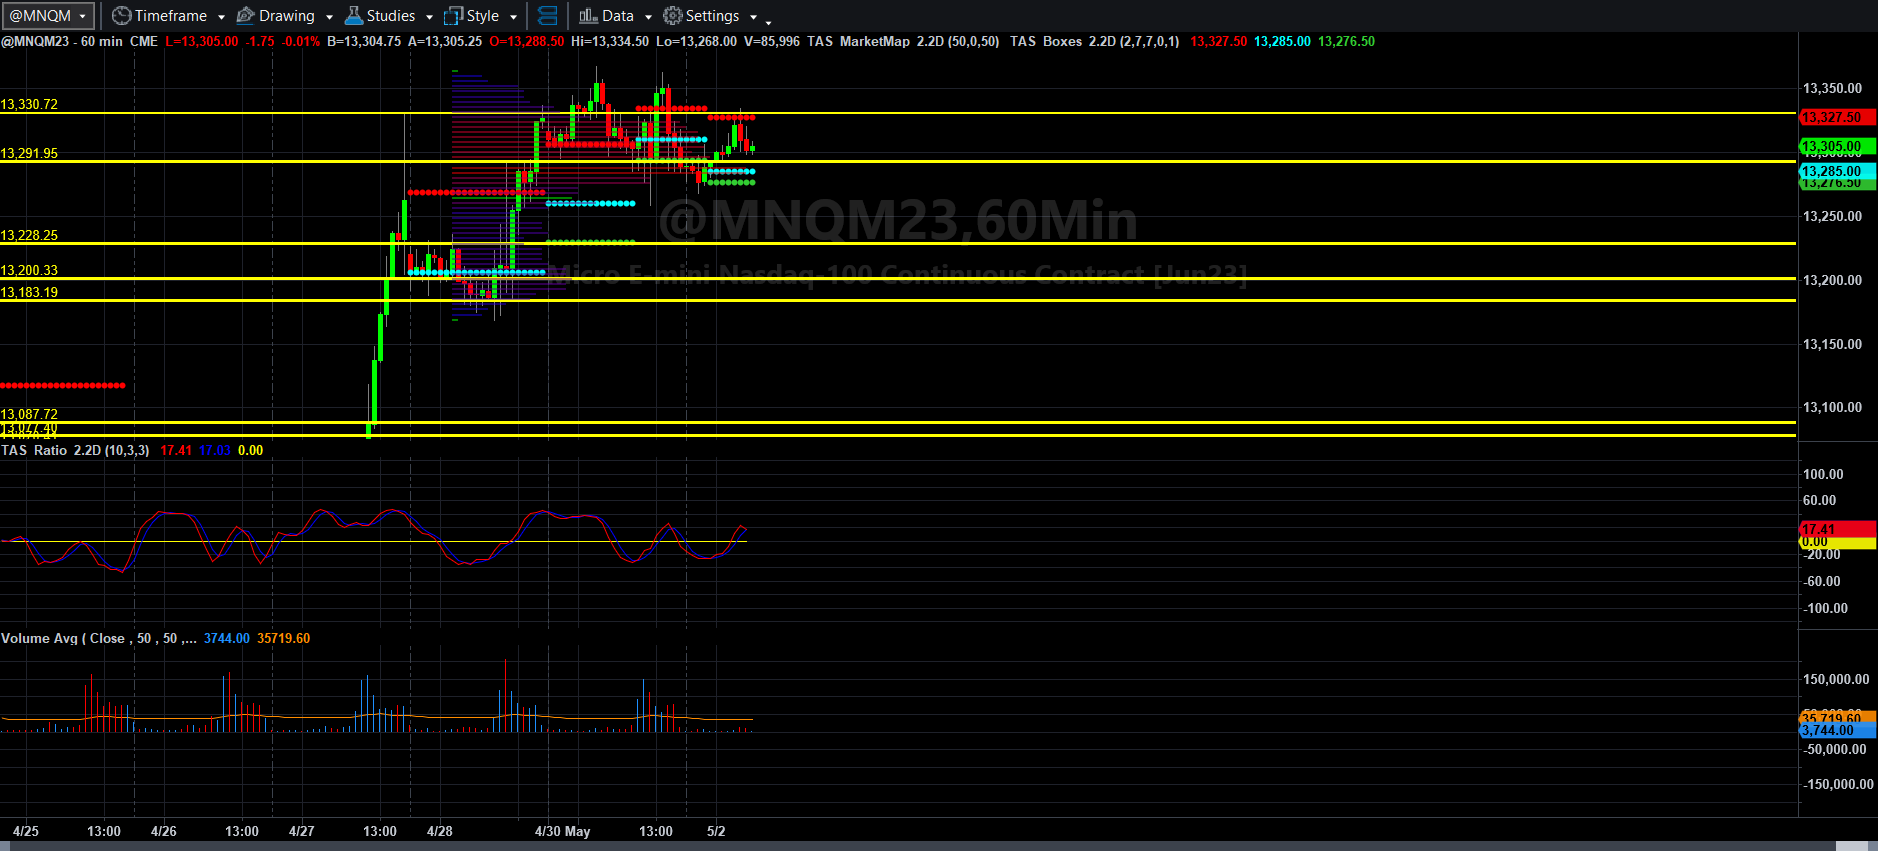
Price and Total Volume With 50-period Moving Volume Average
Fibonacci Price Scale With Targets
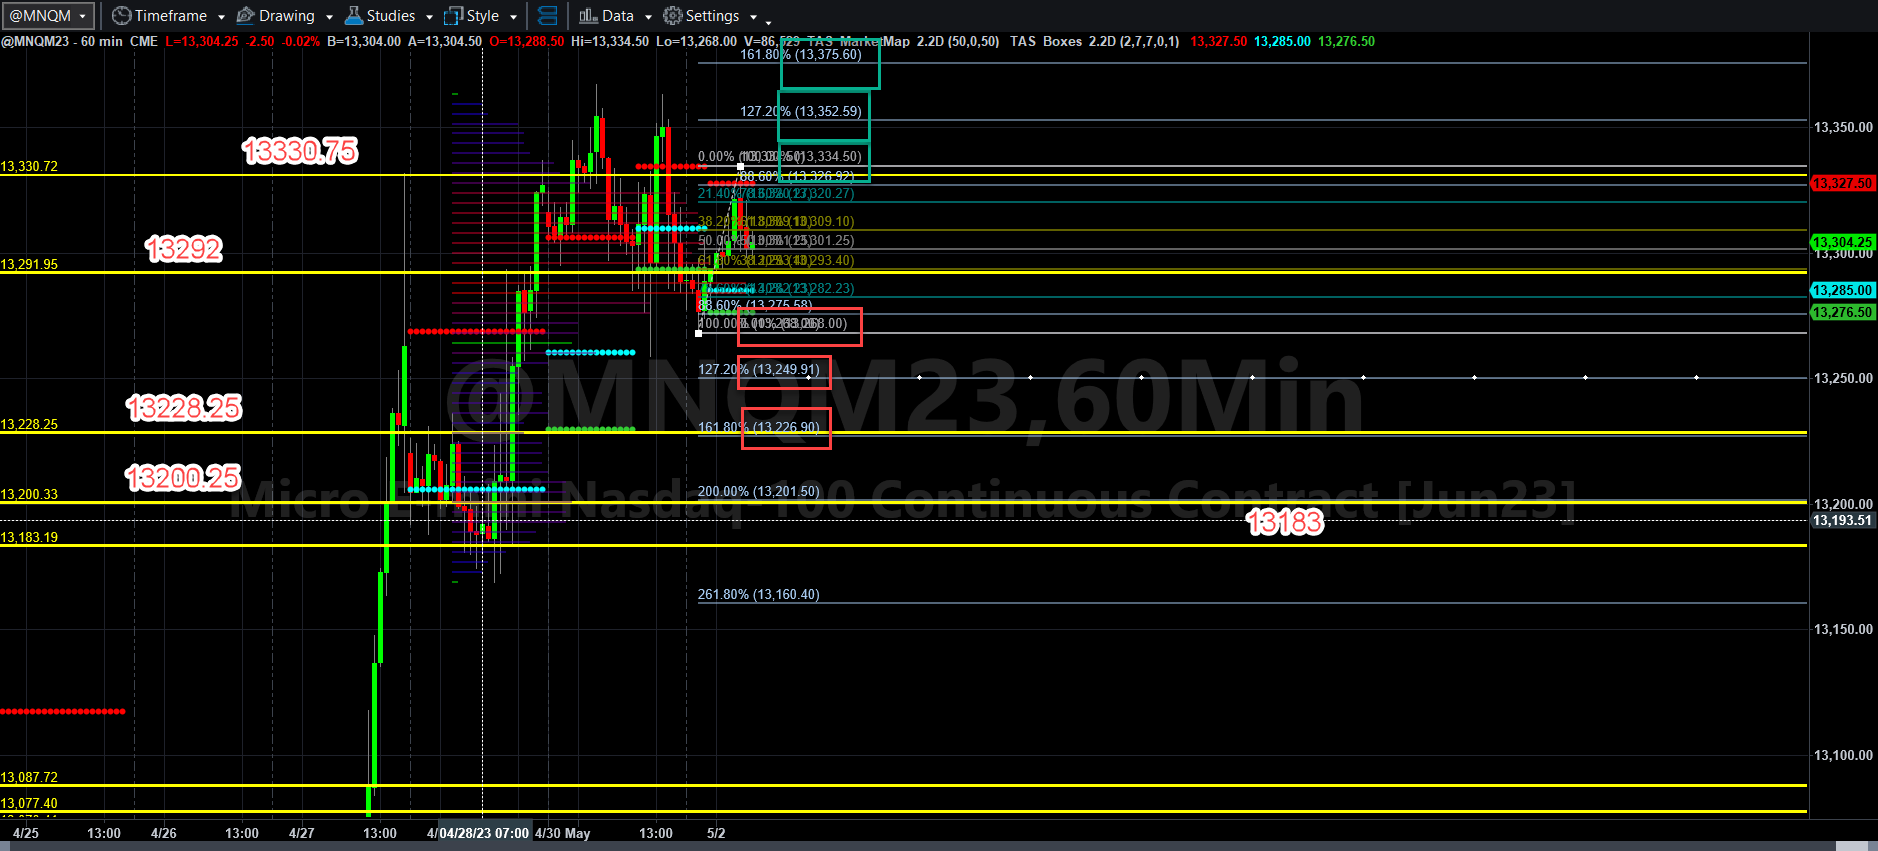
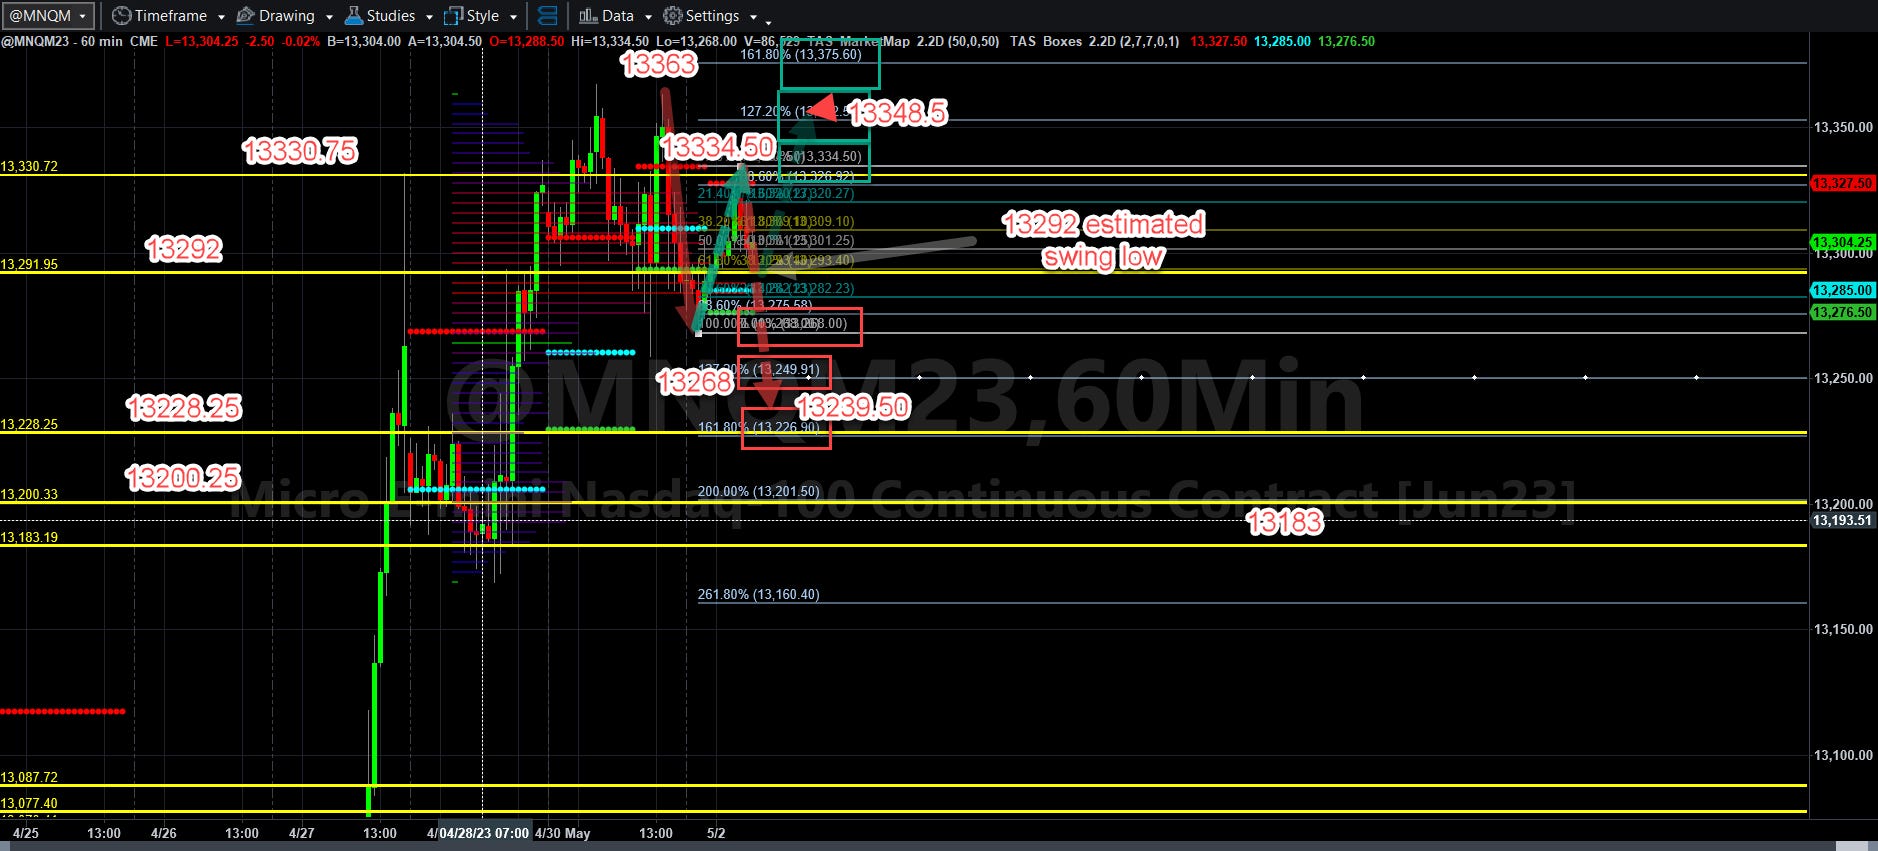
Fibonacci Price Scale With potential AB=CD targets estimated (Bullish and Bearish)
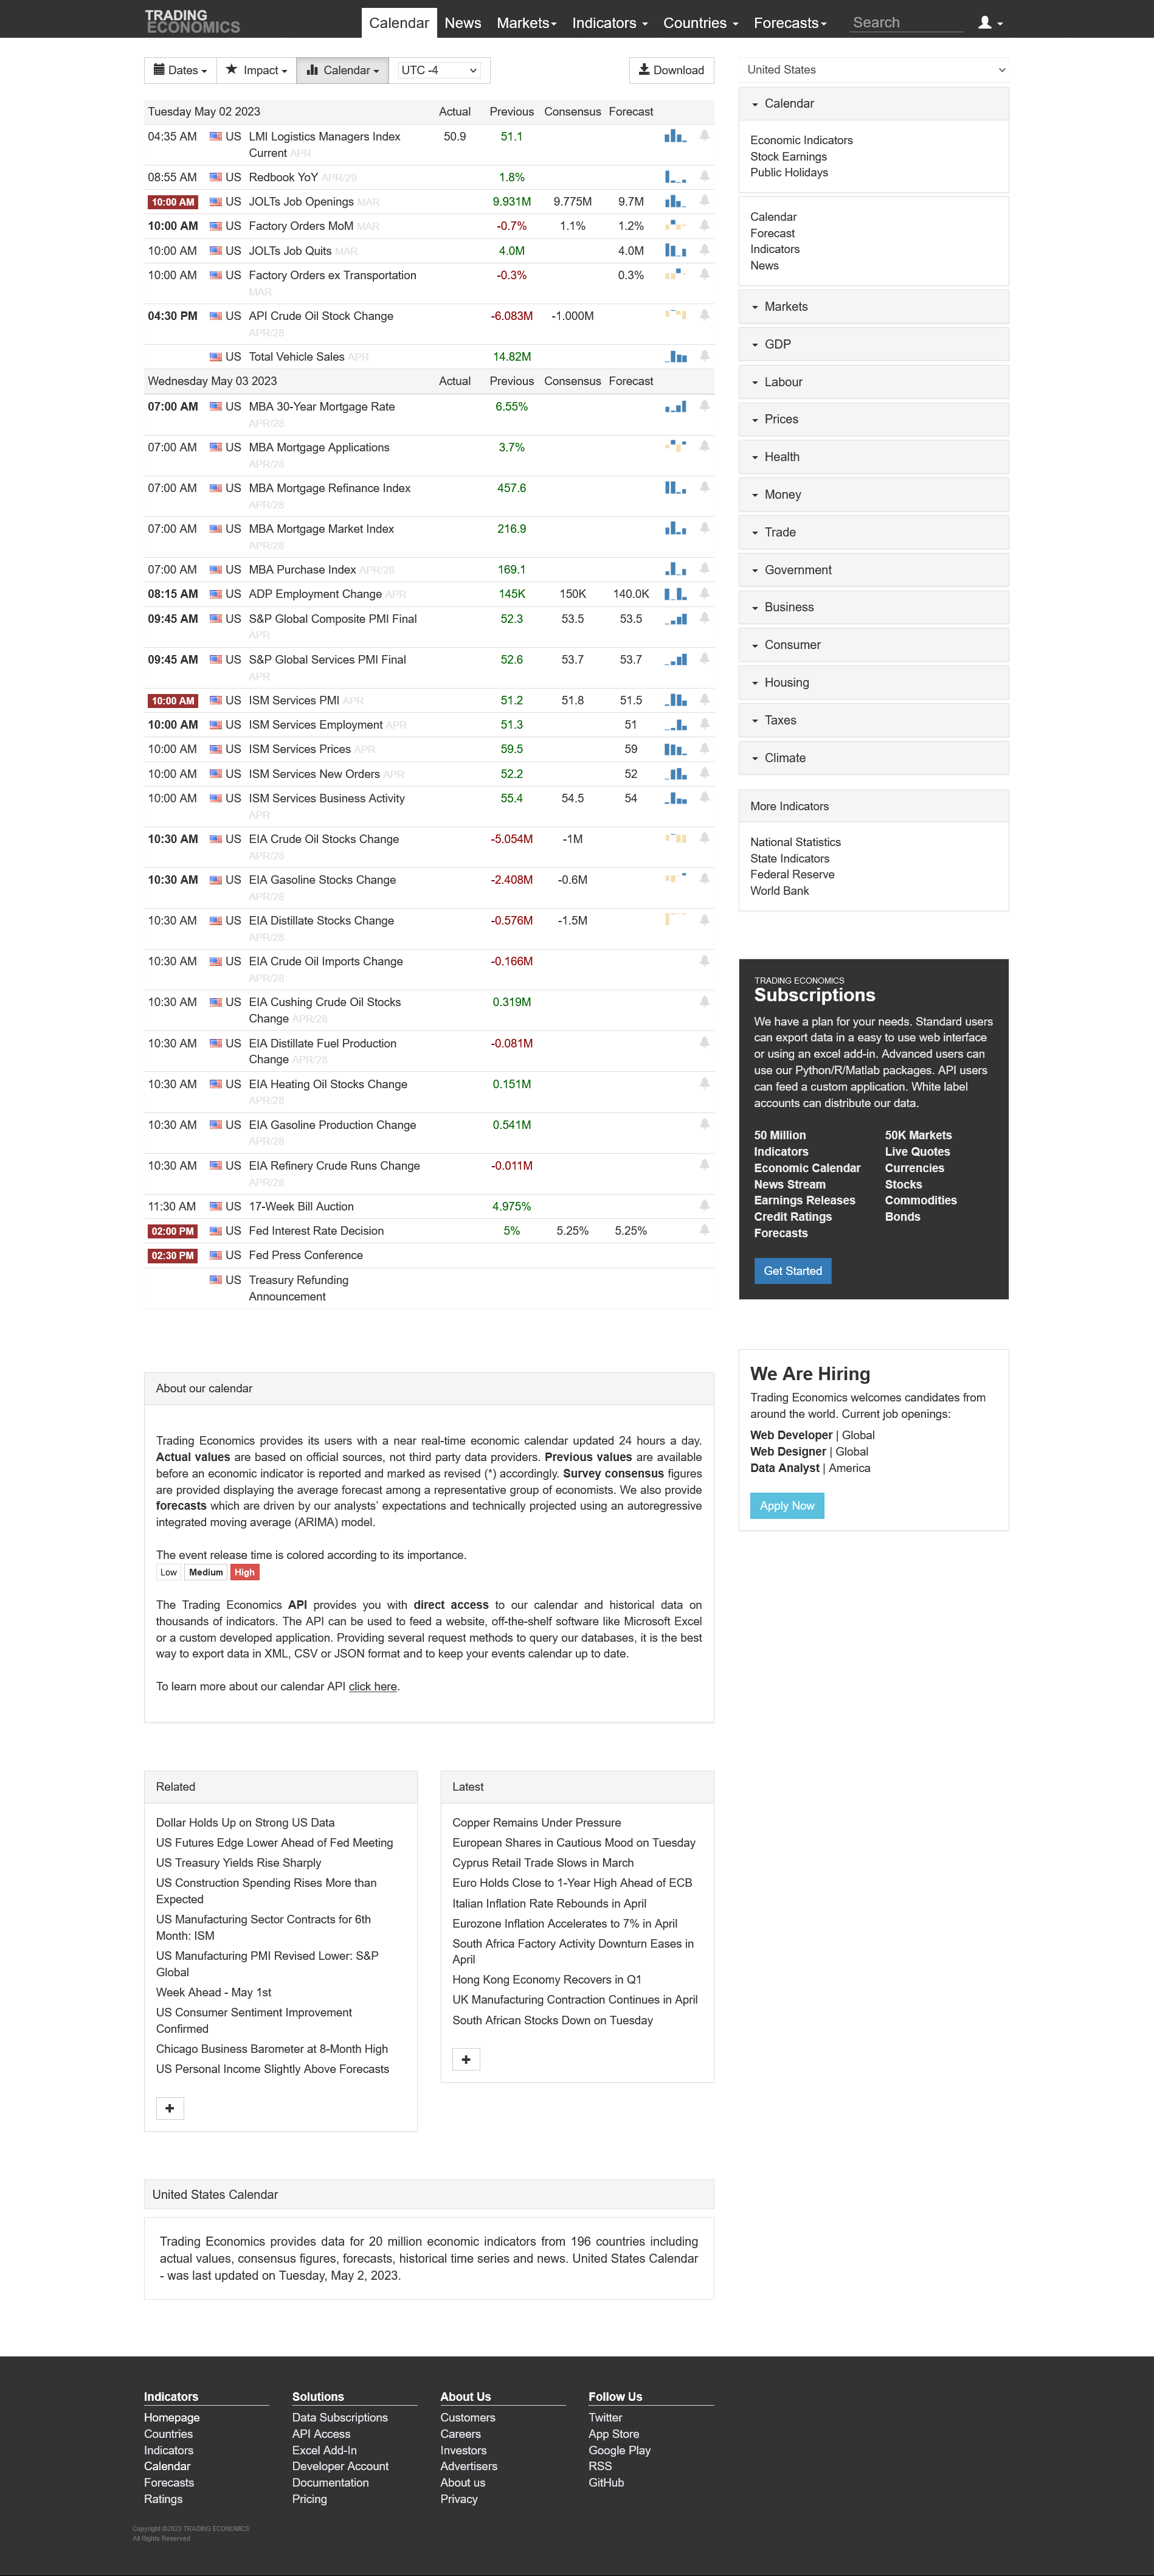
Yesterday’s economic data was positive, which, if inferred as “overheating the economy” could mean Chairman Powell would be motivated to raise interest rates, you see headlines in Bloomberg about Morgan Stanley layoffs as dealmaking is in a slump. Is that, as other econometric data suggests that a recession is at hand (or worse)?
We will begin to get the answers tomorrow and into the rest of the week, but what are the charts indicating for MNQM23?
If MNQM23 can remain above 13292, the odds are good that the previous high of 13334.50 can be exceeded, and that 13362.50 and 13375.50 can be hit if buyers take command en masse. If not, MNQM likely retreats to the 13268 low and perhaps pulls back to 13250 and perhaps even back near the VWAP line around 13228.25.
On that final chart, which is a bit busy, you can see the bearish AB=CD pattern is translucent red and the bullish AB=CD is translucent green. Though at the moment of this publishing, it appears the bears might be winning the argument, the bullish target is 13348.50 and the bear target is 13239.50.
I got bounced out of a long for a 10 NQ point loss yesterday despite my best efforts to not get hit by sporadic selling. Today I will watch the price momentum spreads even closer to see how volume and price align. I will saddle up again this morning and see if a trade can be made, if not, I will come back tomorrow.
More will be coming soon. Have a profitable and happy Tuesday!
Today’s Economic Data Courtesy of Trading Economics dot com. Be sure to refresh the date at the top left.