

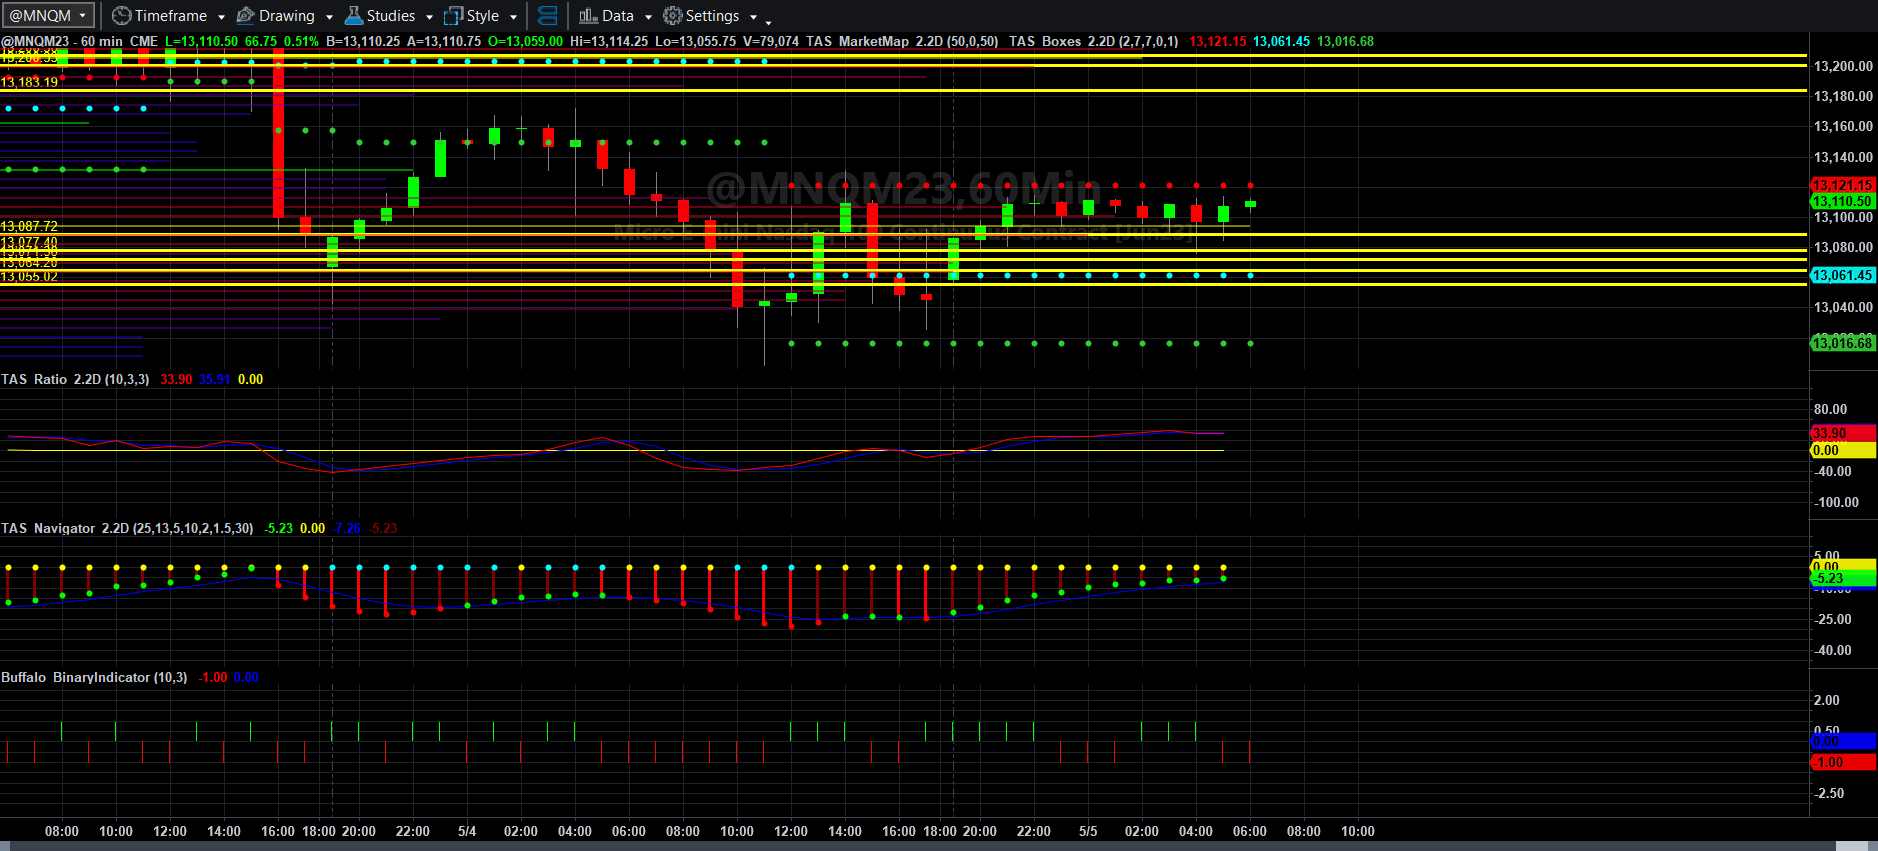
Price, Price Spread, Lagged Price/Volume Spread, and Binary Price/Volume Indicator
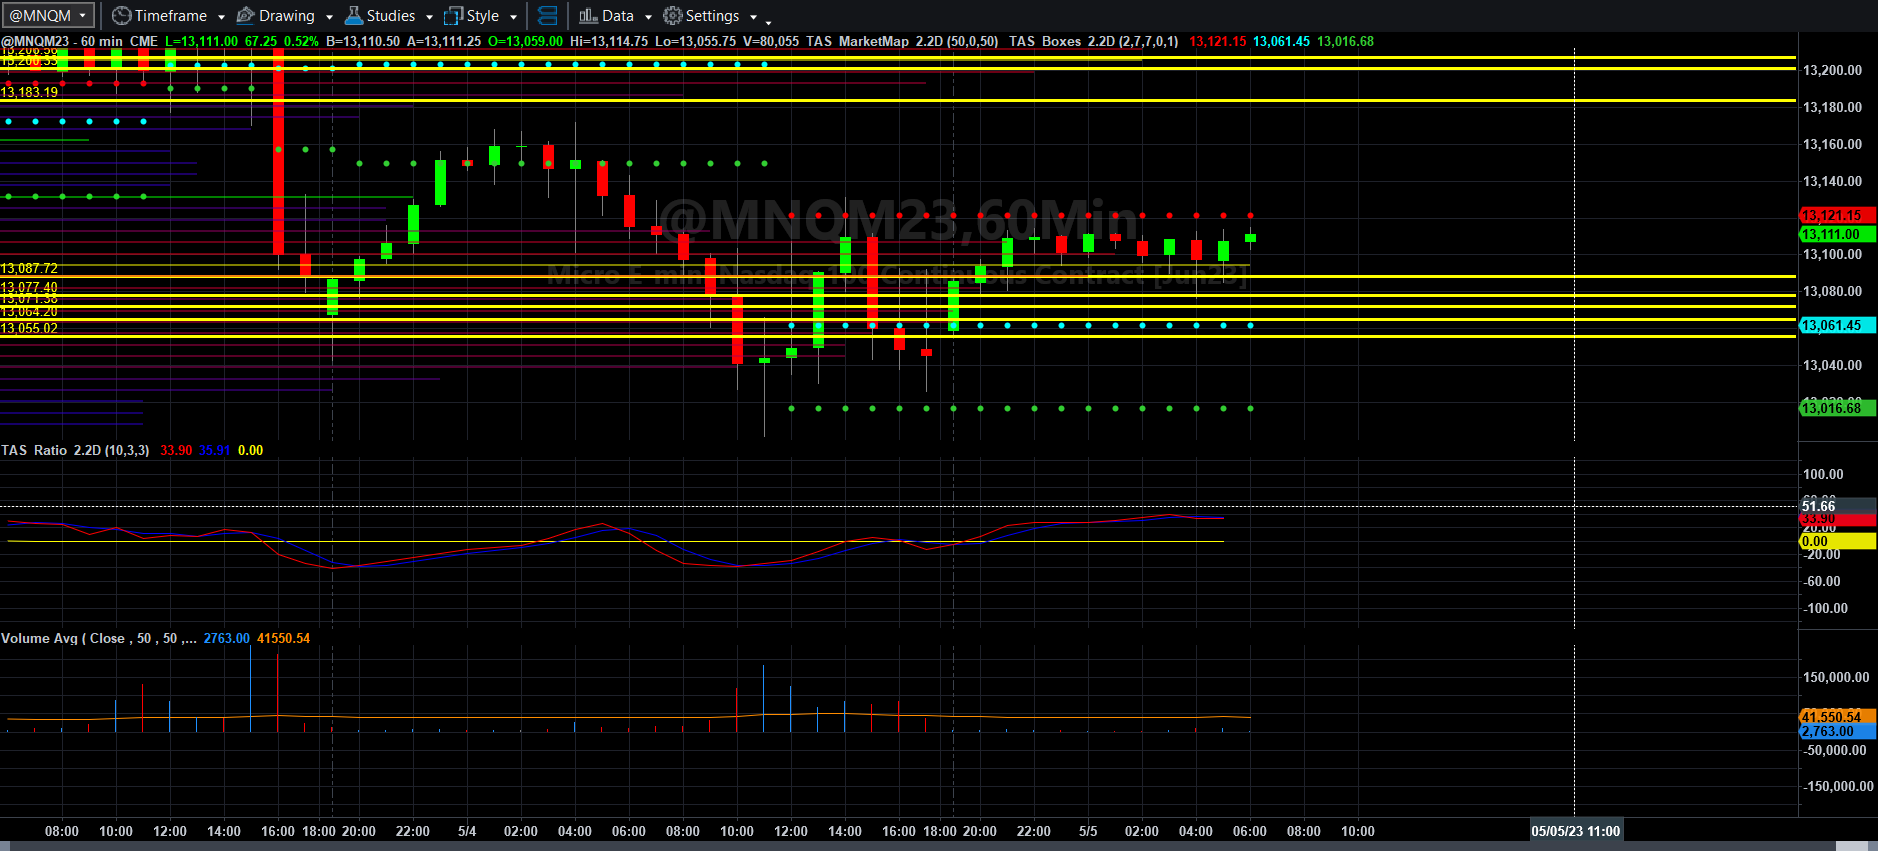
Price and Total Volume With 50-period Moving Volume Average
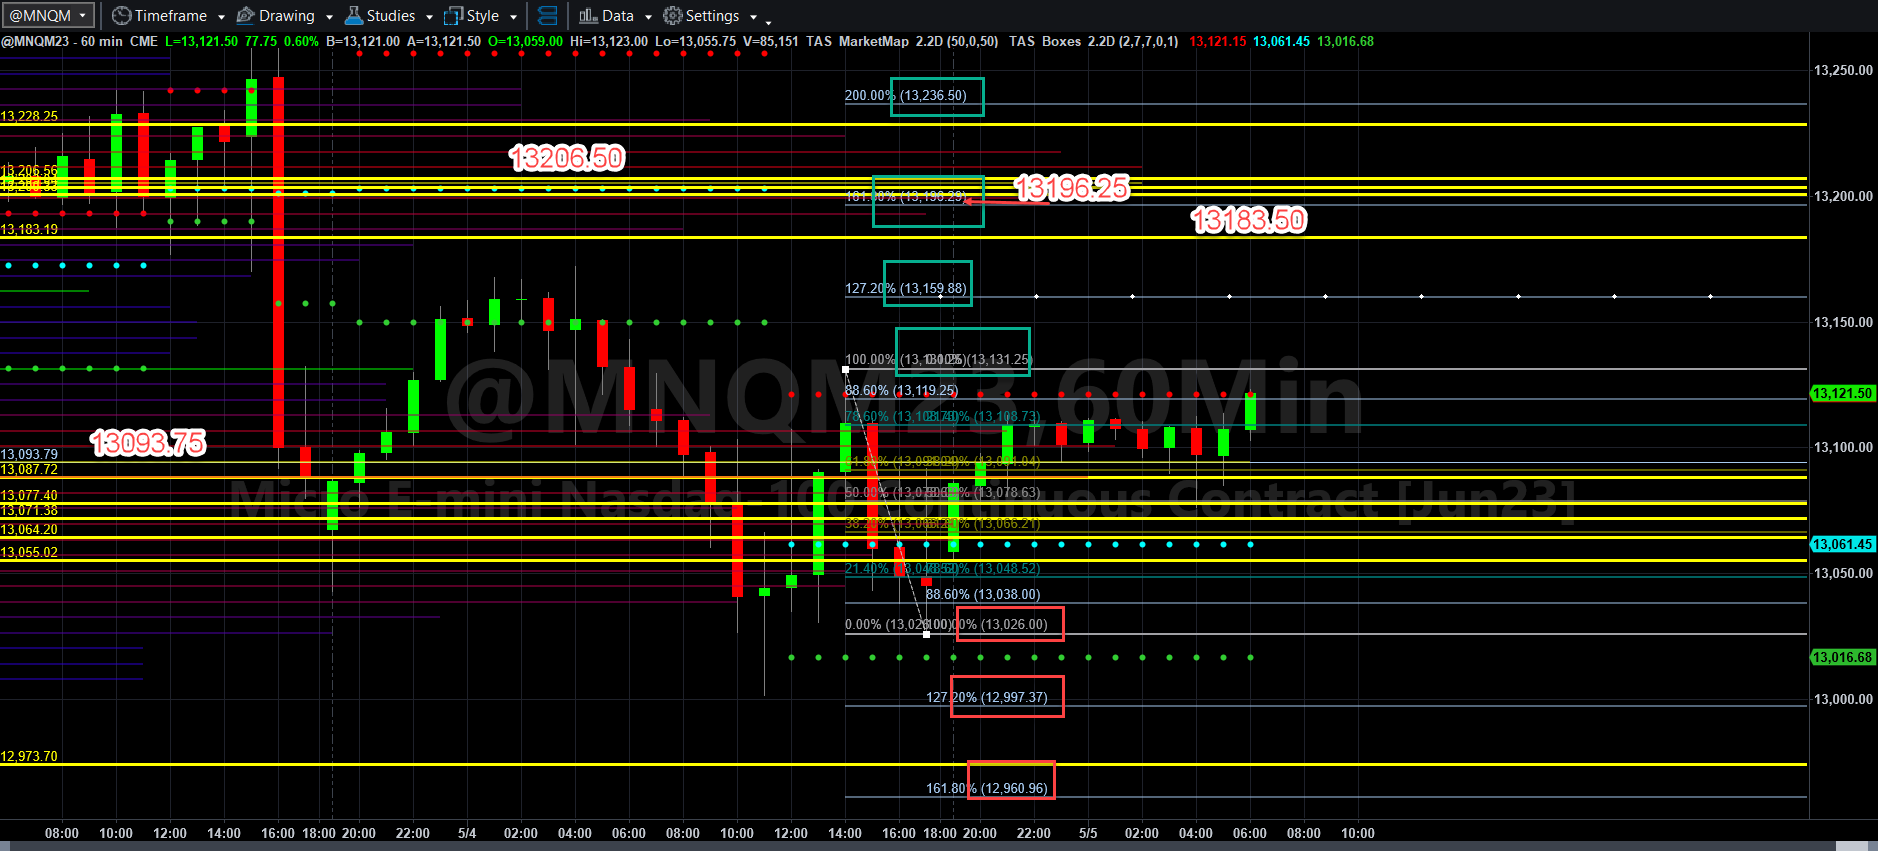
Fibonacci Price Scale With Targets
With all the fear around banking, rate policies, and Washington fiscal insanity, that news doesn’t hold back MNQM23 very long. Asia basically began purchasing at yesterday’s US close and Europe after a bit of a lull has continued that practice as the 0600 EDT hour approaches.
Will unemployment cast a pall on bullishness? Who knows? Will the retail and institutional hucksters bring the fun times back as may be indicated by this call to buy tech and gold? I think it best just to see where the opportunities are on the charts.
If MNQM23 can remain above 13093.75, 13131.25 and 13160 are possible 13196.50 is possible by next week, given the fact that traders may square up things for the weekend and rethink their stances for next week.
If not, MNQM23 probably dips back to as low as 13055 and if sellers get active, the price could fall below 13026 and back to 12996.25 or 12961 by early next week.
VXN has fallen of late, so volatility has lessened. Who knows if unemployment will bring volatility back? We won’t know until we see it, but that is why I extended the range of targets to capture the Fibonacci levels that were confluence with the VWAP lines.
I was able to pull out 24 NQ points long before the selling kicked in yesterday morning. If things get sloppy again with volume, I will sit on the sidelines and get other work done today.
I hope everyone has more money in their accounts that the end of today and that your Friday and weekend will be pleasant. More will be coming this weekend.
Thank you new subscribers for hopping on board. It may be a slow process, but I will do all I can to improve this Substack blog.
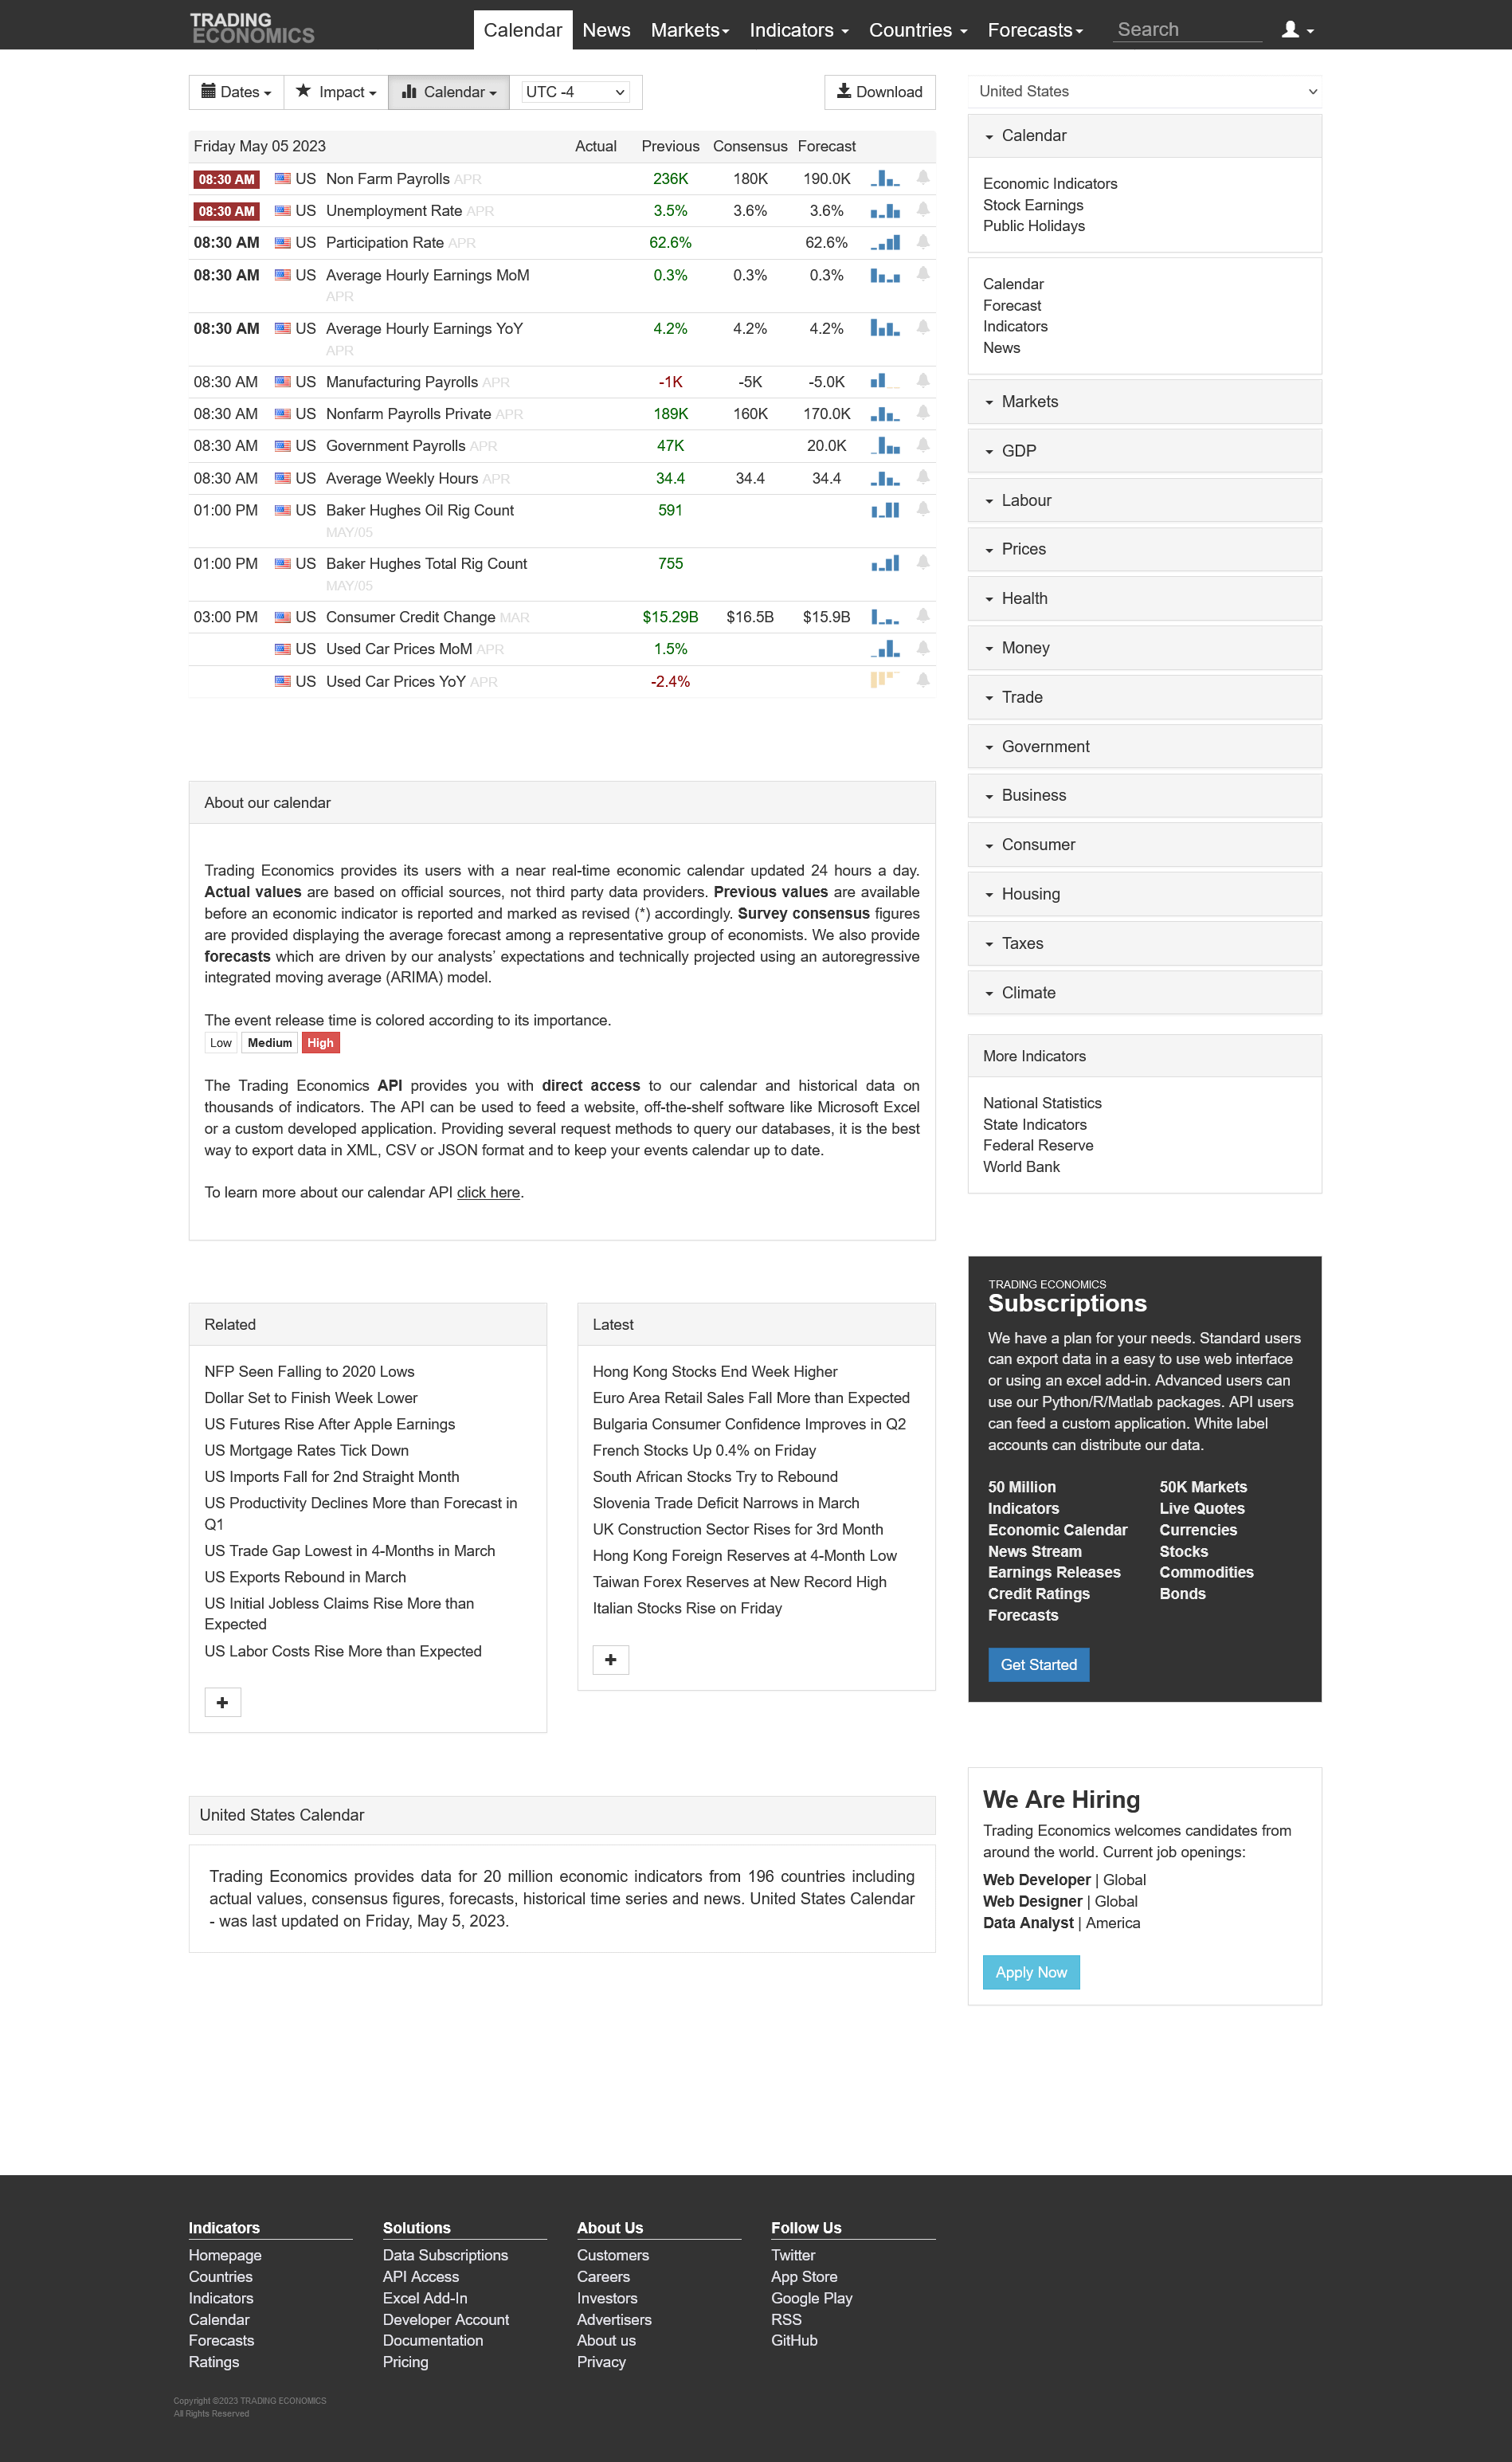
Today’s Economic Data Courtesy of Trading Economics dot com. Be sure to refresh the date at the top left.
Nice trend day for a change.