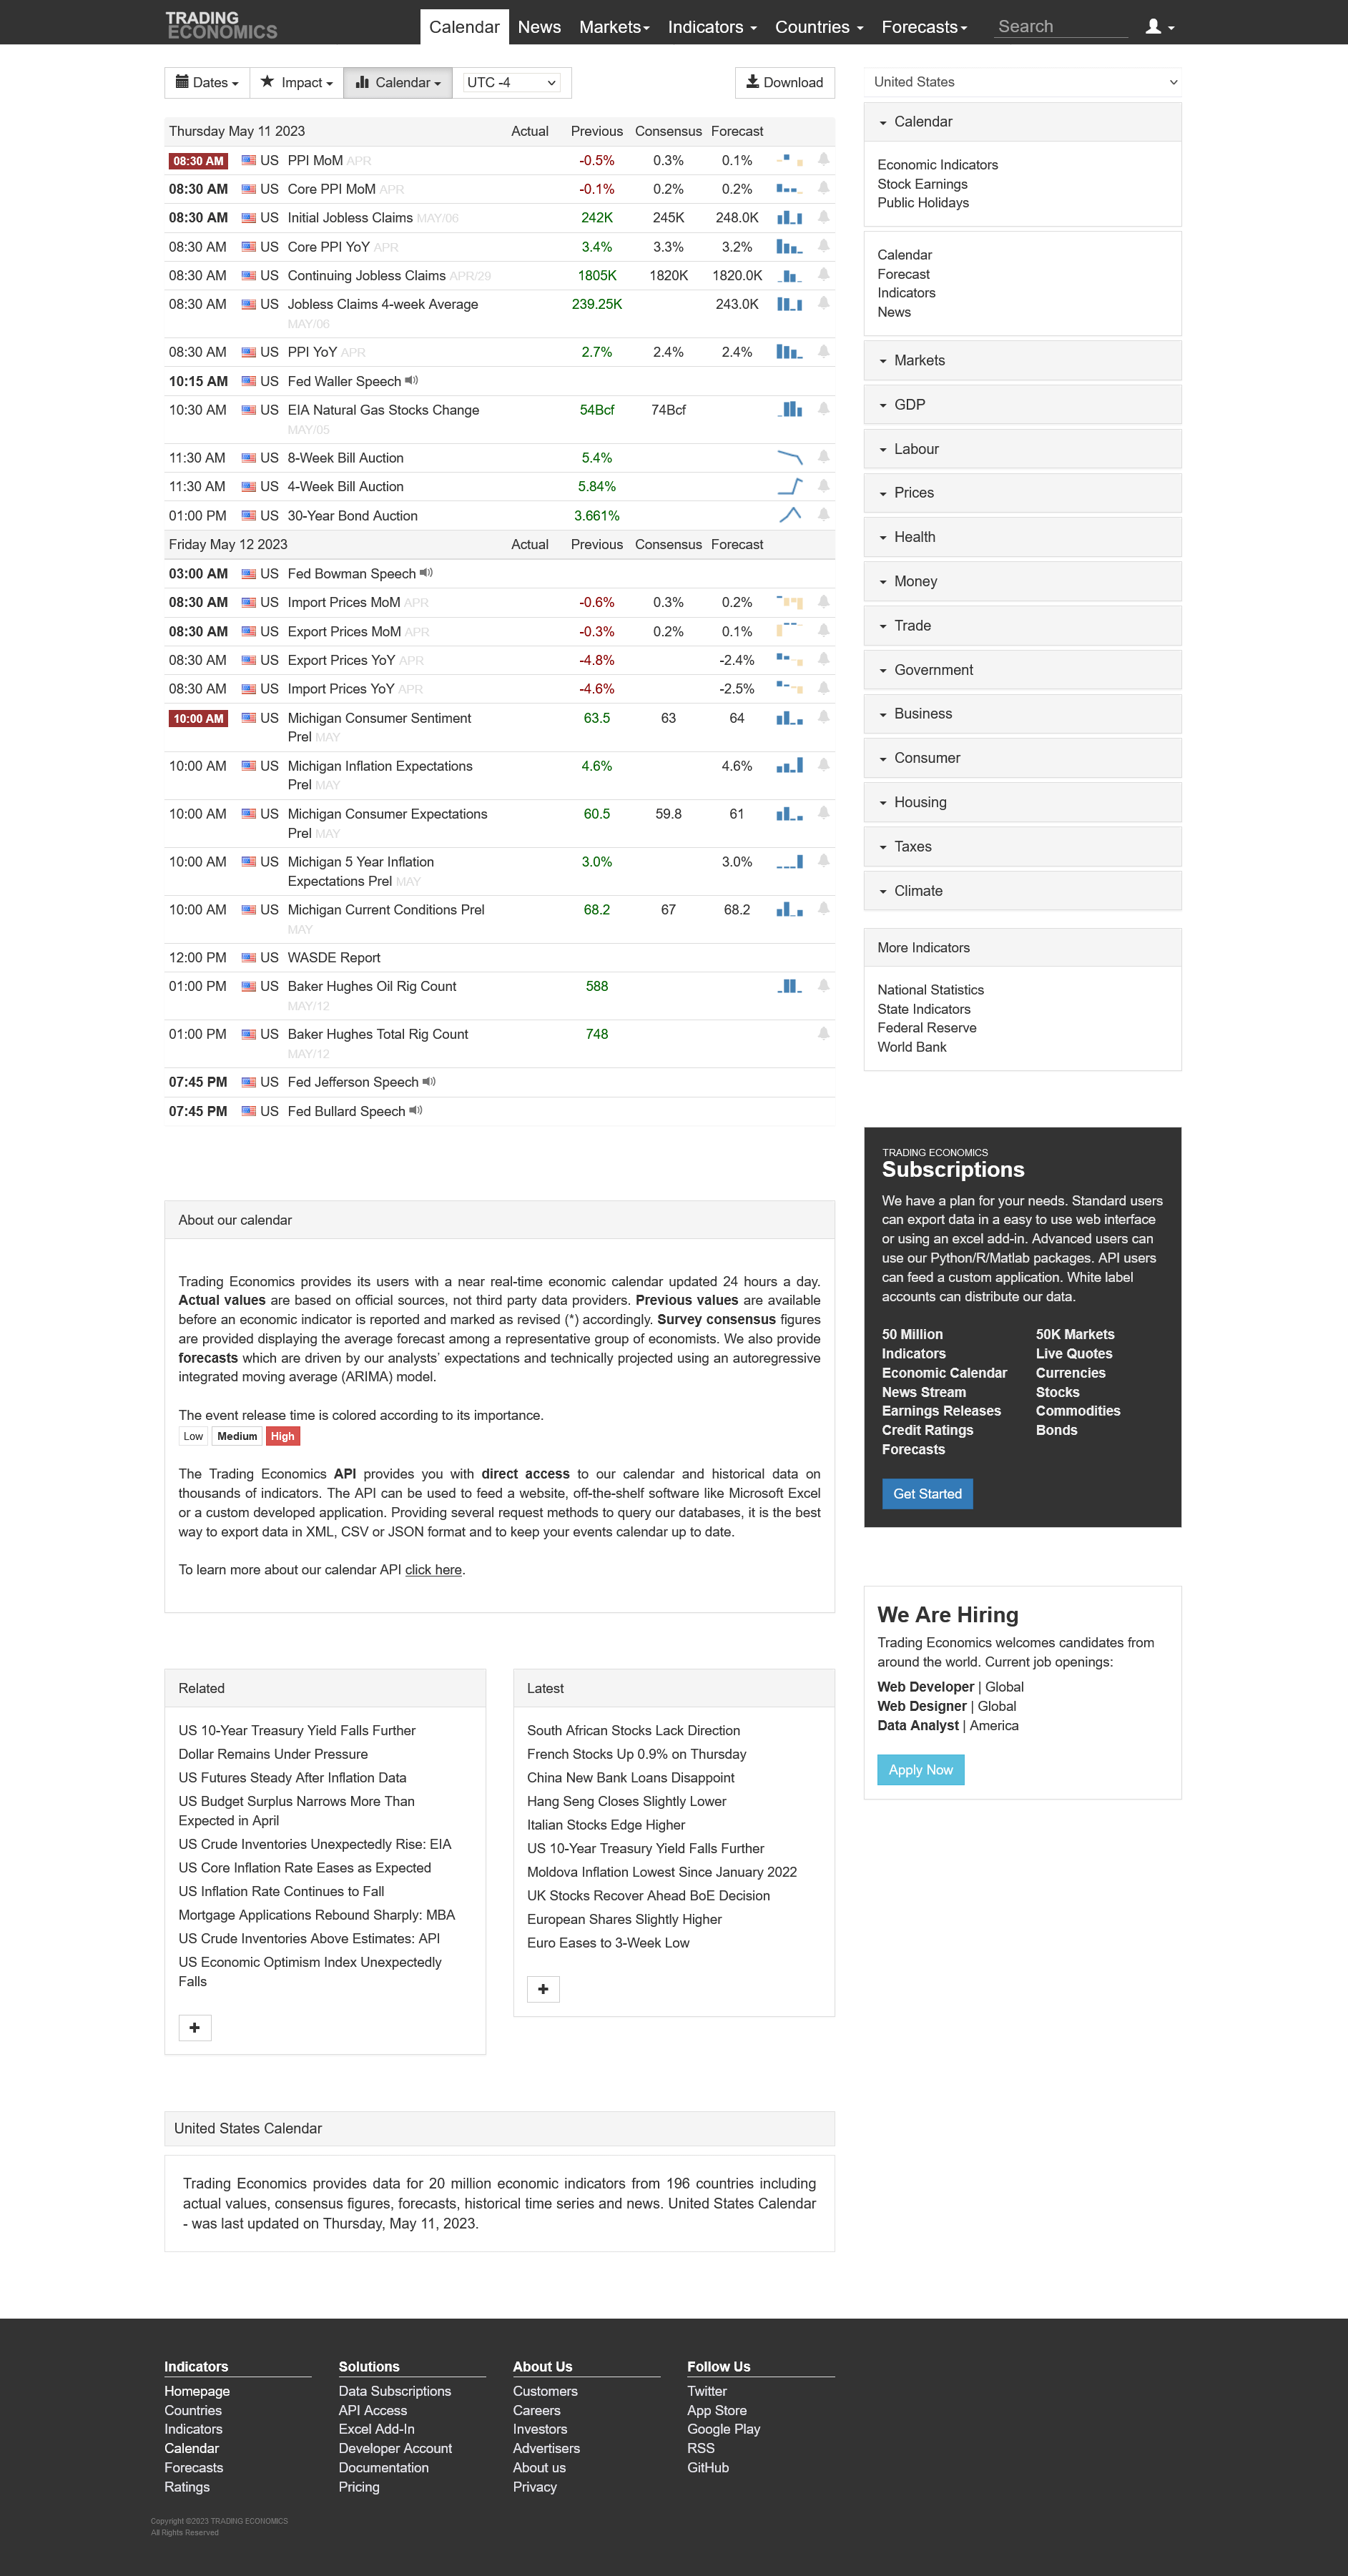
Price, Price Spread, Lagged Price/Volume Spread, and Binary Price/Volume Indicator
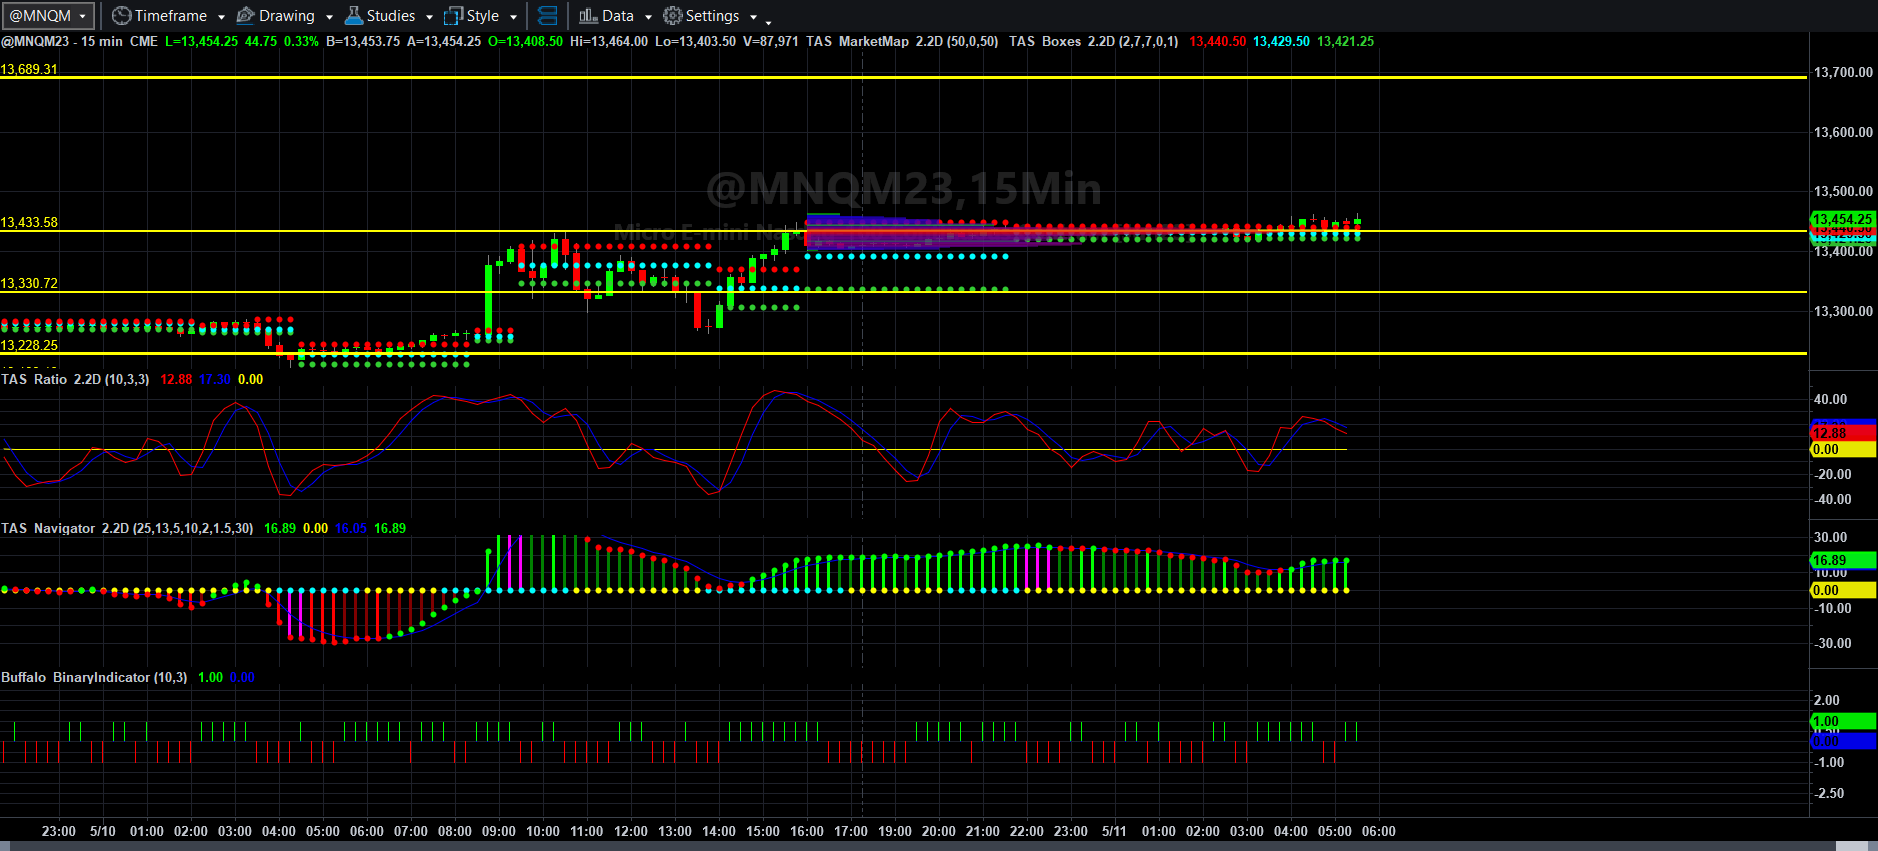
Price and Total Volume With 50-period Moving Volume Average
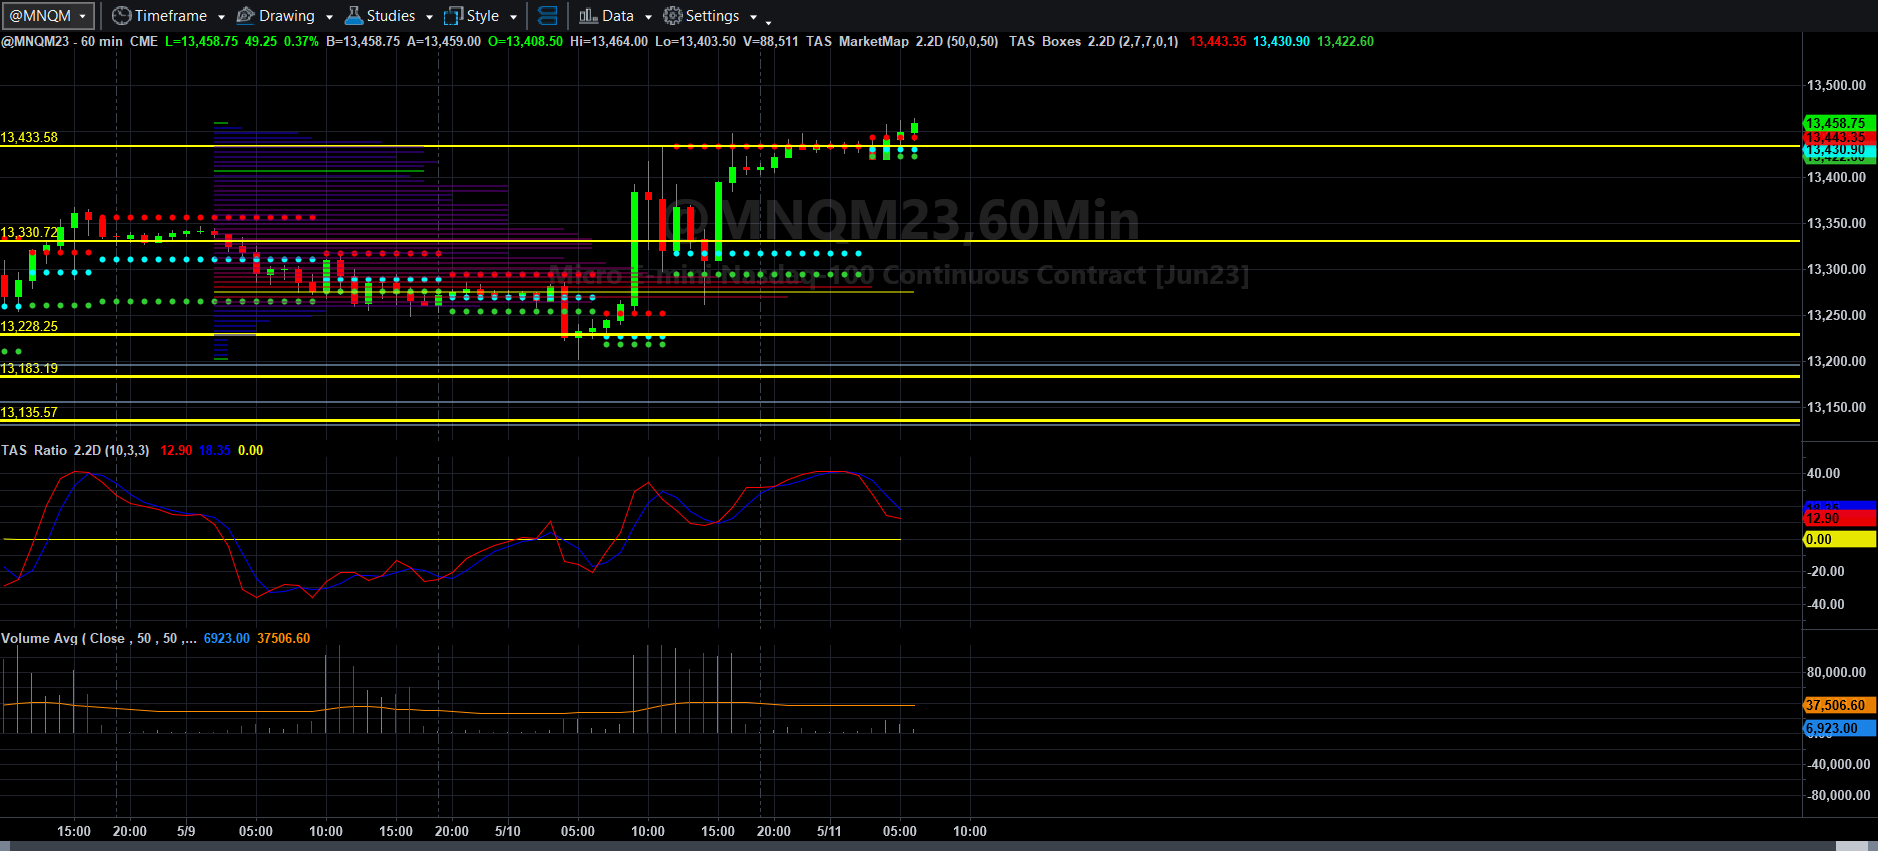
Fibonacci Price Scale With Targets
It looks as though Asia idled MNQM23 last night while Europe has just now begun buying again. Markets are still dealing with Yellen’s mumbling about how not raising the debt ceiling ruins American international leadership (while bankrupting its citizens, my take). Everyone else seems to think a rate pause is coming, which could just as well be the take of the day since no one really knows what is going on.
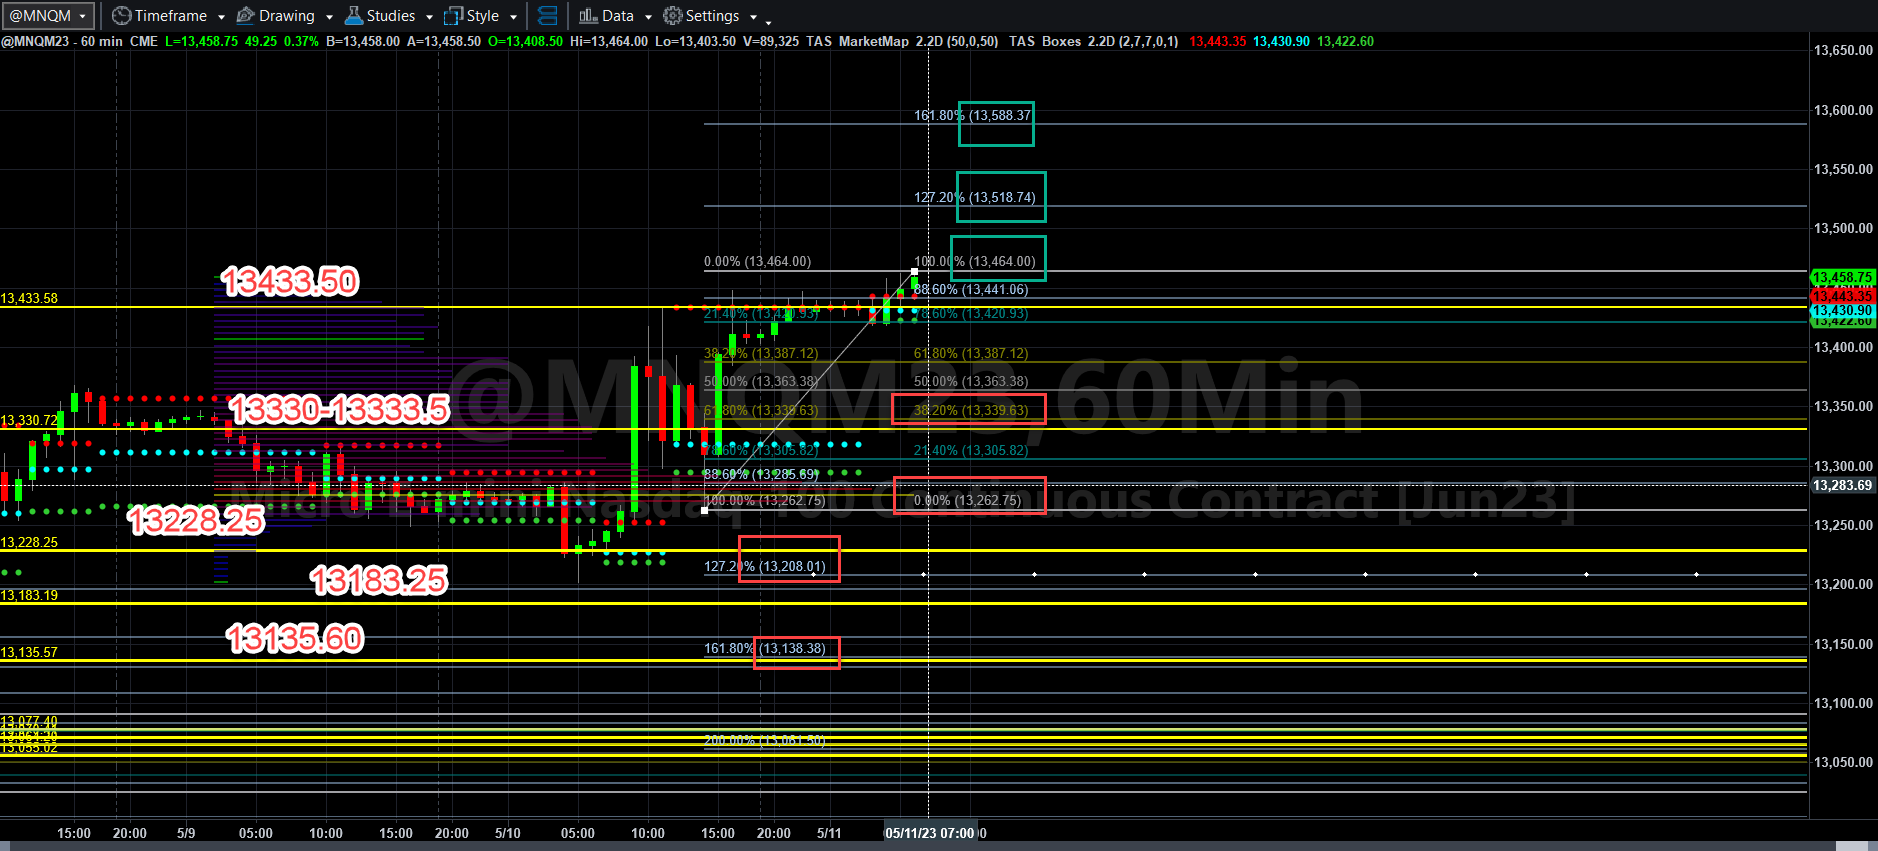
It’s just another day when traders may sit on pins and needles as they watch the PPI and jobless claims numbers hit at 0830 EDT. If there is no deflation or disinflation indicated in PPI, will that cause the bottom to drop out? Will larger-than-expected deflation or disinflation force this market to run to 13600 and beyond?
I am not going to speculate, I am just going to look at the charts.
If MNQM23 can remain above 13433.50, it has a good shot at taking out 13464 and perhaps 13518.75 and 13588.25 by Friday.
If MNQM23 cannot remain above 13433.50, you are looking at finding support around 13339.50, if that and VWAP lines around it are broken, 13262.75, 13208, and 13138.25 are possible by Friday.
The data may force the issue of direction, but I will simply line up the volume profile with expansion targets in either direction and see if price momentum and volume tell a similar story before I execute a trade.
Yesterday I picked up 31 NQ points per contract long on the top end of a spread trap I set at 0830 when the CPI data was released. There were three distinct swings one could have traded yesterday, but I had other things to do and I closed the long trade and left.
We will see what happens today. There is still a lot of uncertainty at the moment almost anywhere in the globe where markets trade. We will simply have to be flexible and keep our eyes open.
That is all I have for now. I hope you have a pleasant and profit-generating Thursday!
Today’s Economic Data Courtesy of Trading Economics dot com. Be sure to refresh the date at the top left.