

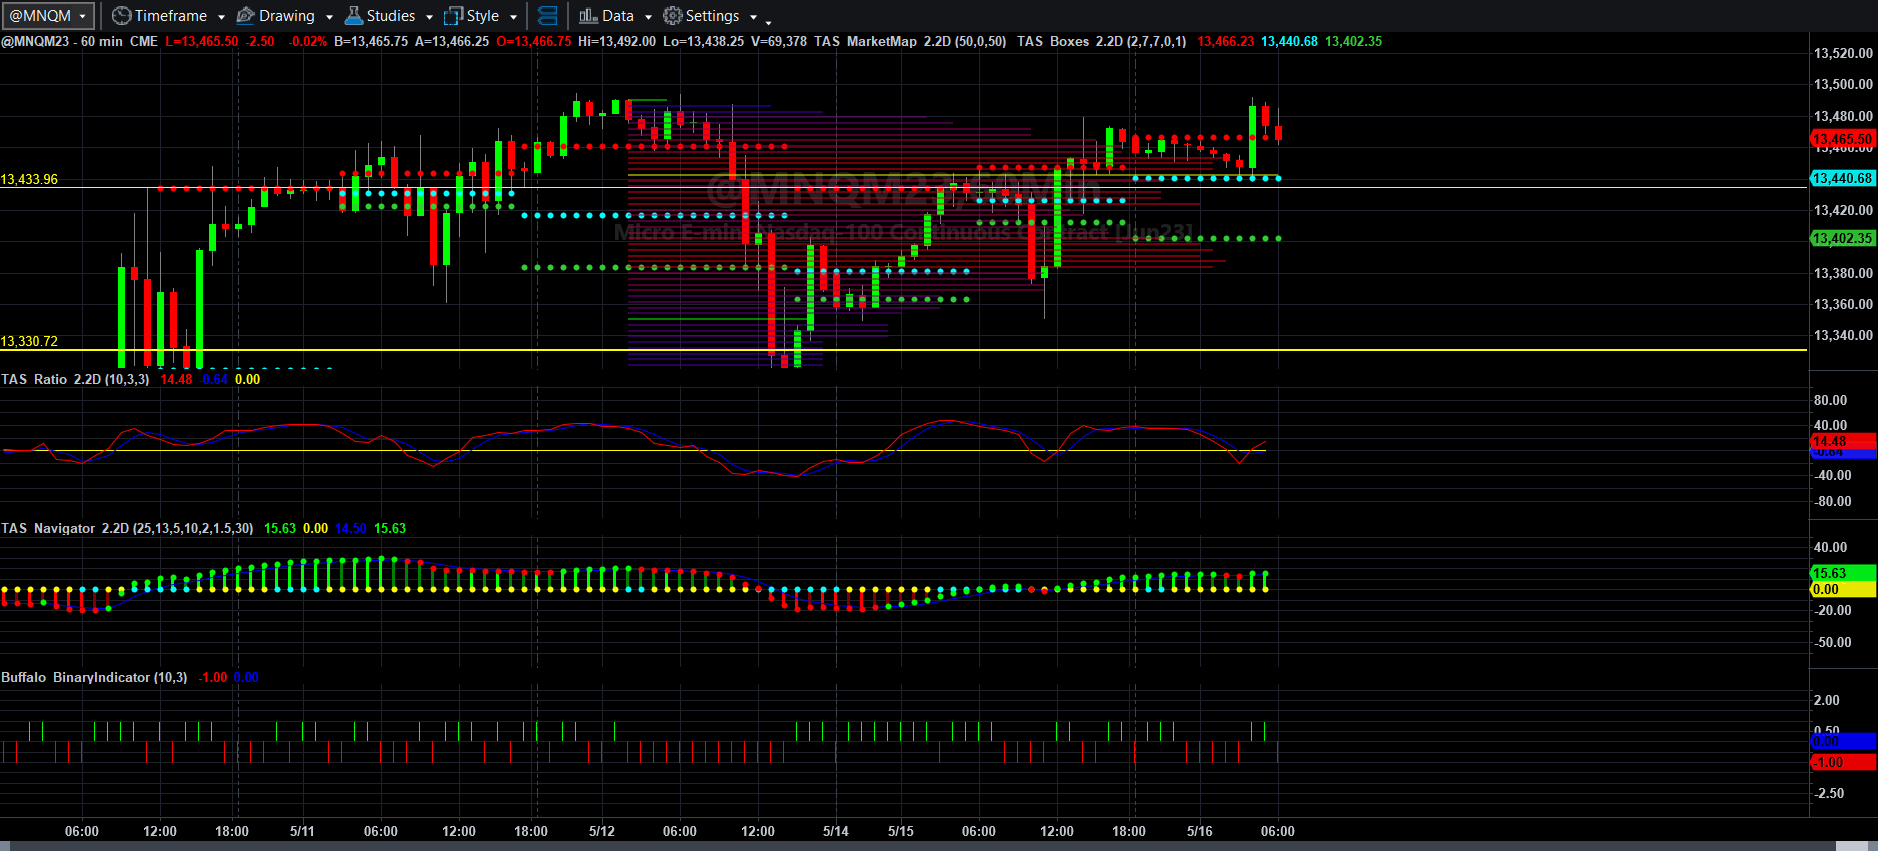
Price, Price Spread, Lagged Price/Volume Spread, and Binary Price/Volume Indicator
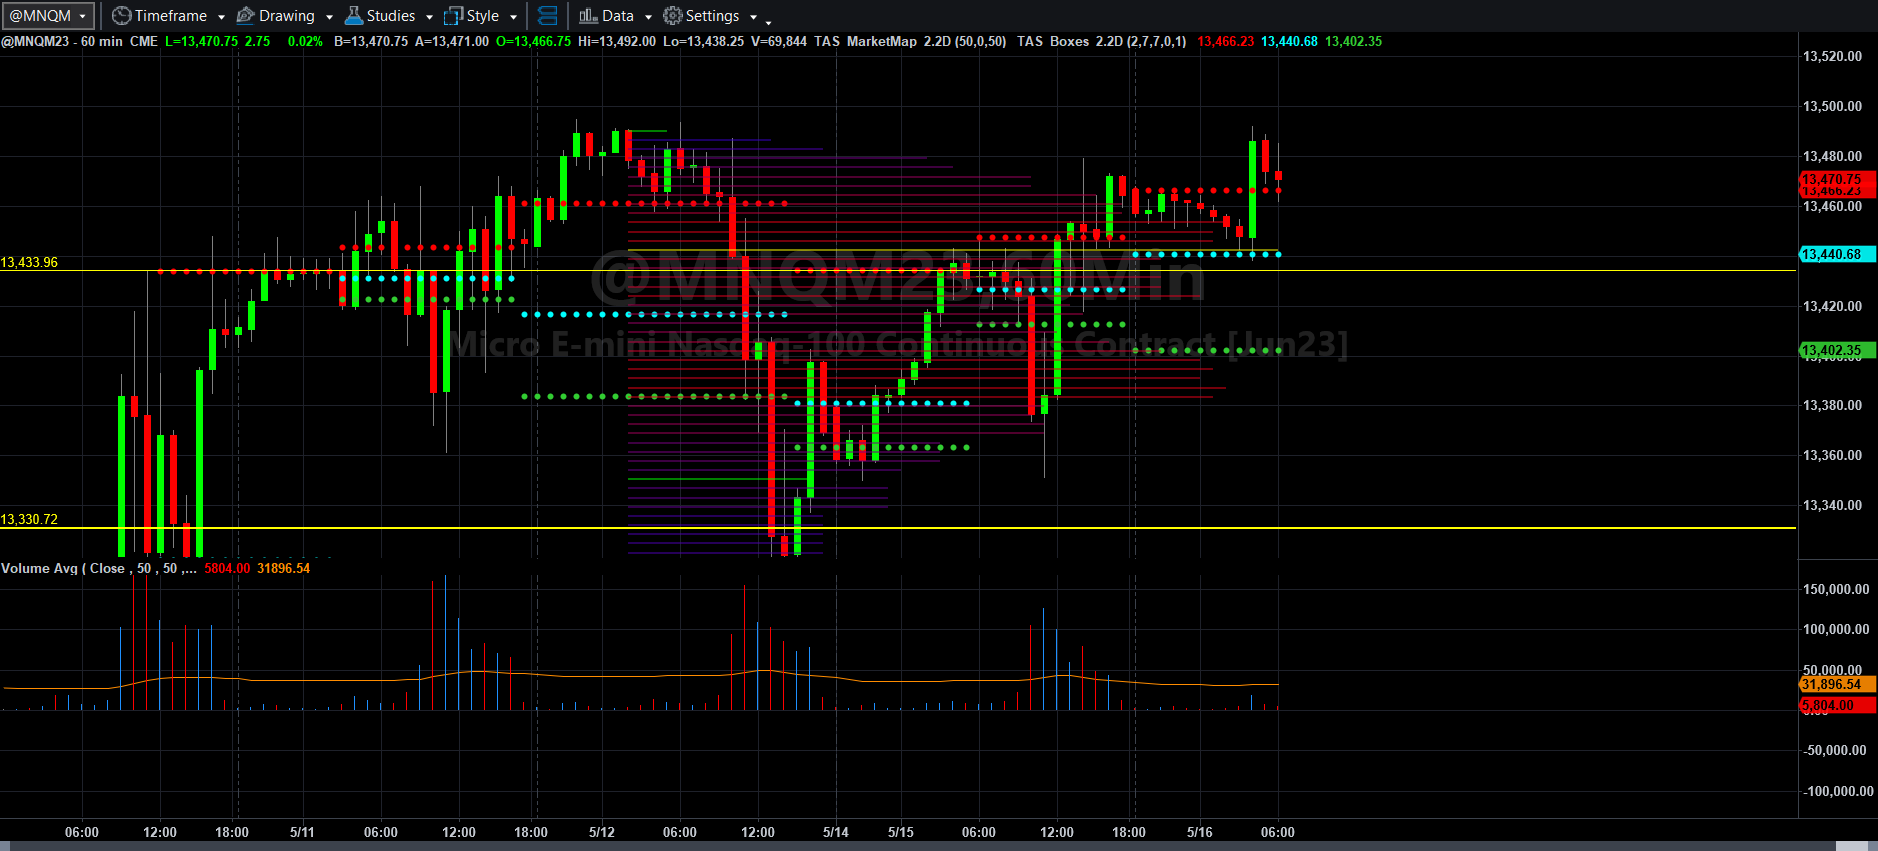
Price and Total Volume With 50-period Moving Volume Average
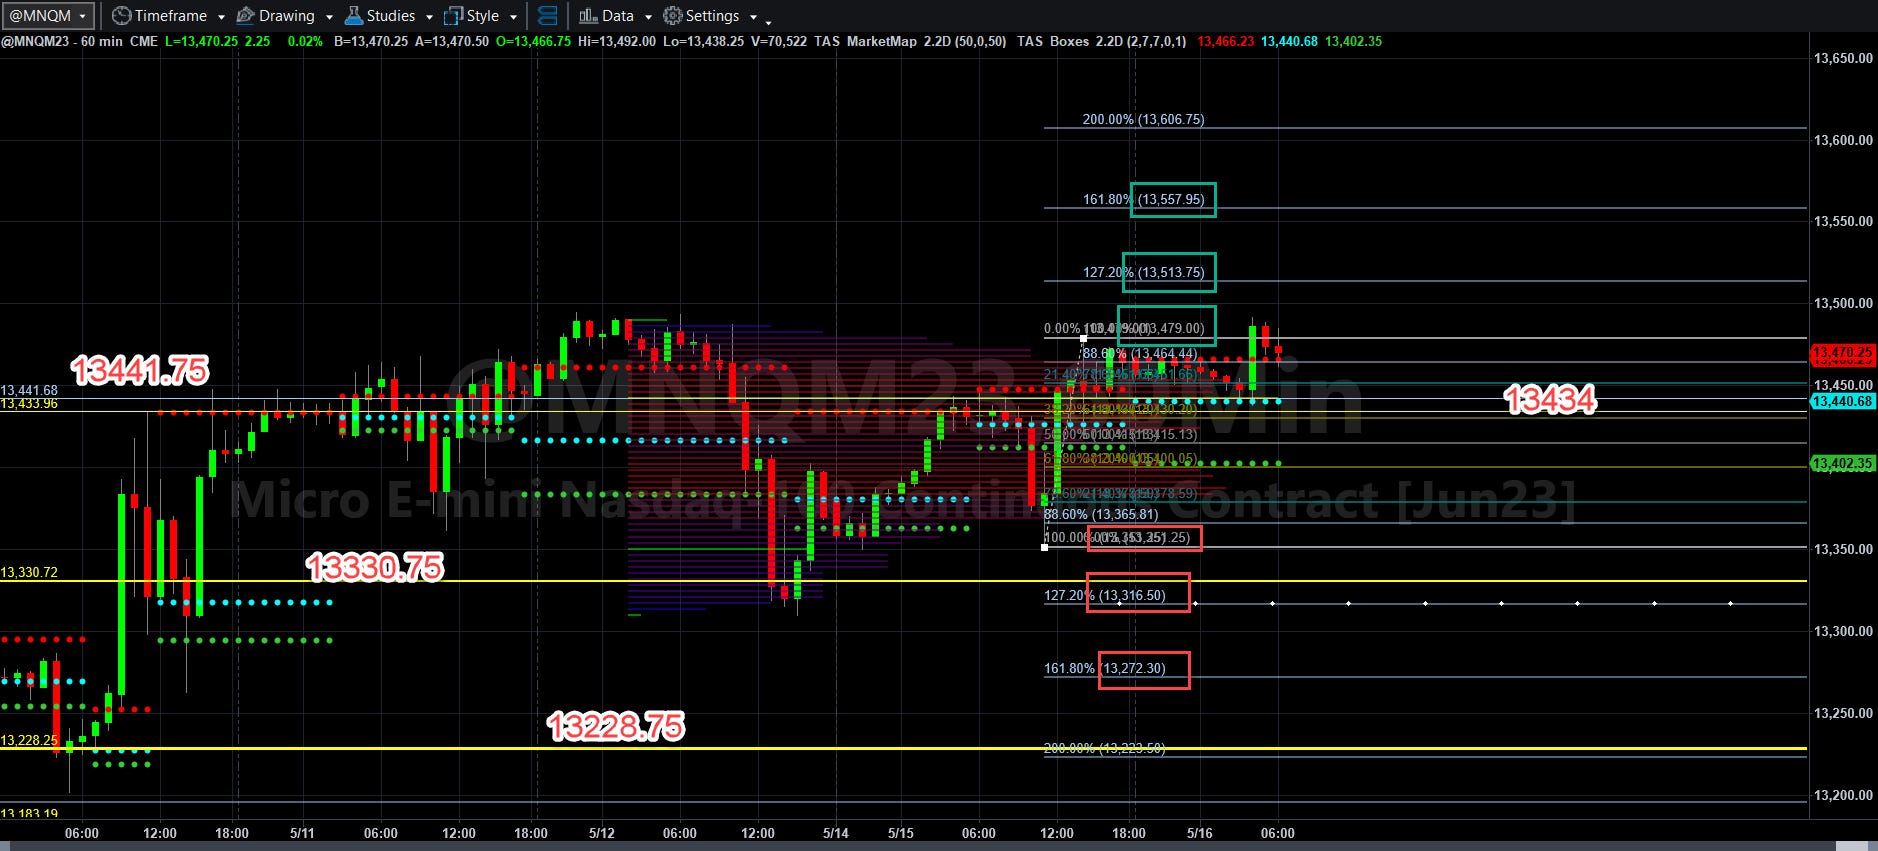
Fibonacci Price Scale With Targets
In the midst of employment changes, Federal fiscal malfeasance, and the main street American inflation that causes caution, no one really can be certain about coming economic conditions, perhaps but those economists and corporate leaders who caution that a slowdown is coming.
When confusion strikes, look at the charts.
Despite all of that, MNQM23 and other equity markets seem to press higher no matter what happens. The price structure support I mentioned yesterday was both hit by sellers and it held, which lead to an afternoon rally. After that, Asia and Europe seemed to pile on, and the rest is what you see in the late 0500 EDT to 0600 EDT market for MNQM23, a slightly overbought market that could be correcting just slightly. I used the previous upward price swing for the scale as it best represents the last major move in the market.
If MNQM23 remains above 13441.75, it has a shot at rallying strongly into previously held but now new highs of 13479, 13513.75, and 13557 and beyond over the next couple of days. If not, we probably go back through a fairly rapid (given the size of the green hourly candlestick price bars) back to 13351.25, and if sellers press the issue back to 13316.50 and 13272.25 over the next couple of days.
Will retail sales drive price action? I don’t know and no one else does either.
All I know is that yesterday, I coordinated hourly price chart action and volume with the 15-minute chart price action and volume and caught a 26 NQ point per contract profit short, and I walked off the playing (trading) field to do other business.
As volume on occasion has been erratic, I will continue this process until conditions change. It may result in fewer trades, but my goal is to trade and scale, so if I continue to win and gradually trade larger size, then I will still grow fast enough without breaks for losses. That works for me.
Today’s Economic Data Courtesy of Trading Economics dot com. Be sure to refresh the date at the top left.
