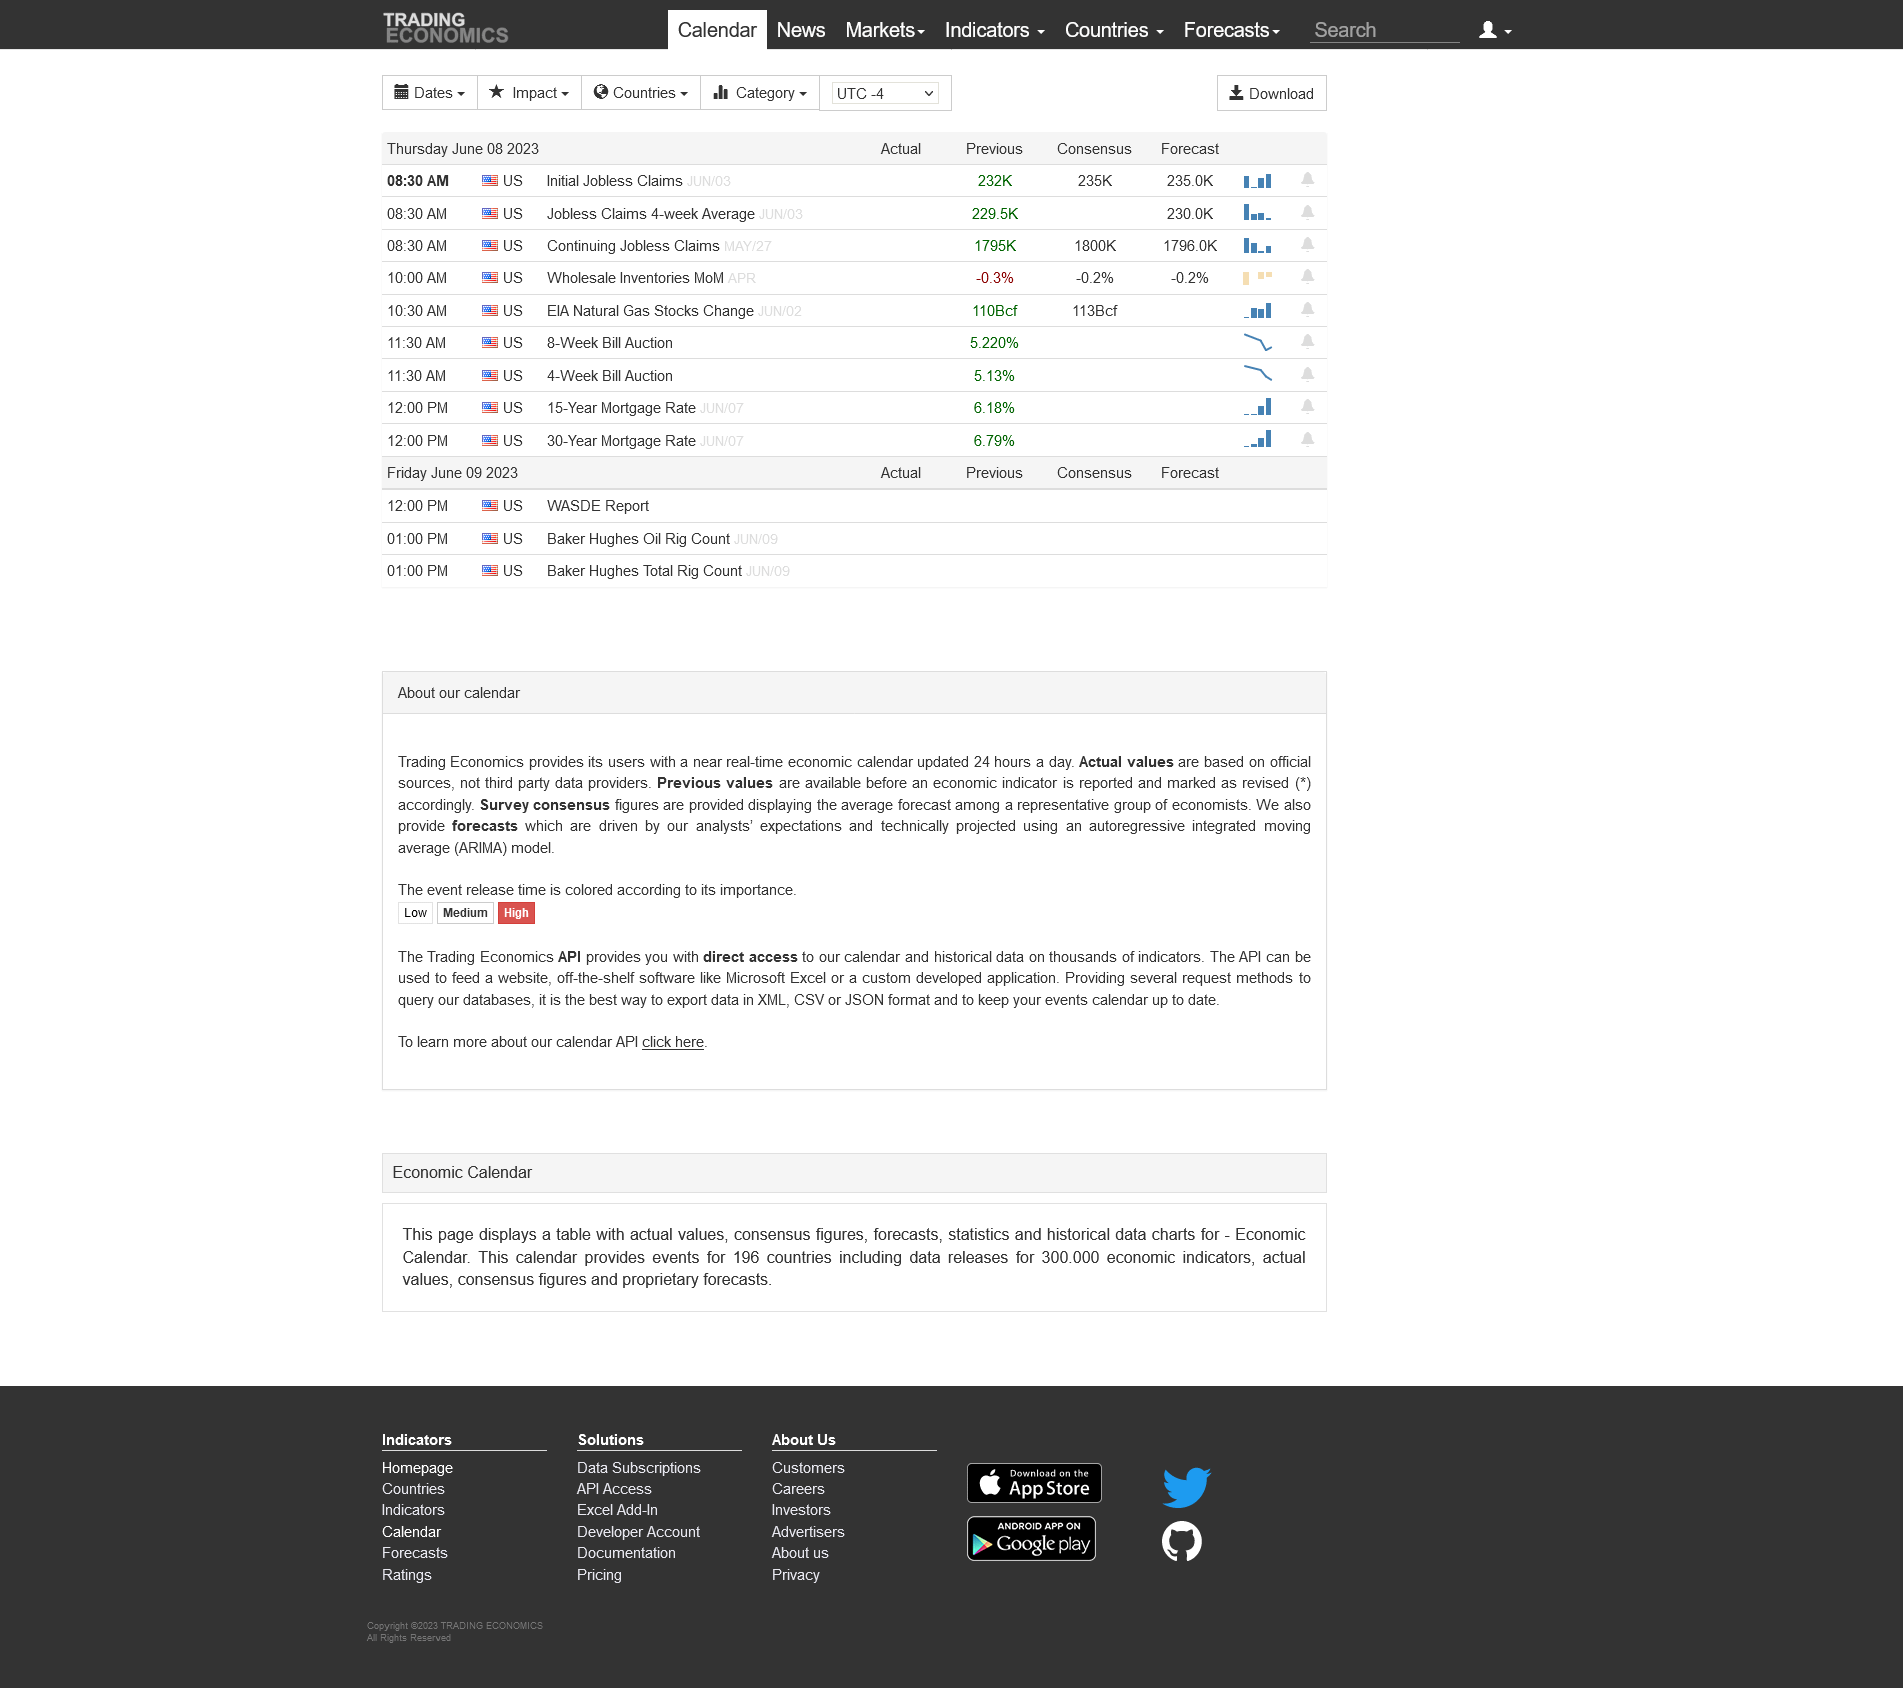
Price, Price Spread, Lagged Price/Volume Spread, and Binary Price/Volume Indicator
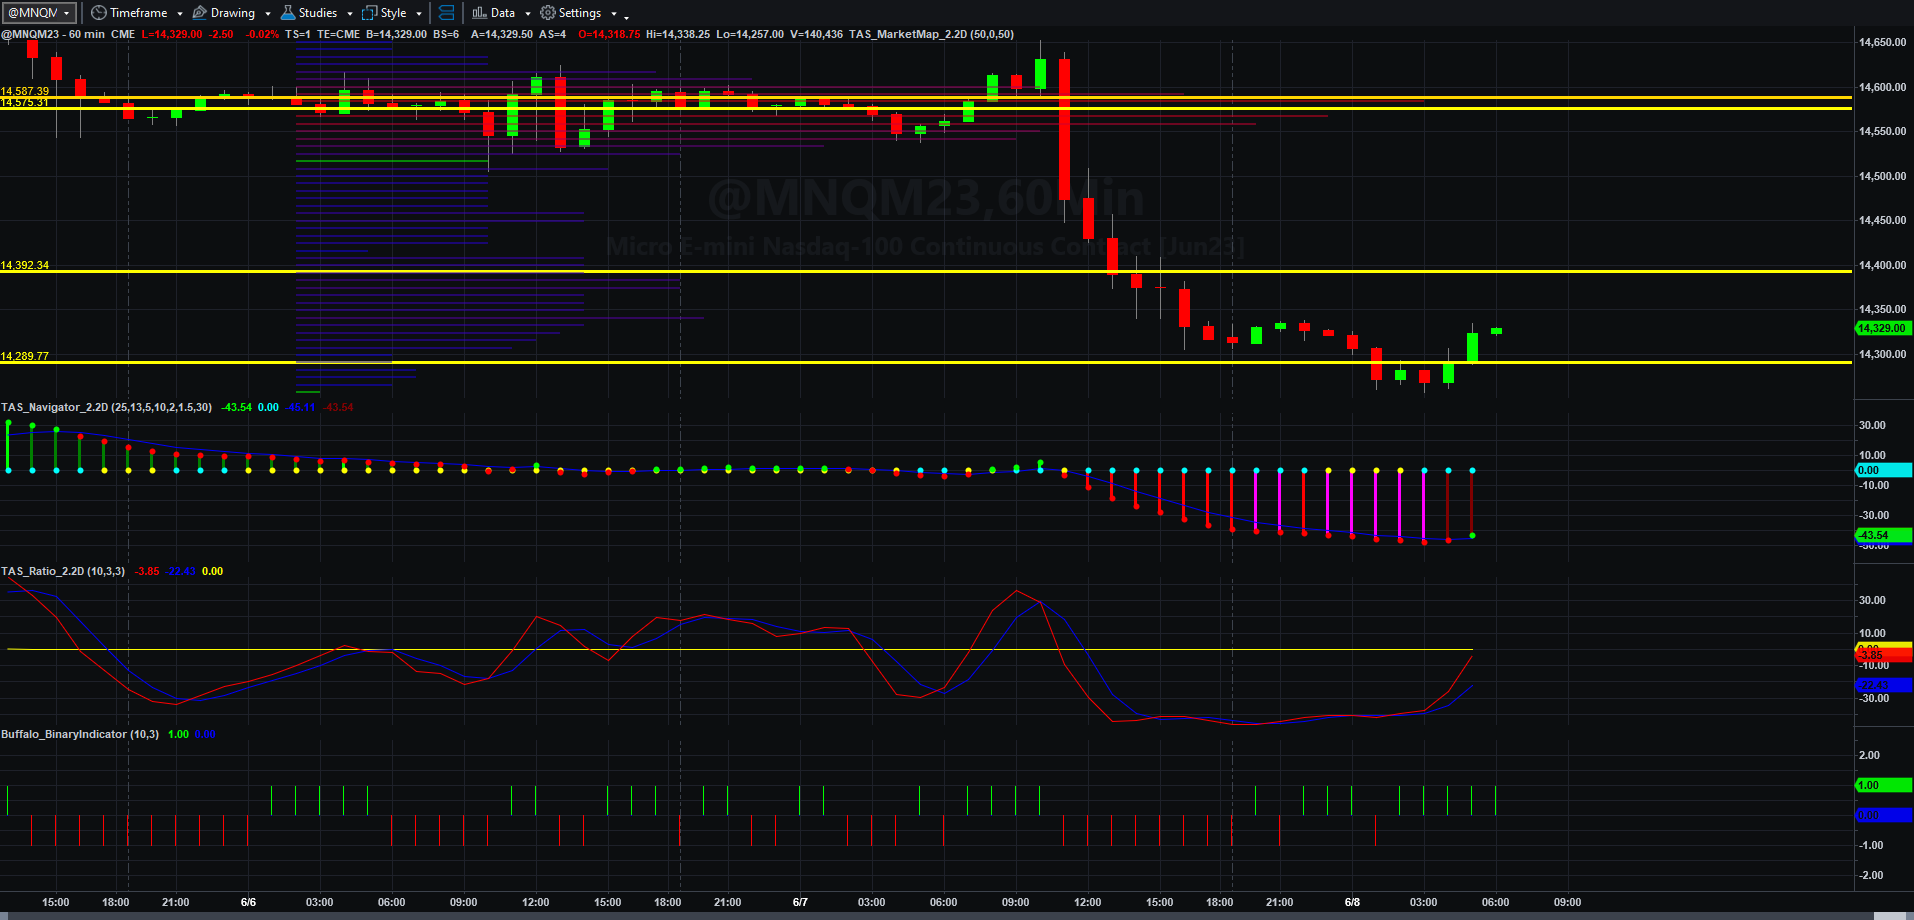
Price and Total Volume With 50-period Moving Volume Average
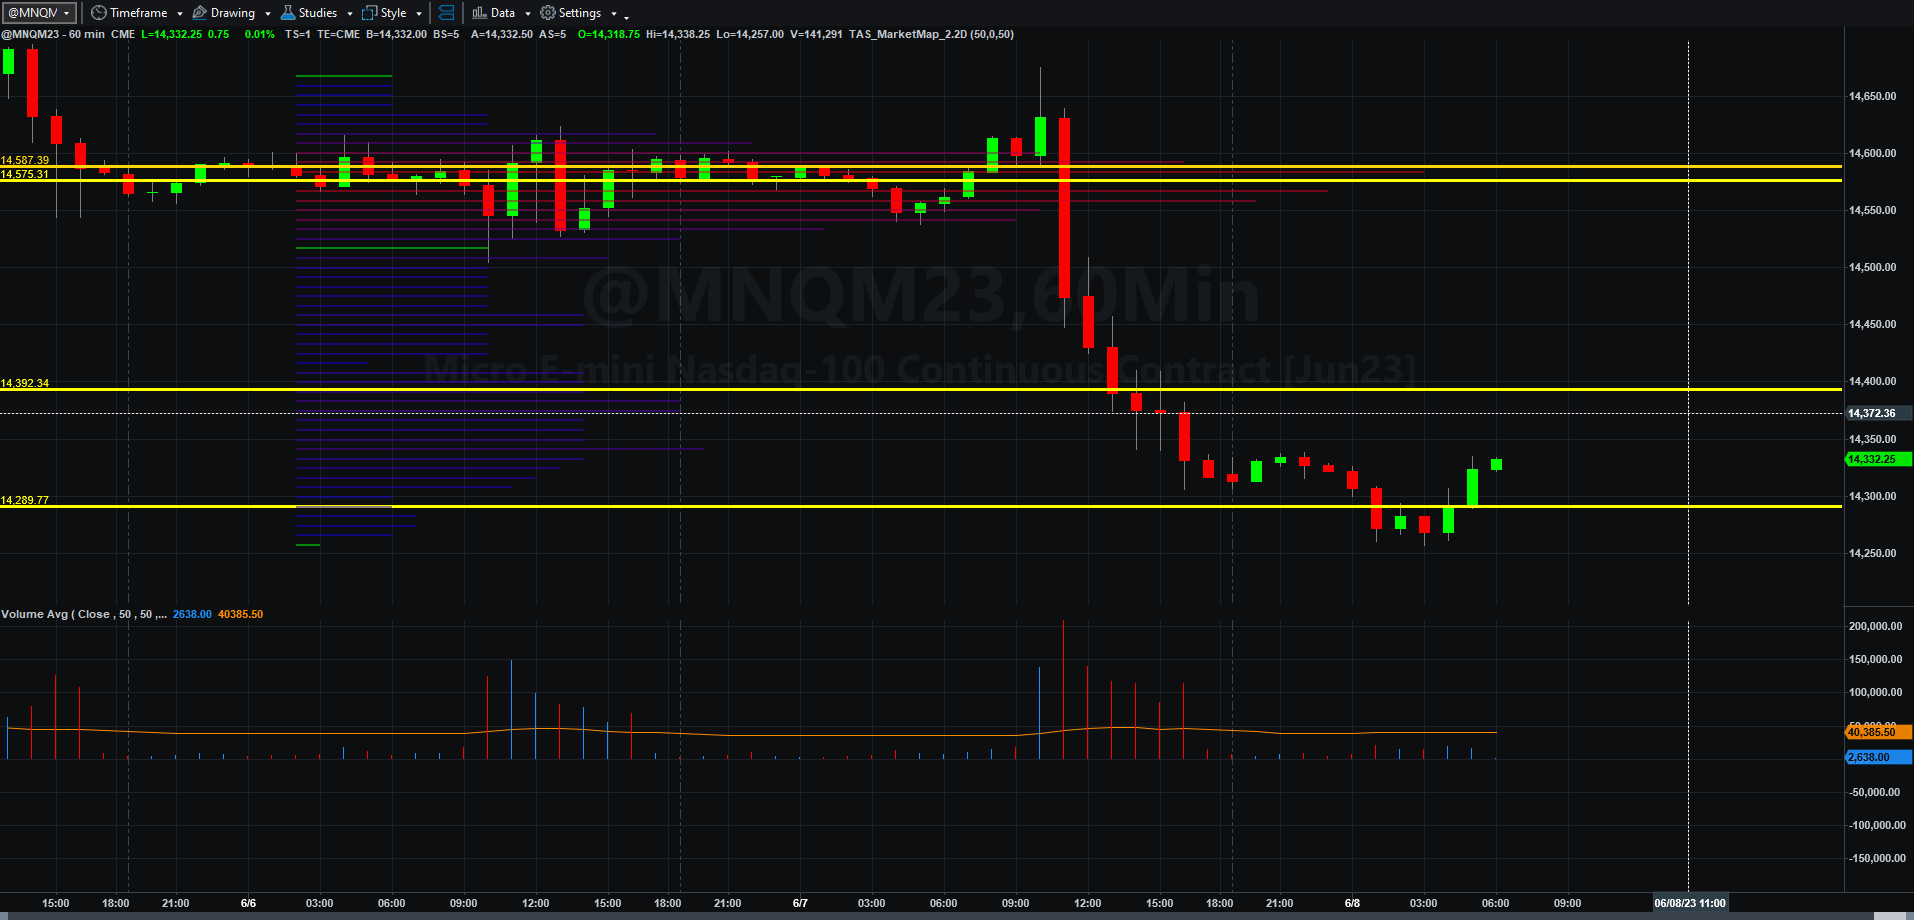
Fibonacci Price Scale With Target
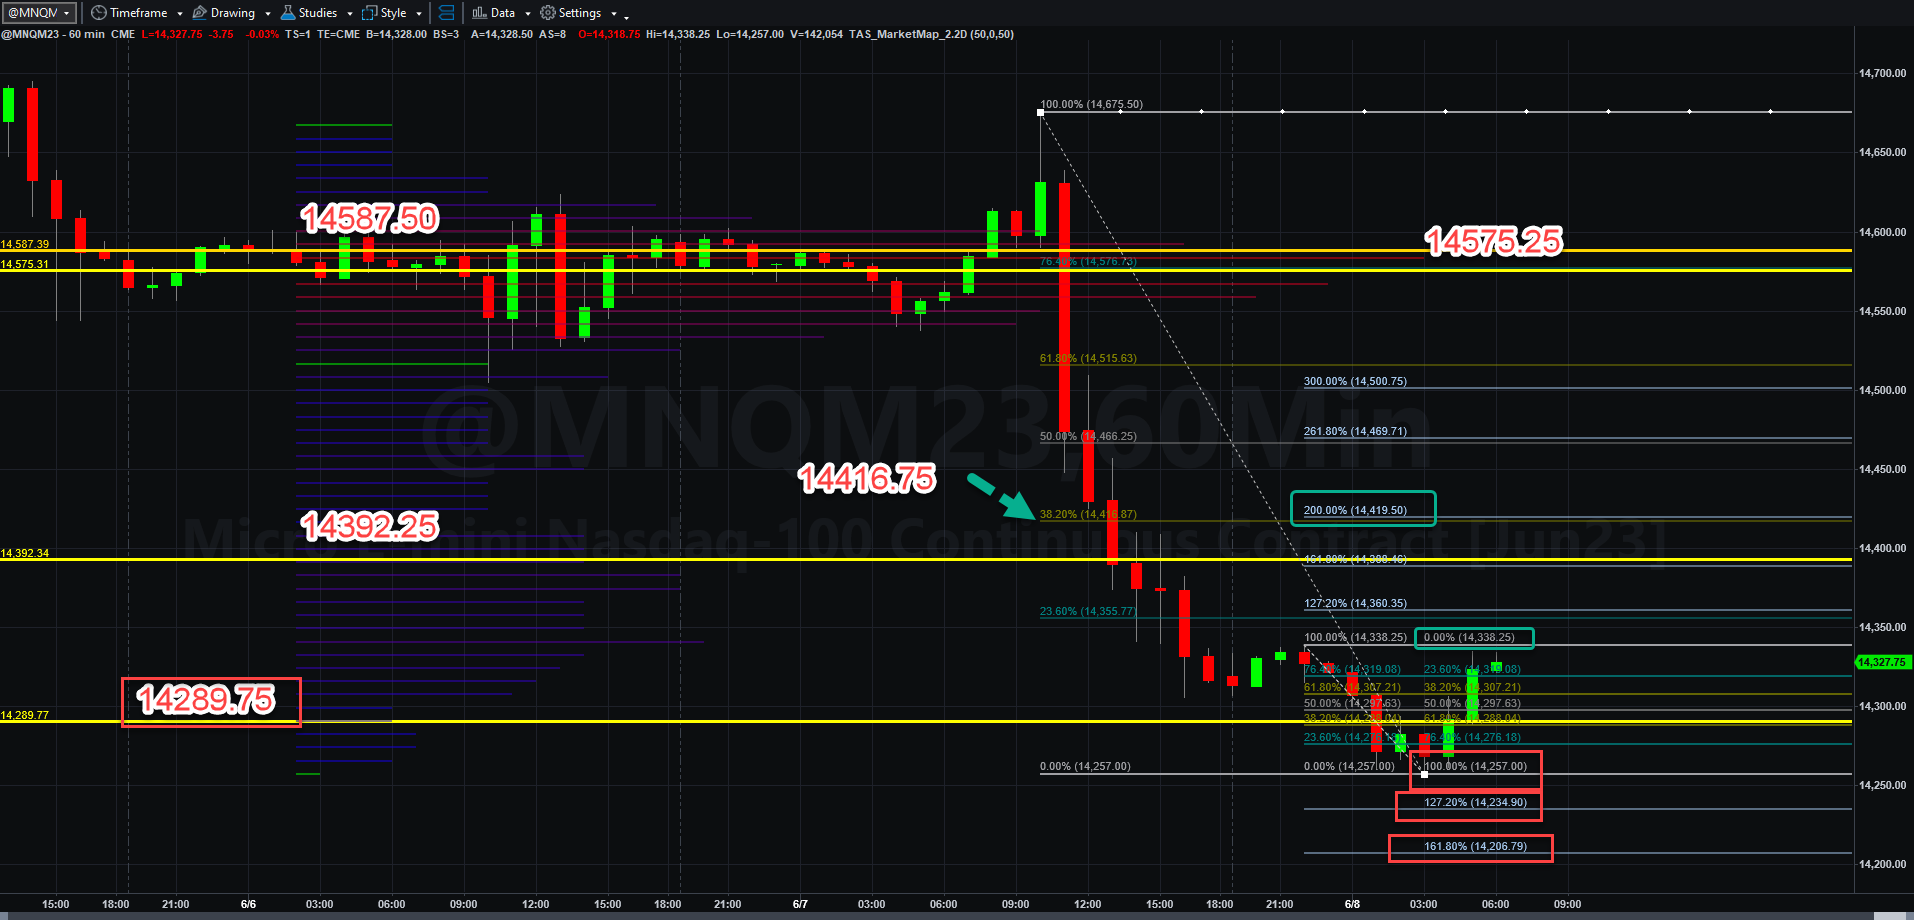
The interest rate fear factor (which this time does seem to carry legitimacy worldwide), continues to roil equity markets as we moved into Thursday. Bond traders are trying to protect equity worldwide, as it appears (whether actually or not) that the Fed will raise rates again next week, putting banks and income seekers deeper into the coffin corner (the place where rates need to rise to stop runaway ground level consumer inflation GOING FORWARD IN TIME, and the point at which an “everything bubble” ( real estate, commerical and residential, stocks, bonds, derivatives, insurance products, you name it) finally pops. I will not repost the Doc Brown quote, but the shirt could indeed be ready to hit the fern, to use a kind rewording of a vulgar analogy. I am not exactly an acolyte of Elon Musk, but his warnings about commercial real estate and banking I personally think are legitimate. I could go elsewhere with comments about Mr. Musk, but I think its time to look at the charts.
Overnight, latent Asian selling of the U.S. selloff and Europe seems to have bought the bottom just under 14289 and has a rallay going, even though hourly price spread and volume momentum are still negative. The swing level I chose was the smallest on that hourly chart, but that does encapsulate the VWAP lines pretty well.
It we remain above 14289.75 then MNQM23 has a shot at rallying through 14338.75 (which it already has) and will continue to 14360.25 to 14388.50 and beyond. The second Fibonacci scale encompassing the entire high low range of the last session lines up between 14392.25 and 14416.75 which is a 38.2% retracement of the last downturn. As it lines up against VWAP price resistance, and area could a natural rally limiting point if buyers lose momentum. Will price stall there? I don’t know, but one needs to be aware that the outcome that ends there could be a distinct possibility.
All of what I said above can happen in the next two days. Yesterday proved that even wide ranges CAN be blown apart by news, which in fact they were.
If the rally fails, then it would be a short trip back to 14257, and sellers could find lows at 14235 or even 14206.75 or lower in the next couple of days.
Nobody knows what will happen, but there is a ton of room in price action that could happen on either side. I picked up 27 NQ points long yesterday before the shart reveral hit, and though I missed yet another trend day to take care of business in other areas, I did find a good long entry with a rational target and took some money home.
That is all for now. Have a pleasant the productive Thursday everyone!
Today’s Economic Data Courtesy of Trading Economics dot com. Be sure to refresh the date at the top left.