

I basically performed a bit of mea culpa today, as (which can be seen from the video today), there is little change from the estimated targets of last week in MQNM23.
As you will see in the video, selling volume in both the monthly and weekly charts intensified, but price, net-net, really headed nowhere. There is a look at what Bollinger Bands tell you about trends (3:01) and a longer discussion of what weekly charts tell you (5:43).
I did not spend any time at all on the daily chart (presented below), but it could be showing a bit of strength (in terms of price trend) and simultaneous weakness (bearishness) in volume at last week’s end. If MNQM23 can hold above 12733.25 and 13173, then it has a shot back to 13330.50 and beyond. If not, it could pull back even as far as 11806 or even as far as 11386. Again, it all depends on who shows up in the next couple of weeks.
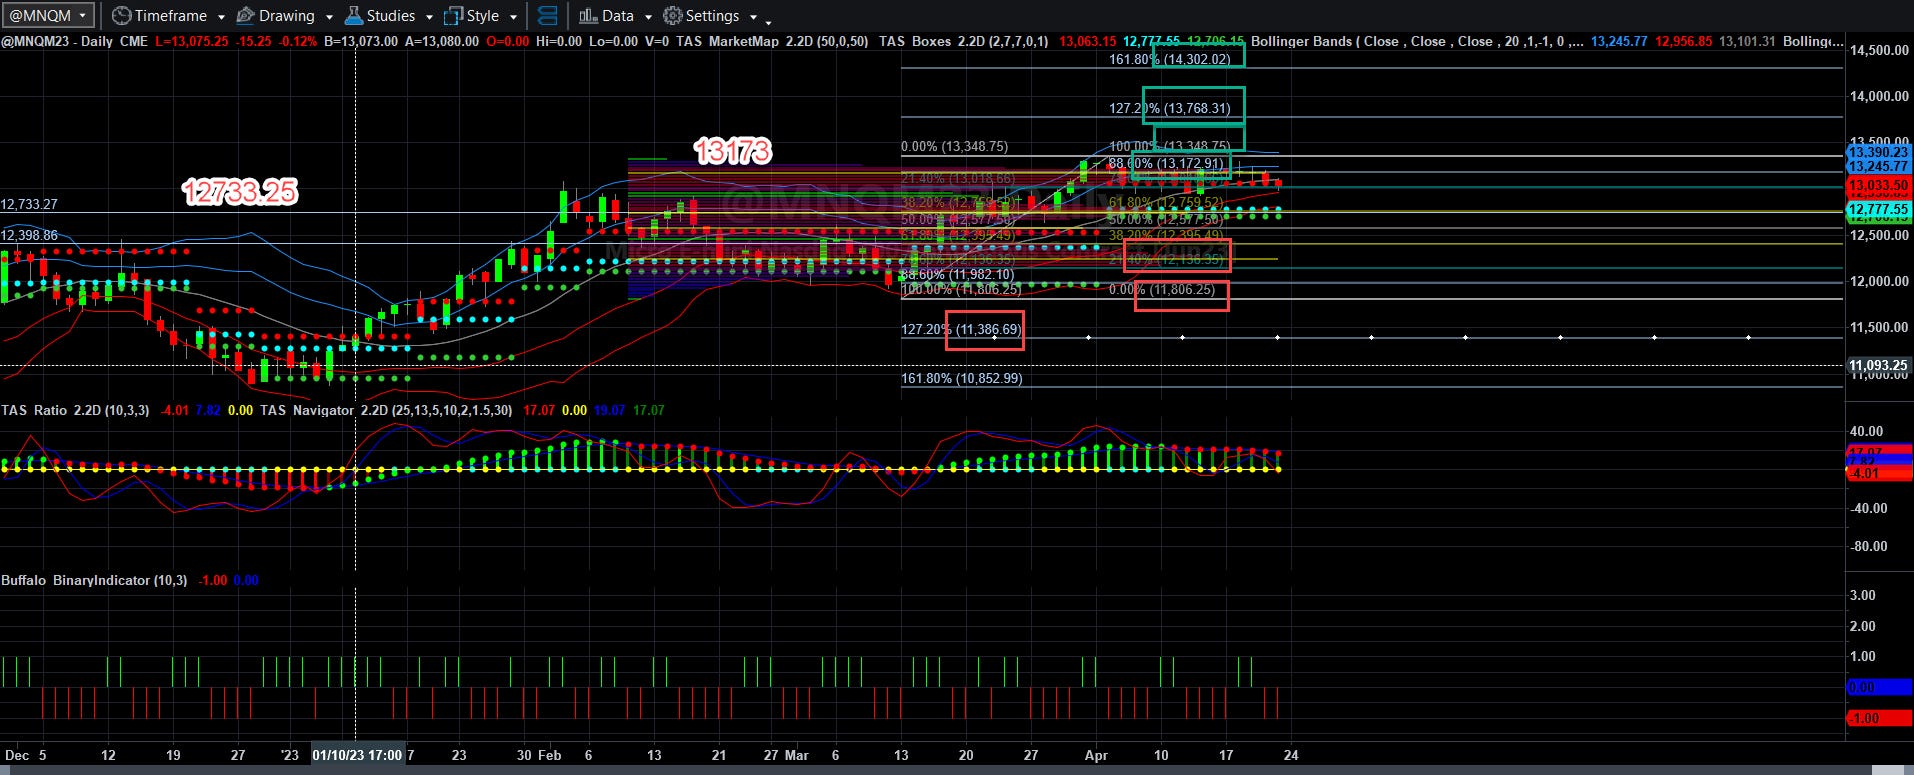
Again, the news likely drives the train, and that train hits the station not this coming week, but the week AFTER THAT.
If you have questions, please let me know and I will answer your questions as soon as I can. Have a happy and profitable week this week!
Today’s Economic Data Courtesy of Trading Economics dot com. Be sure to refresh the date at the top left.


