

Somehow when storing charts I left out the marked data points. Given that I did that and the fact that I assume some of you watched the video (or will before reading this), I will give you the bullish targets (calculated with weekly charts, and the bearish targets, using monthly charts.
Bullish Target:
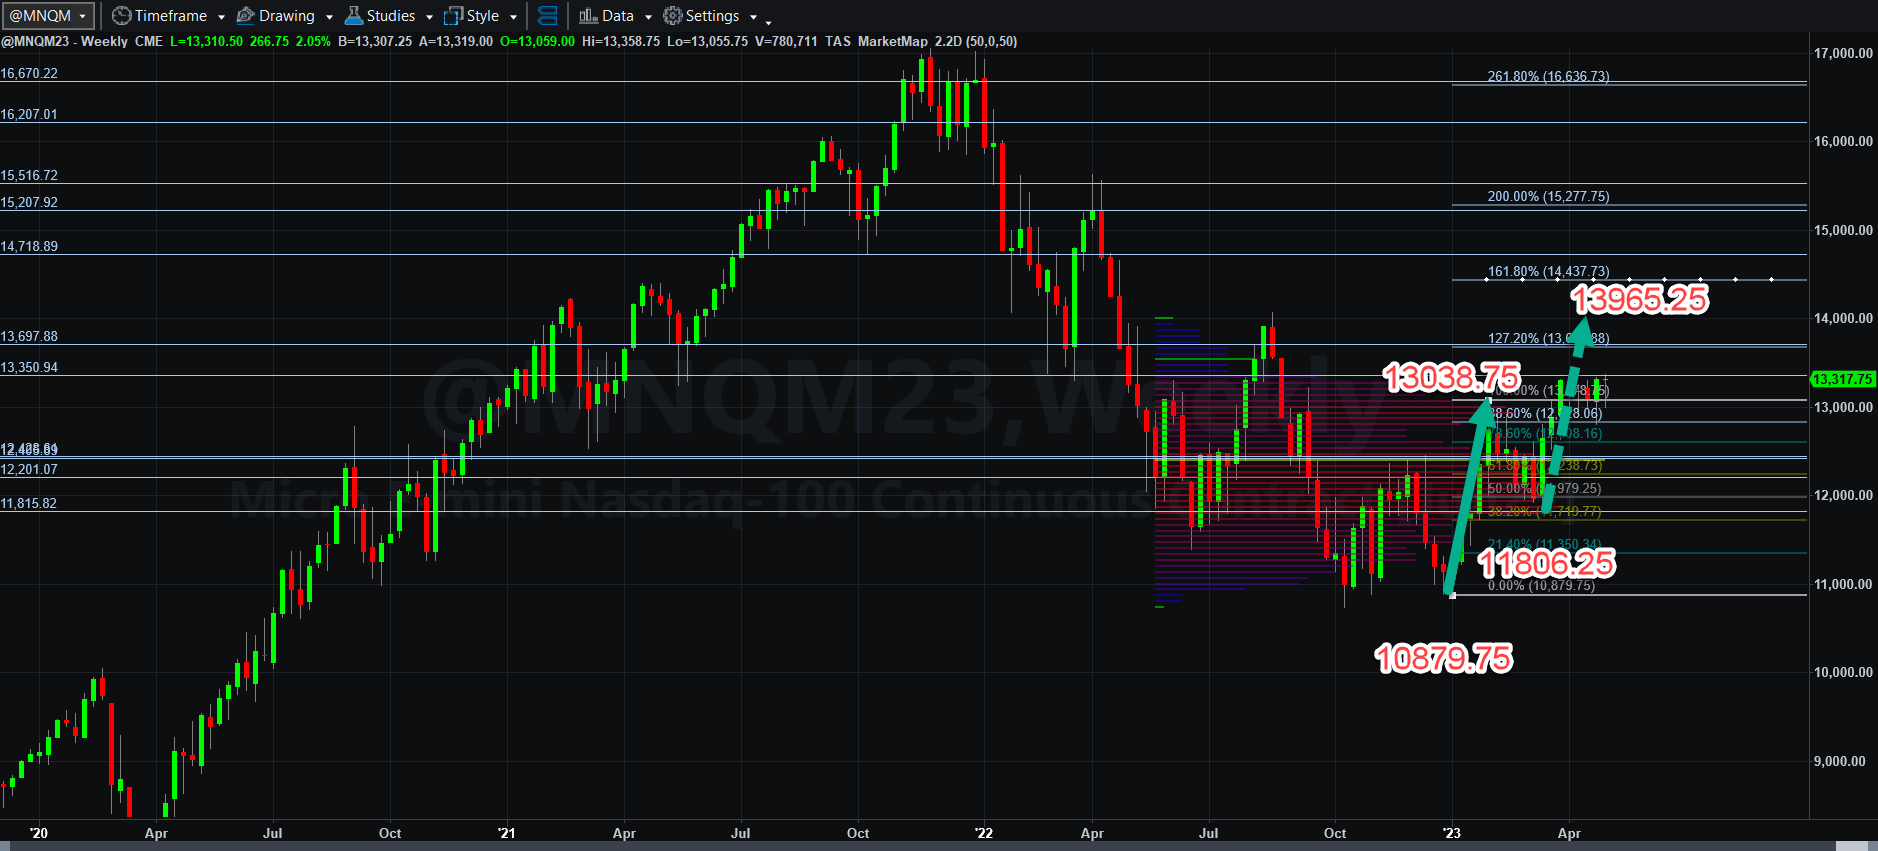
The bullish MNQM23 estimated bullish target seems how to have settled around 14,000. The only problem is that this contract seems incapable of closing above that hourly 13330.75 VWAP line.
Bearish Target:
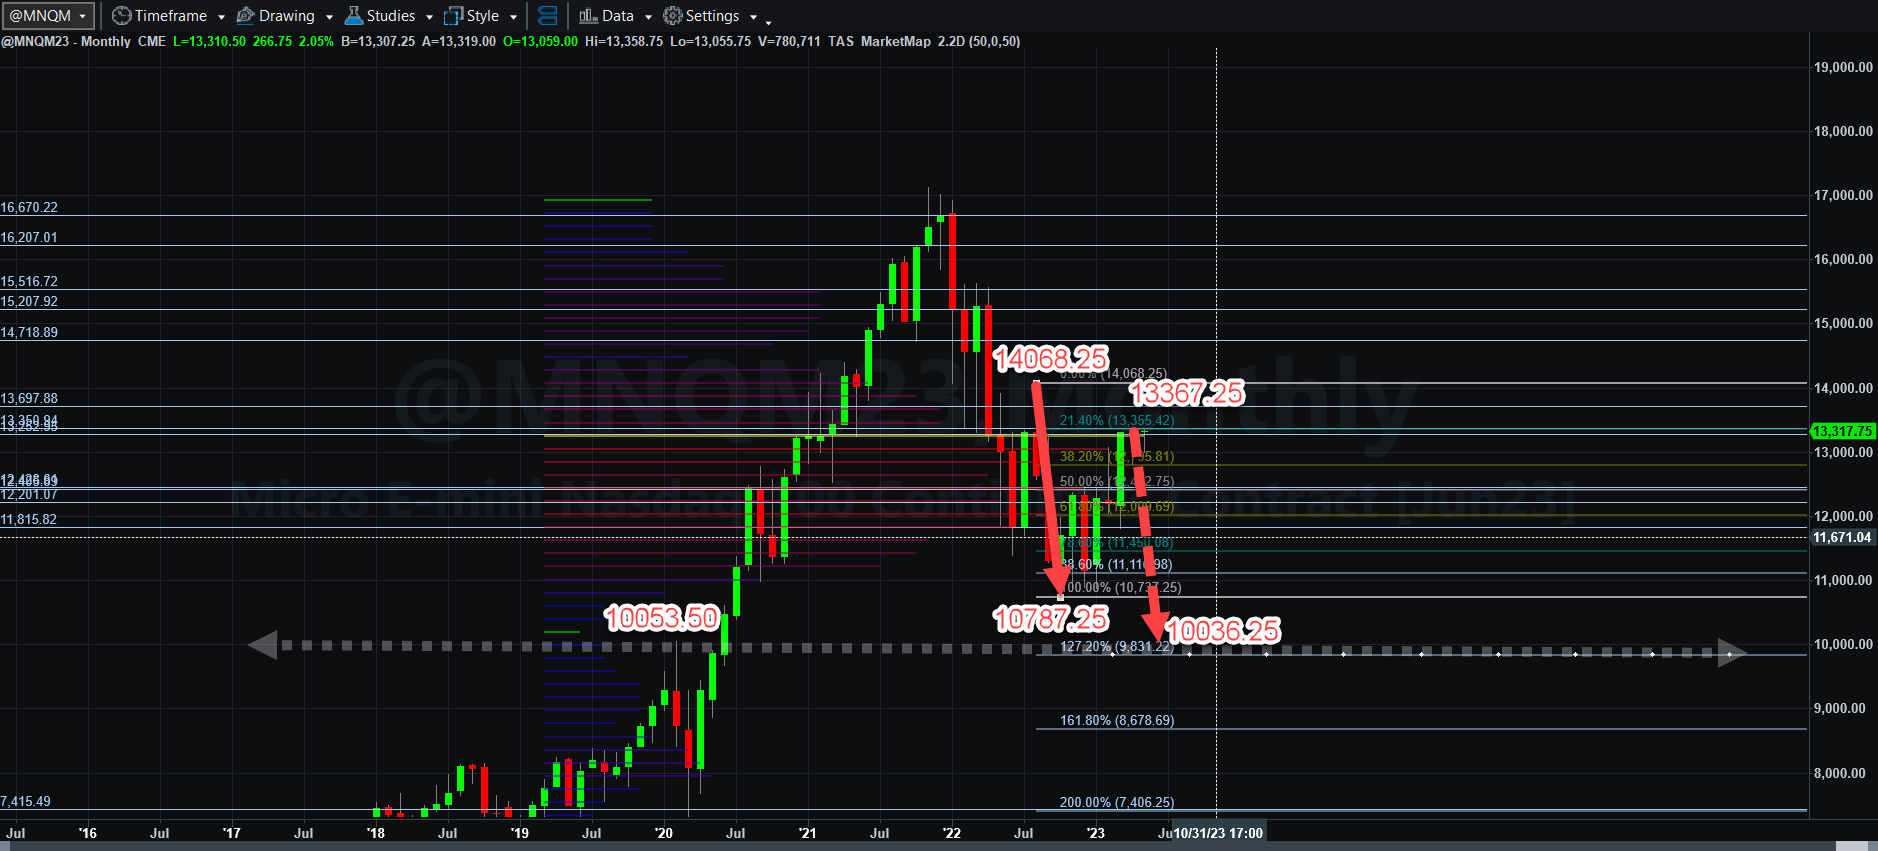
If you will notice that the bearish target somewhat acknowledges that we might get a bounce near the 10053.50 top-bottom support high. We will simply have to see if there is more bearishness if indeed MNQM23 rolls over again.
One thing of note is VXN (the volatility of the Nasdaq 100) has slowed quite a bit of late. Take a look:
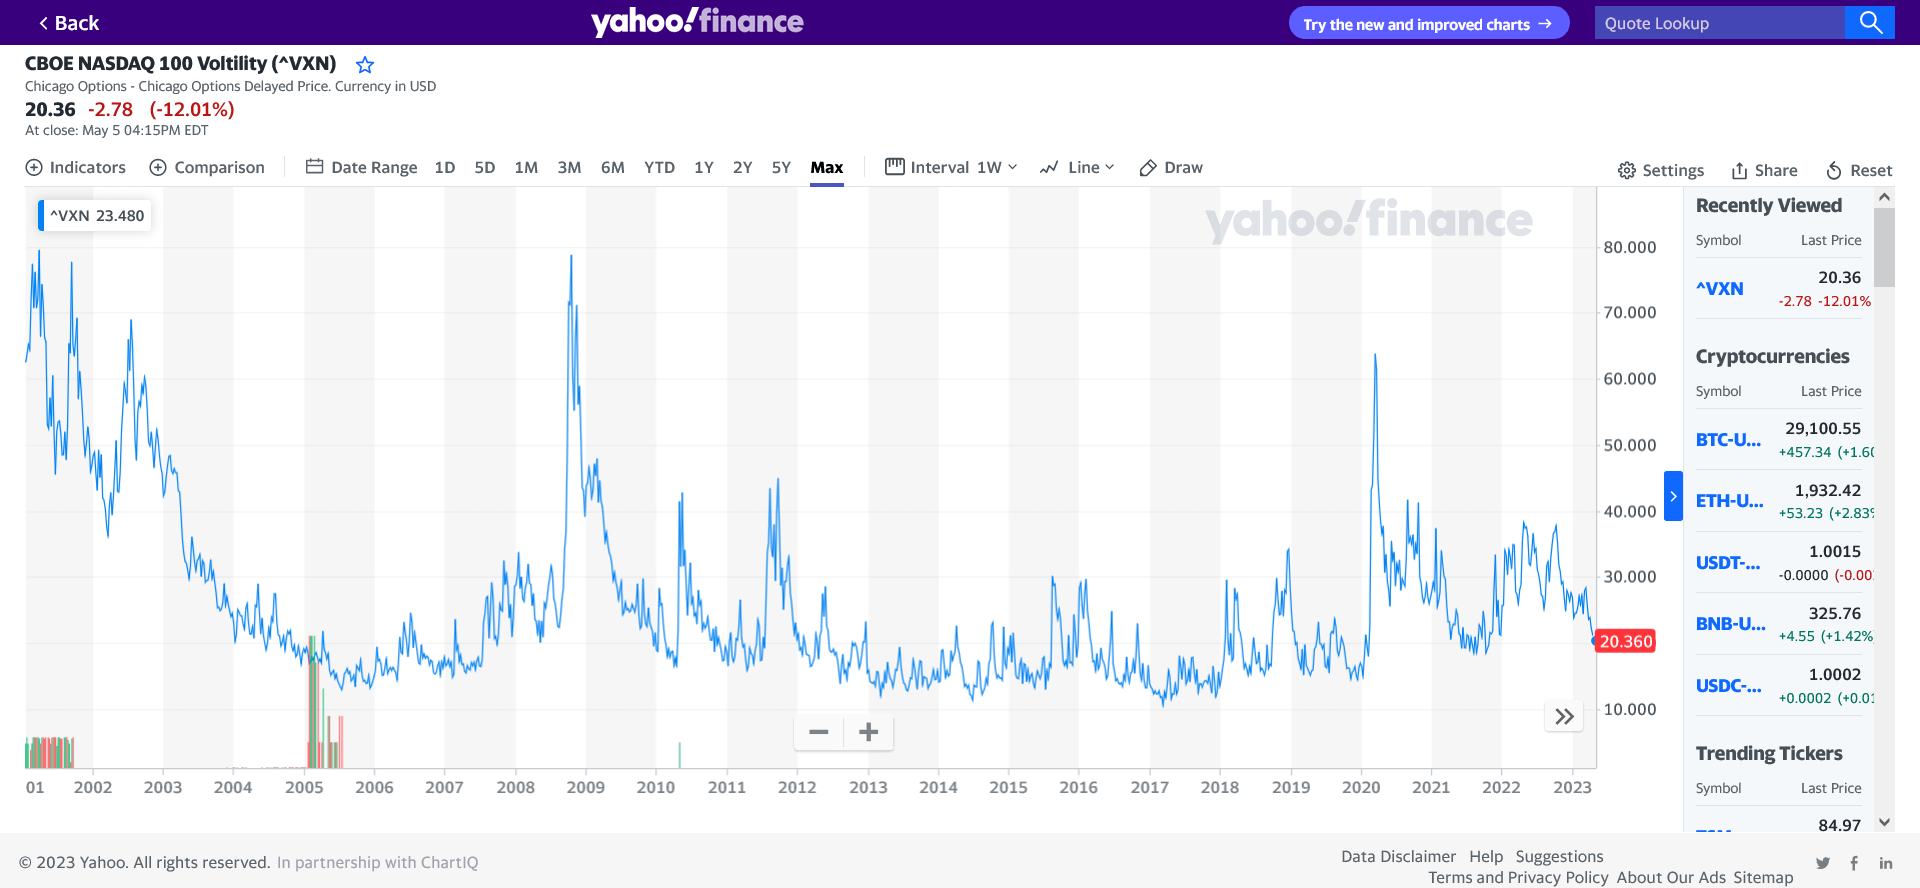
For now, the big ranges may have settled down ( after, of course, the CPI, PCE, GDP, unemployment, and Fed rate announcement decisions). This could continue into a lazy summer of trading. We may see some good trend days like Friday, but only time will tell.
Well, WHICH WAY IS IT HEADED?
Pick your side, as I think news, fiscal and monetary policy, and earnings will drive the boat, in that order.
The New York Times summarized the problems in the regional banking system as a source of market weakness. Bloomberg piles on as well.
NASDAQ earnings for now appear to be relatively sound.
Depending on what news or other world calamity or market event hits, we still are waiting for this market to make a decision. It has not done so as yet.
I will simply trade in the direction that market profile, volume, market price action, and price and momentum tell me to trade on a 15-minute basis. I think in a few weeks we should be this doldrums knocked out of this market and we will see a pattern completion of some kind.
More will be coming soon. Have a fantastic Sunday and a great week this week.

