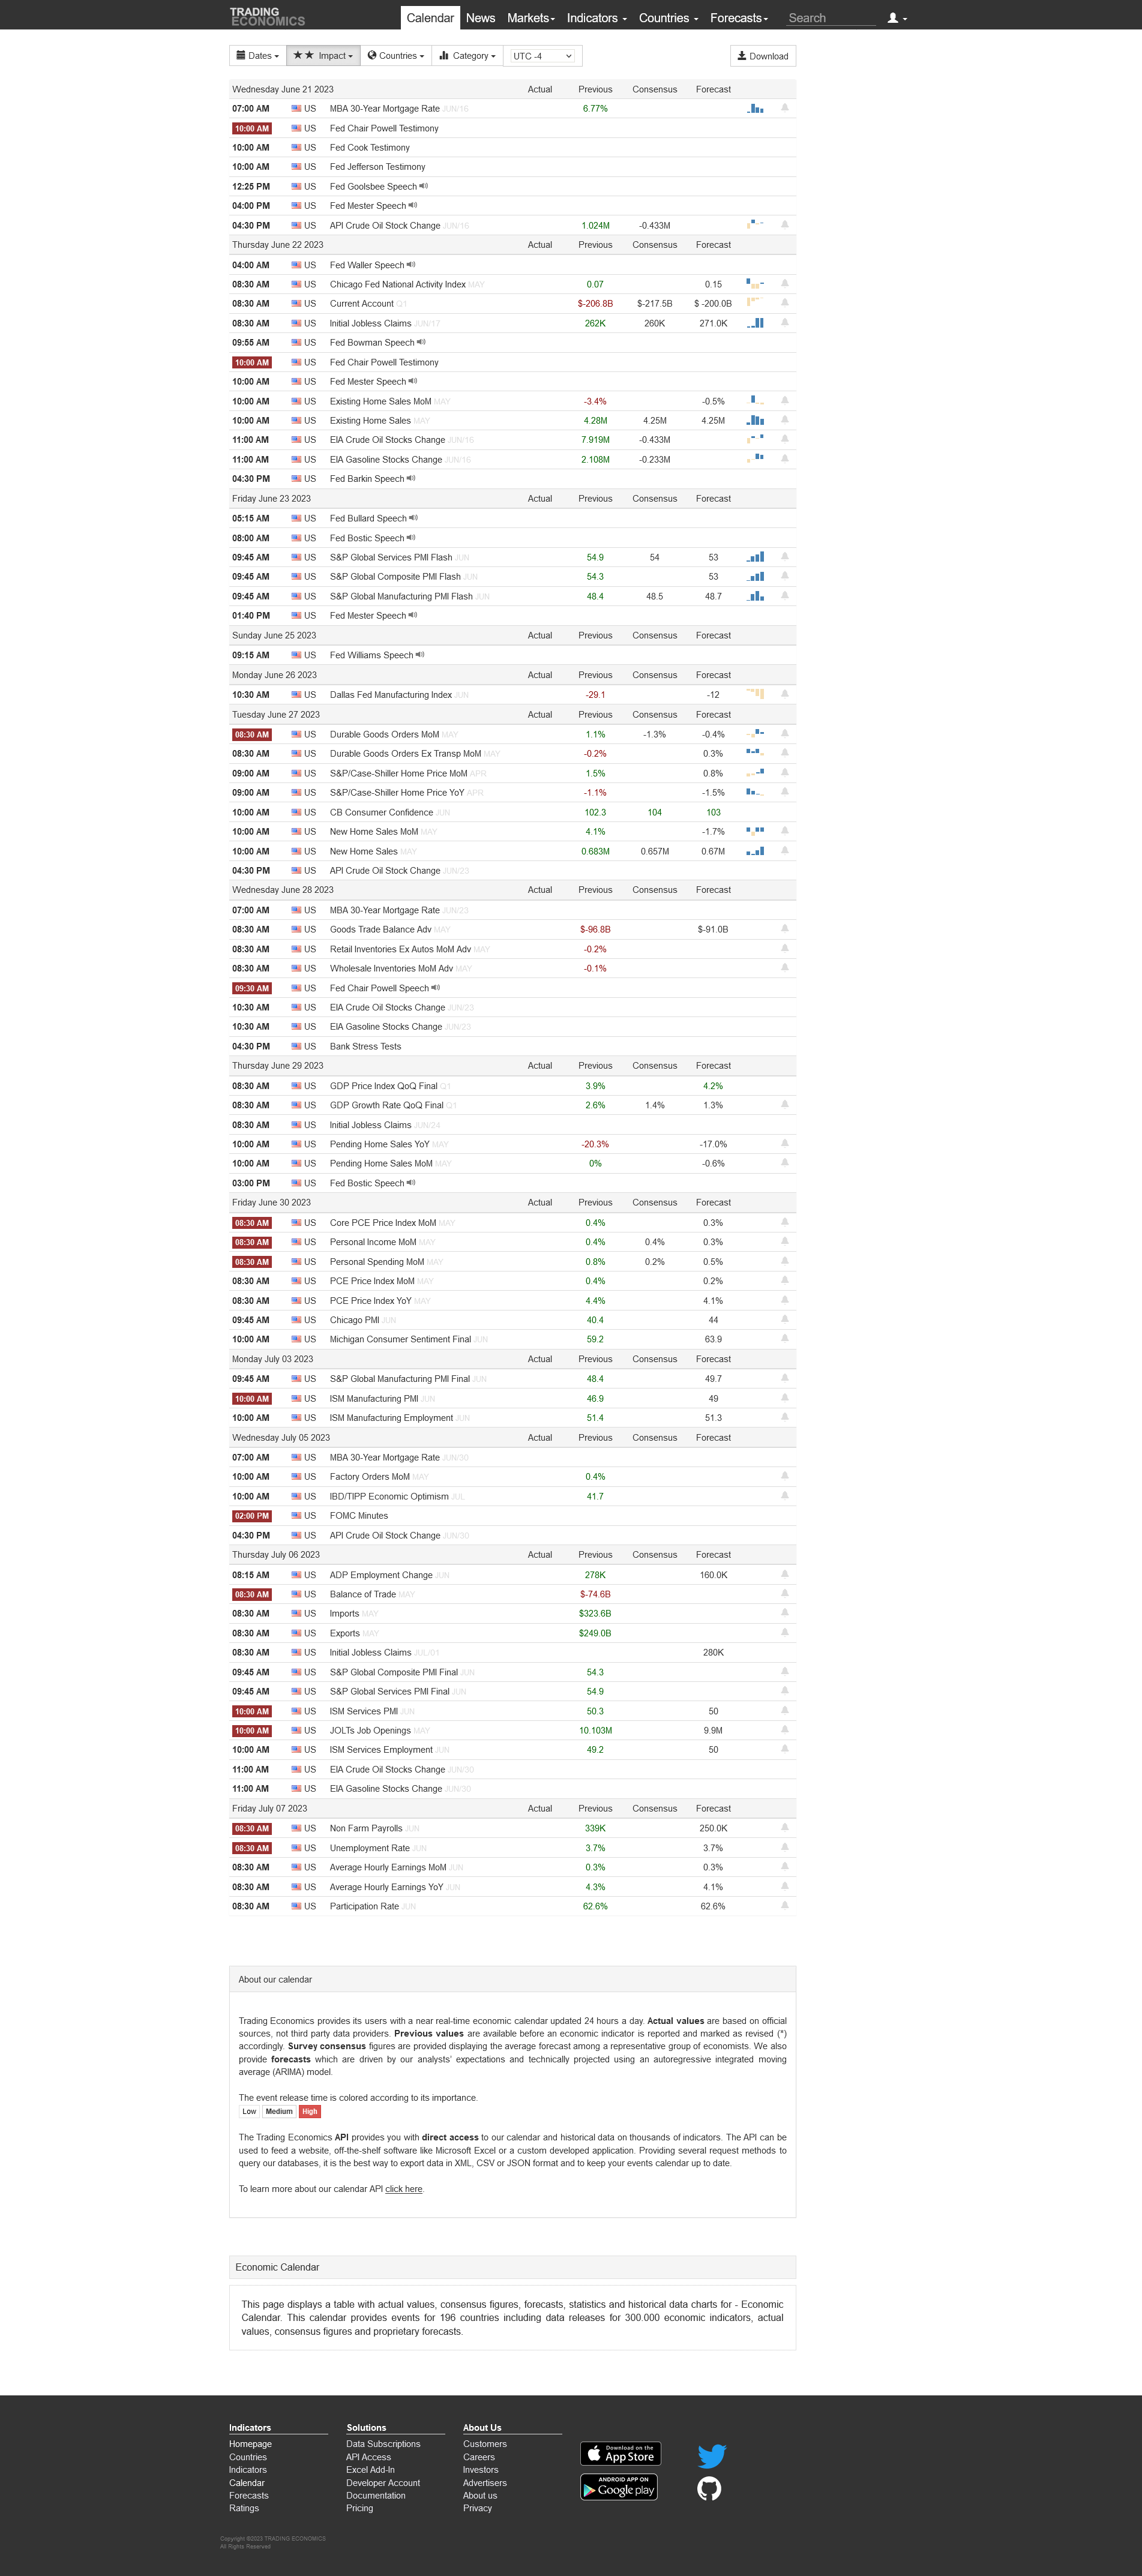
Price, Price Spread, Lagged Price/Volume Spread, and Binary Price/Volume Indicator
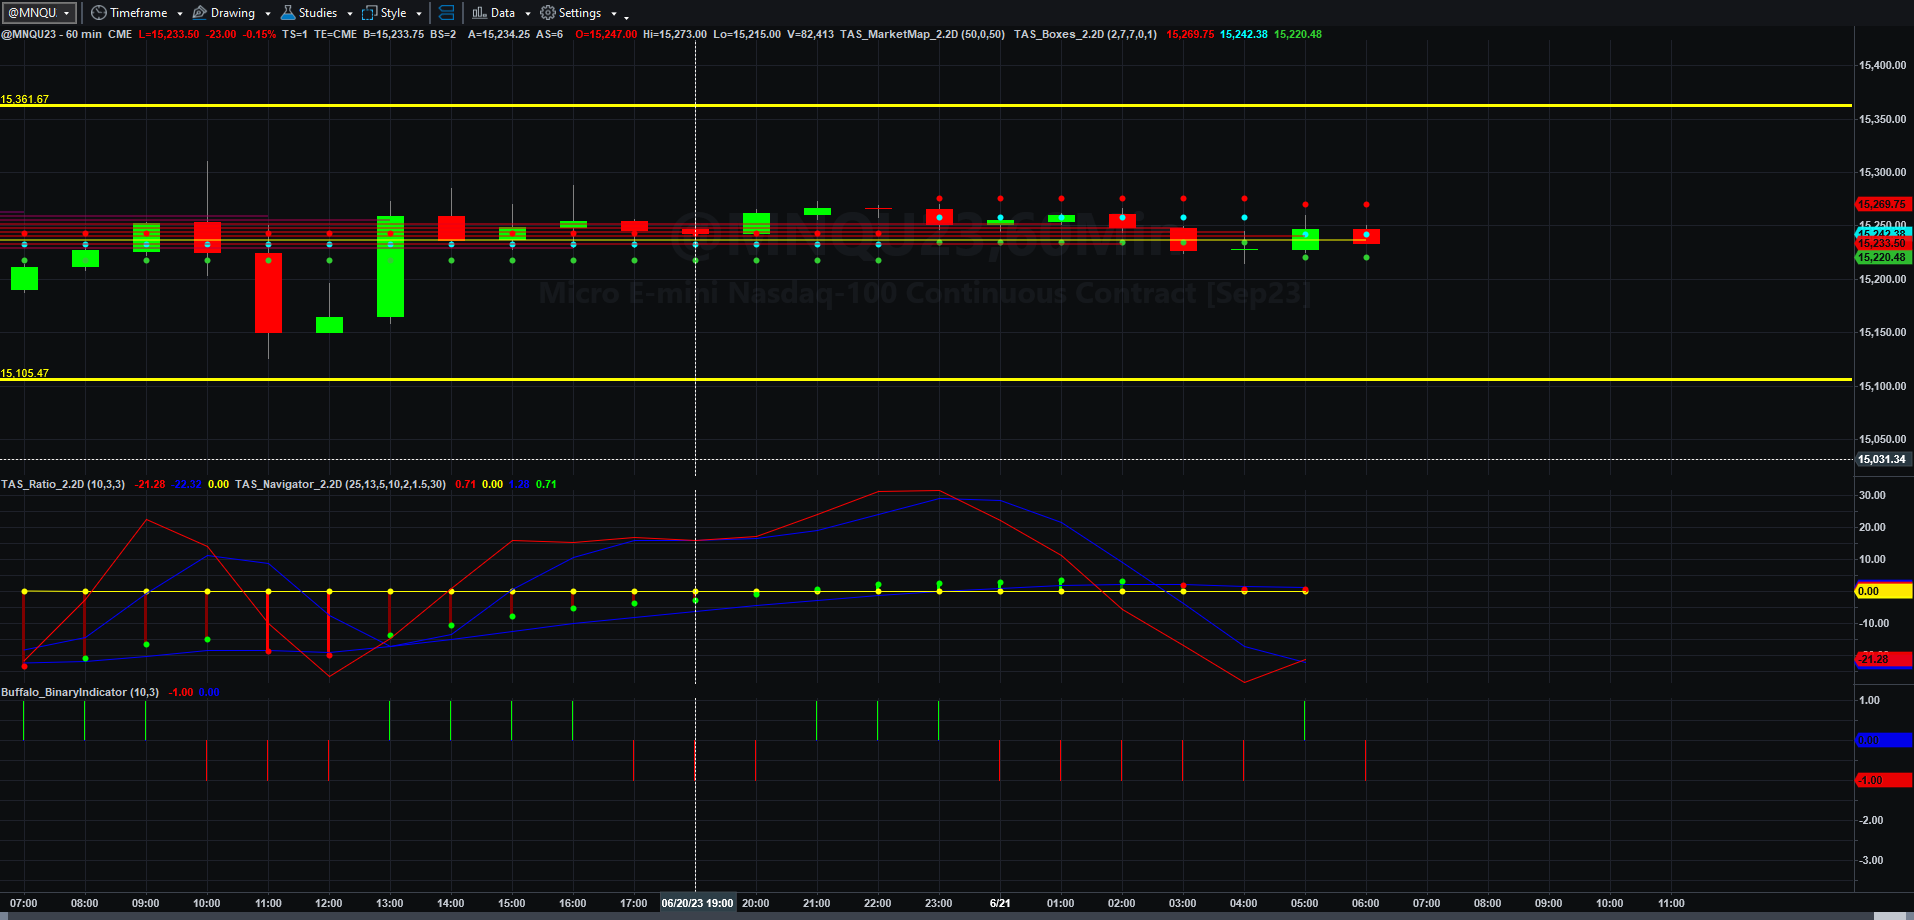
Price and Total Volume With 50-period Moving Volume Average
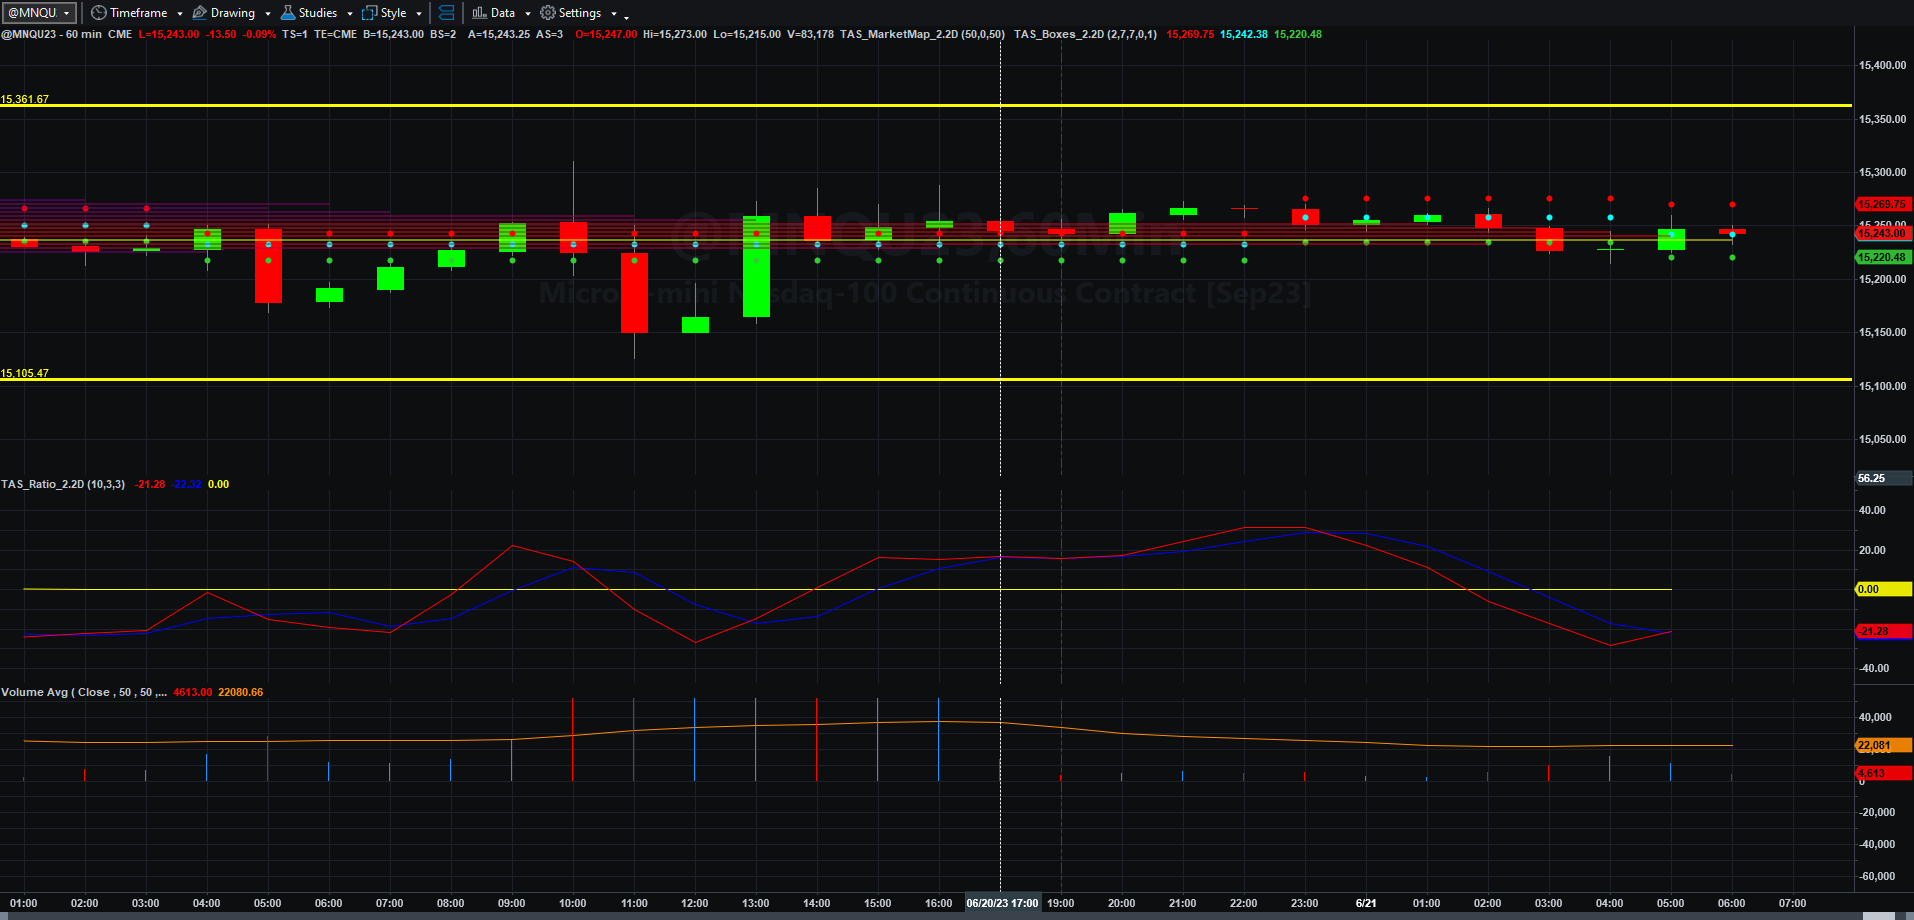
Fibonacci Price Scale With Targets
I must, because of time constraints resist writing a long piece about where we might be with MQNU23 in context to longer time frames.
Look at this quickly pulled-together weekly chart with a Fibonacci scale:
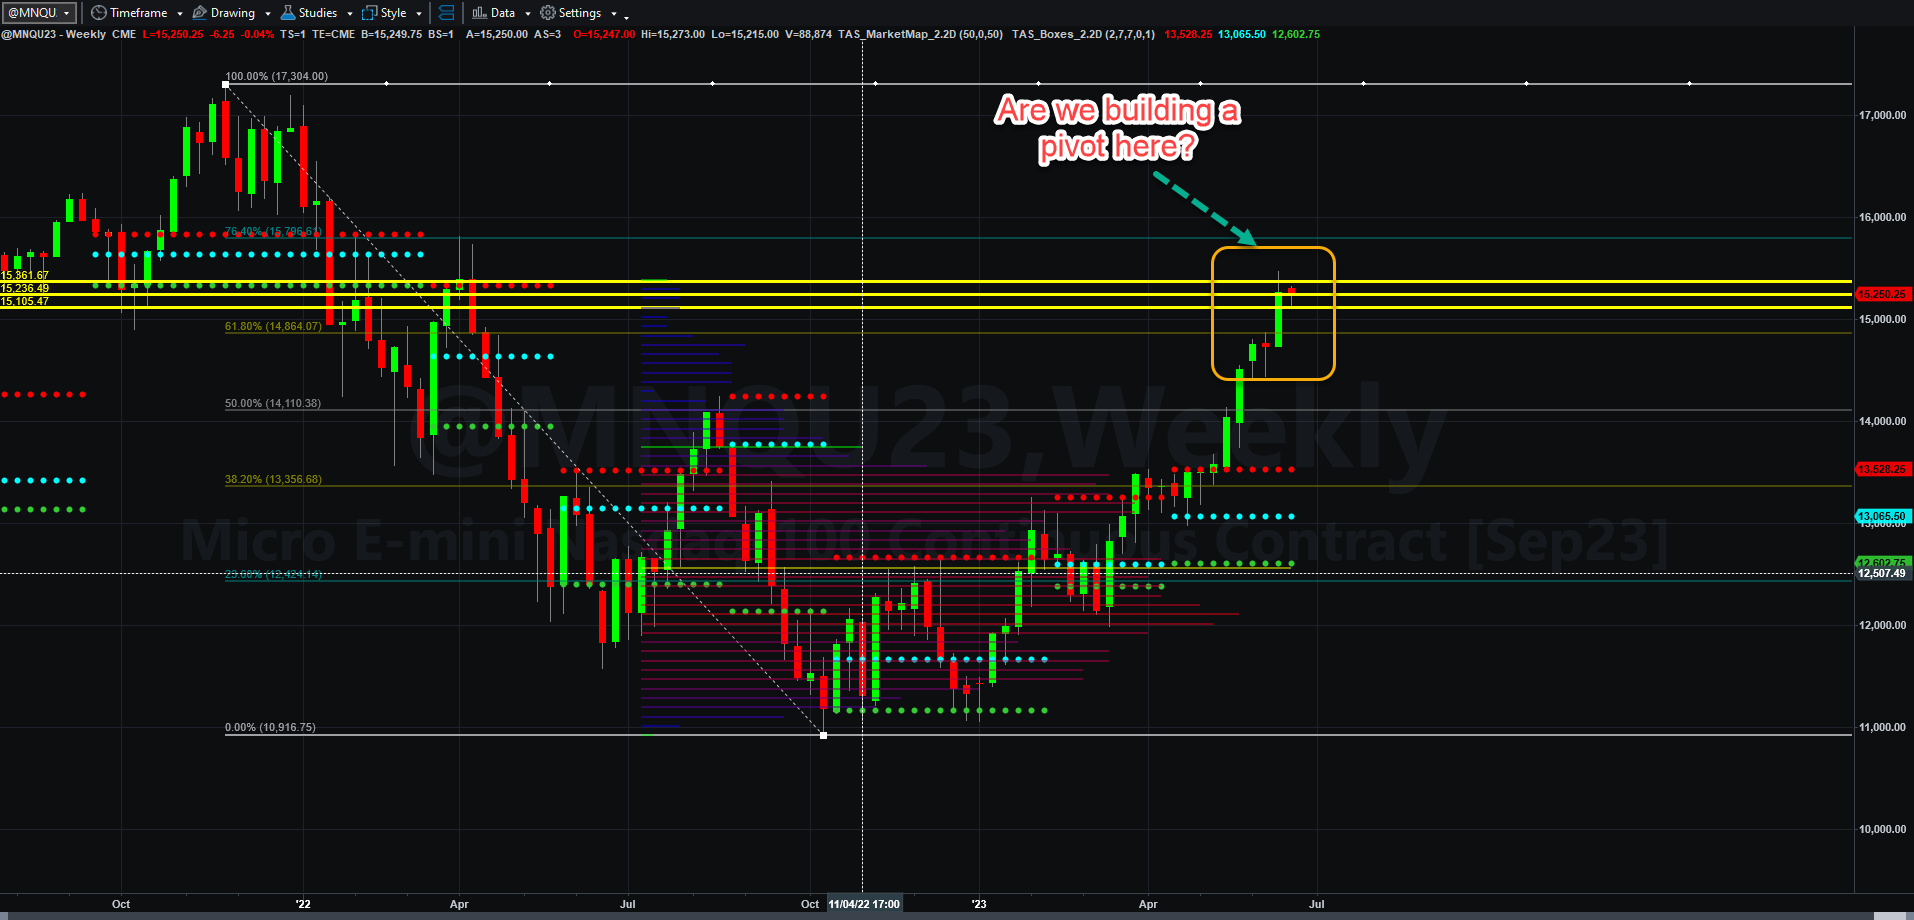
It almost looks like MNQU23 could be stalling out with a lower high on a weekly basis as it prepares for another dive. This is also a premature look at that chart BECAUSE THE FINAL WEEKLY BAR HAS NOT YET BEEN COMPLETED.
Well, is it? The answer is, NO ONE KNOWS, but the news stories and tweets you read from CFAs to the Fed, are all cautious about the future. Even investment managers who seem mesmerized by artificial intelligence are questioning the present value of things like NVDA (Nvidia). Valuations on the NASDAQ are in a very large part askew of normal valuations for business.
( I really don’t like the term AI, because others of a certain age and I are thinking about the scream in a popular metal song. )
The idea of the true value of assets, stocks, commodities, bonds, real estate, and the like is all on the line with every Fed decision, and fear gets ratcheted up with financial articles like this one.
The truth is, investors must at some point consider cash flow in every investment (even a BUSINESS investment), and environments like these, where governments have destroyed the very foundations of value by destroying currencies and spending mindlessly on wars and entitlements without concern for the citizens or its economy will impact investors, taxpayers, and citizens of all types in ways that will damage their future and their independence as free-thinking and mobile human beings.
Somehow, economic valuations based on stable fundamentals of budget and monetary value will have to be restored, or we will be forever cast onto the crazy train of volatility. America has the ability to do that if only it can rid itself of the power-and-money-obsessed elitist and fascist criminals who want to take the economy, and your freedoms, away for their own desires. Simple math and discipline can fix this mess if we can just push aside the thugs and restore simple economic principles.
But HEY, let’s just look at the charts, OK?
Asia and Europe were somewhat undecided in trading prior to the New York open. All the hourly trend data is somewhat mixed.
If MNQU23 can remain above 15236.75, chances are it can take out the previous hourly swing high of 15267.50, and perhaps hit 15331.25 and even 15443.75 before Thursday ends.
If not, it could be a short trip to 15168.75 and beyond to 15131.50 and 15083.75 by Thursday afternoon.
I picked up another 40 NQ points long in simulation again yesterday. I will go back to live trading on Monday as I seem pretty comfortable with the new methodology now. This method should allow me to ride trends longer and not get the boot as often (which will create a break-even or win scenario, which is best for scaling). More on that later.
Have an incredible, profitable, and productive Wednesday!
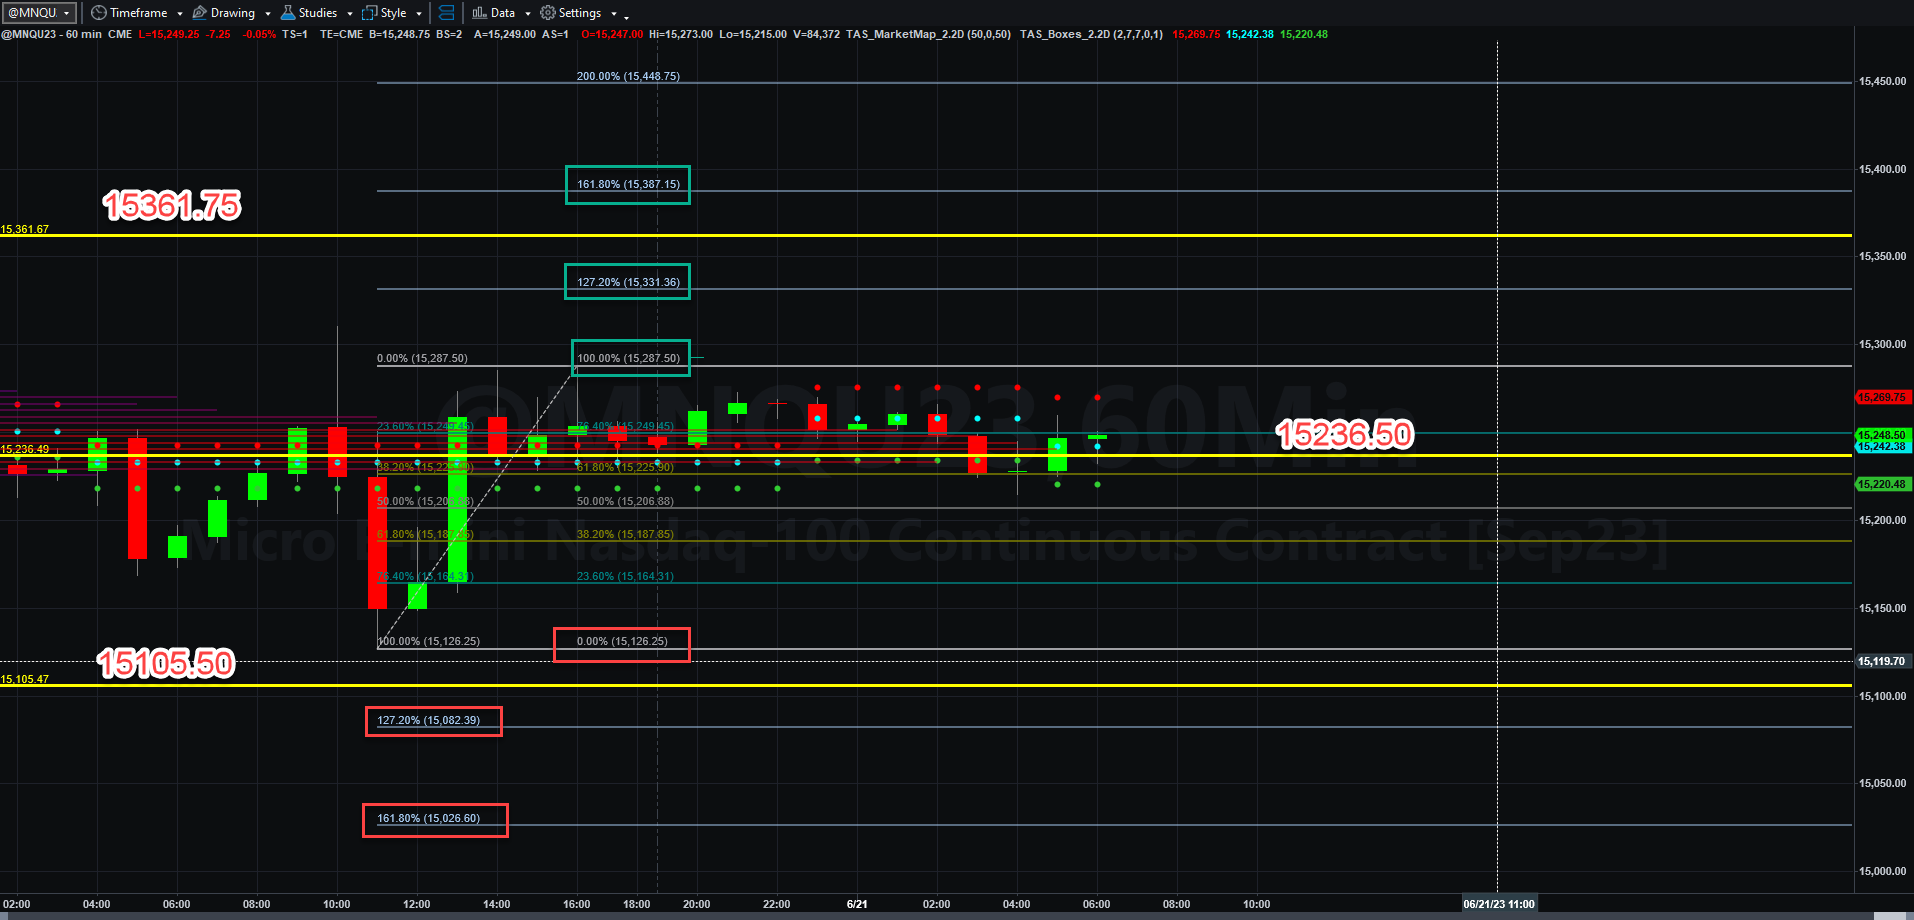
Today’s Economic Data Courtesy of Trading Economics dot com. Be sure to refresh the date at the top left.