This will be an abbreviated session as I suffered a minor eye injury that seems to have not gotten better, so this day will be devoted first to fixing that issue. Only the Fibonacci chart will be displayed today, but I think it will help you see what has happened and could continue to happen.
Fibonacci Price Scale With Targets
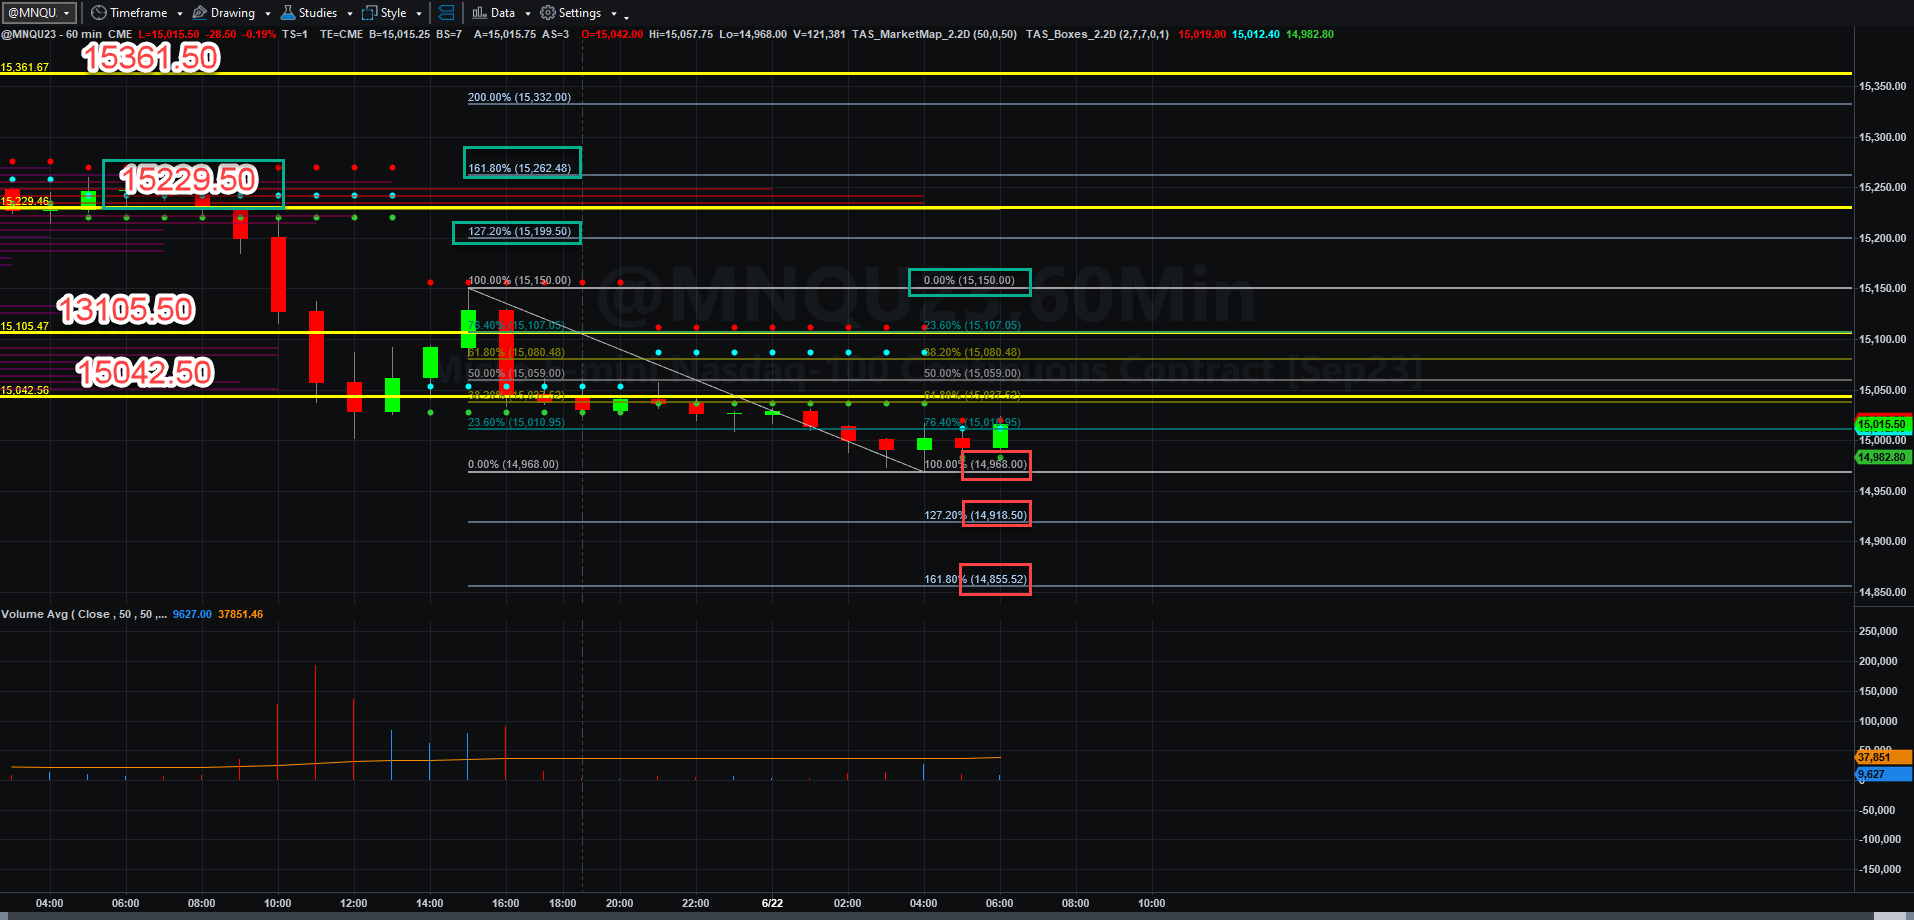
At 1000 EDT, Powell’s statements about rates going higher probably stoked fear in some institutions and hedge funds, and despite the volatility early in that hour, the price below the 15229.40 VWAP line broke and for a time MNQU23 lost the 15-handle.
Despite a reflex rally that happened late in the afternoon, sellers ran onto the computerized floor and pressed the market back down. Overnight there has been a mixed bag of selling and buying.
Let’s take a look at the chart.
If MNQU23 can remain above 15042.50, it has a shot at taking out the late afternoon swing high of 15150 and even getting to 15199.50 and even 15262.50 by Friday.
If not, MNQU23 likely breaks below 14968 and runs back to 14918.50 and even 14855.50 by Friday. We will simply have to see how traders react to more testimony to see how it shakes out.
Trying to get short in simulation, not fully understanding how to adjust stops, cost me 80 NQ points in two short attempts yesterday, but again, that is why I am testing the new methodology. I should have the other platform running this weekend, so those errors should soon disappear.
It’s time for me to see the eye doctor. Have a fantastic and profitable Thursday!
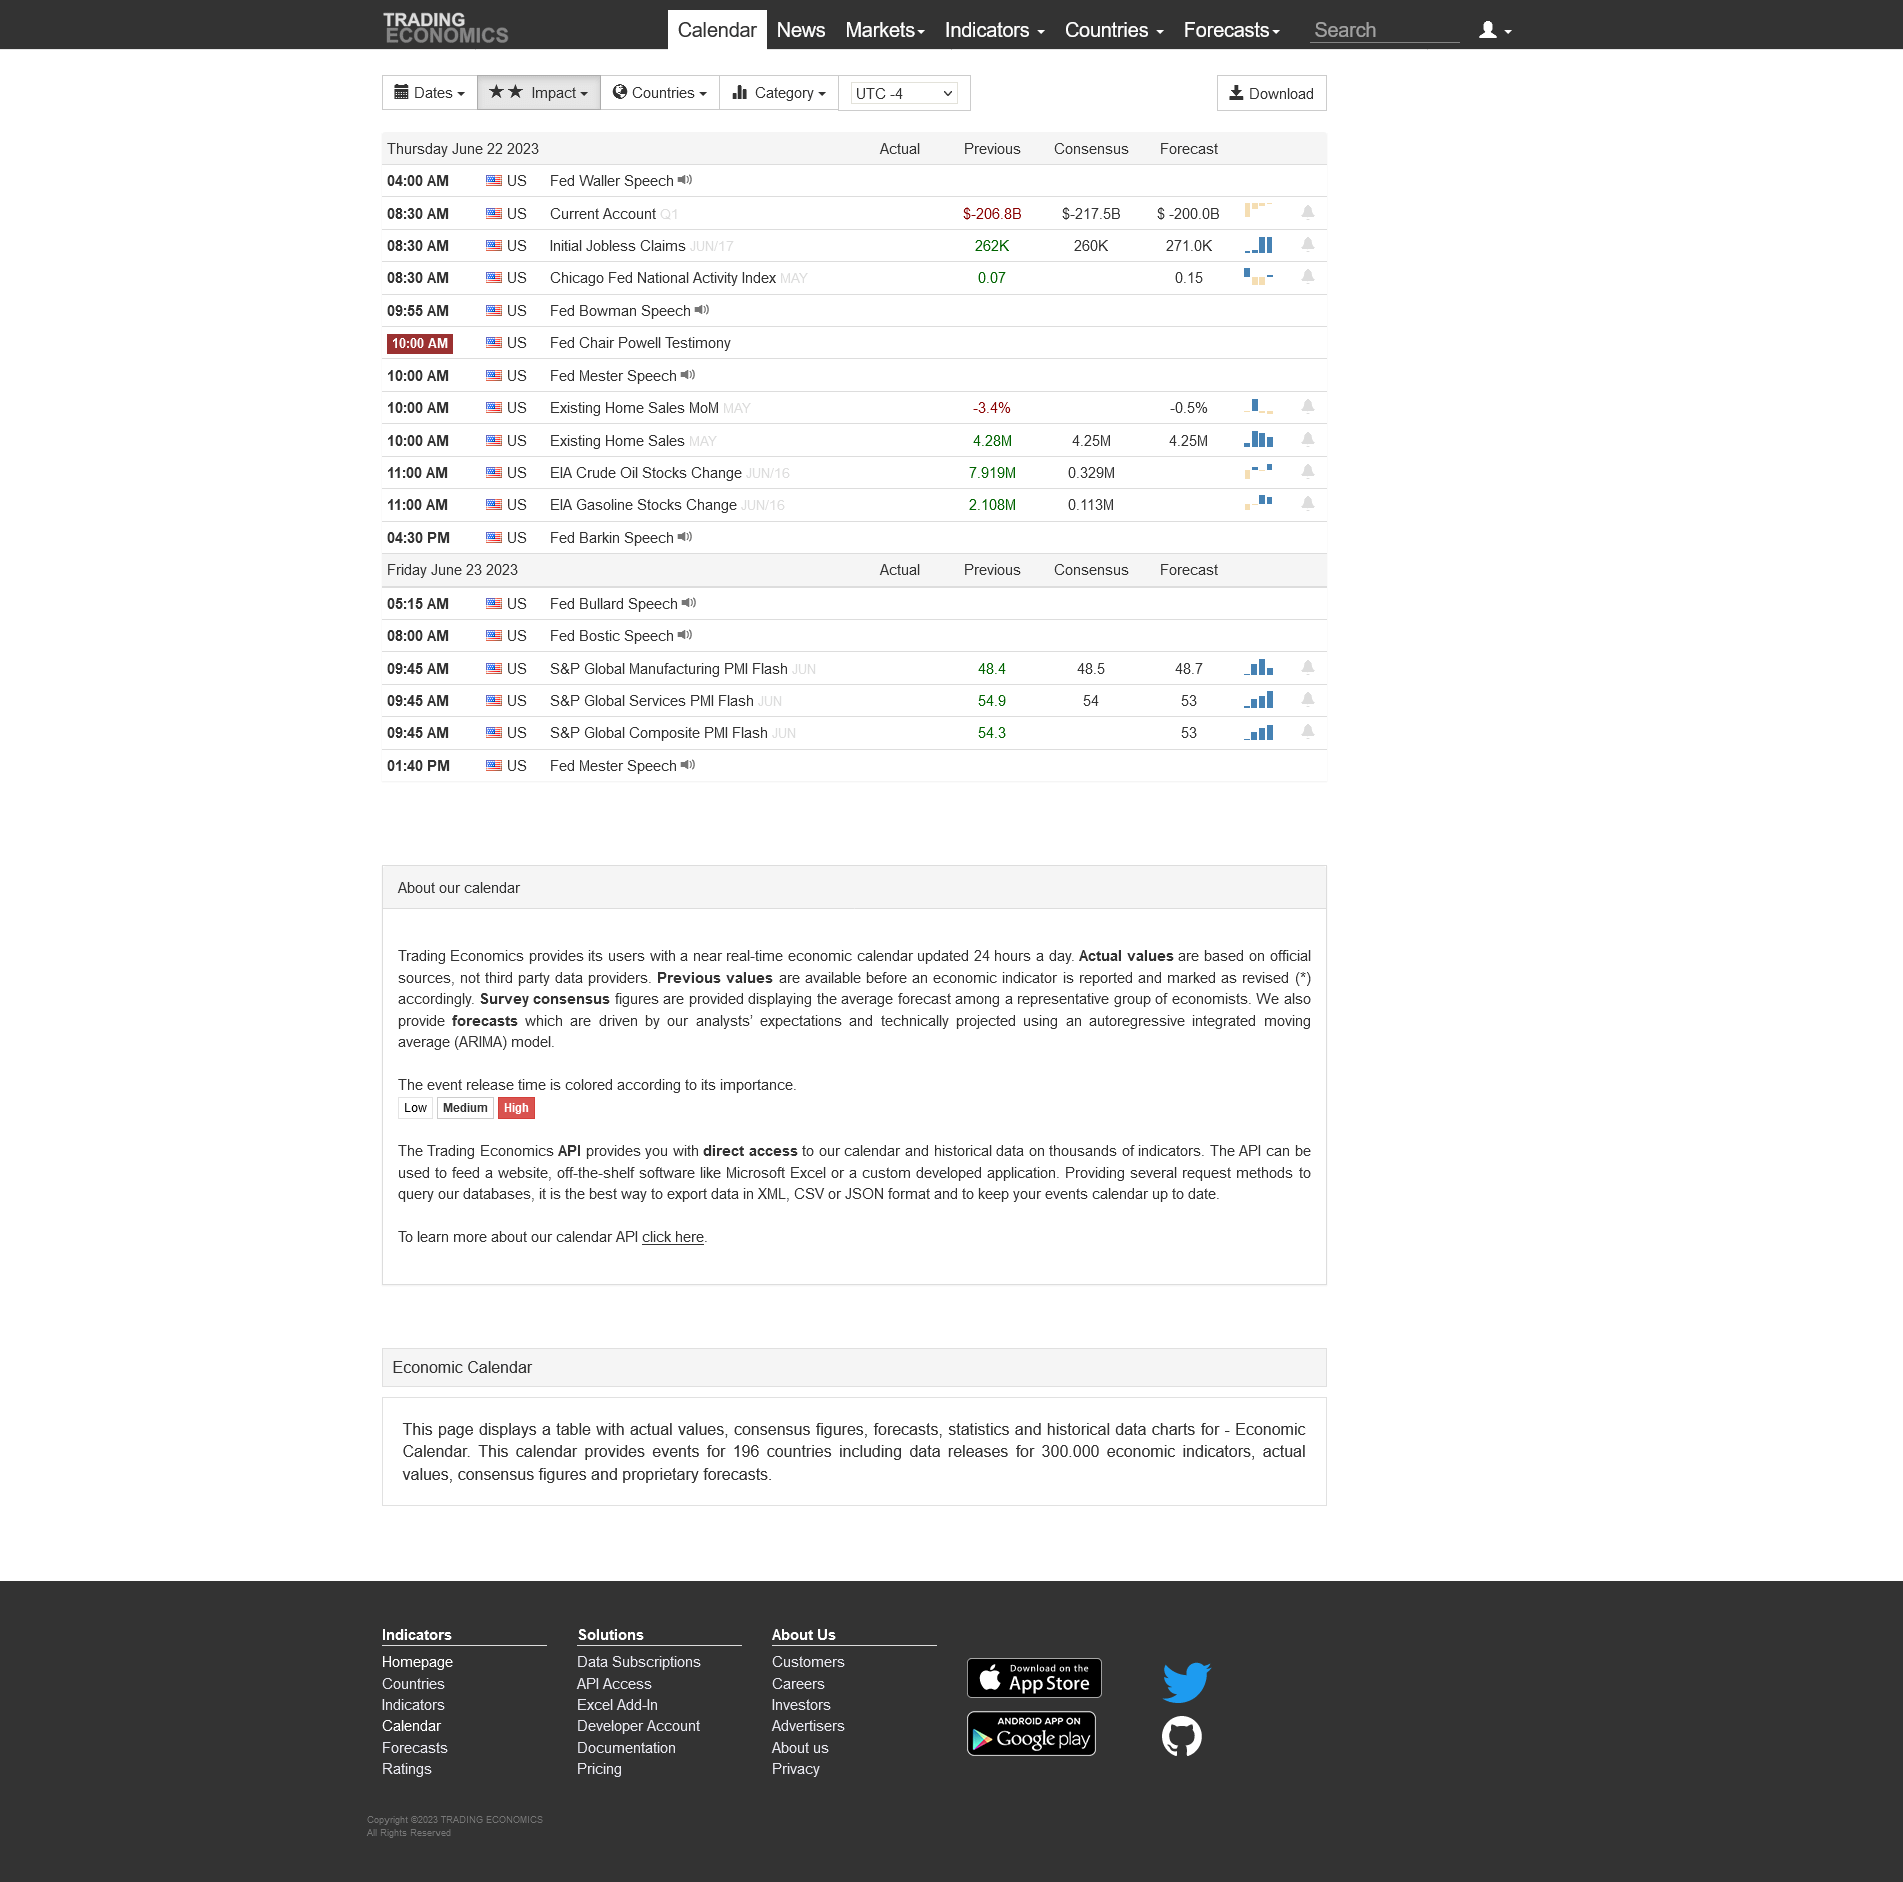
Today’s Economic Data Courtesy of Trading Economics dot com. Be sure to refresh the date at the top left.