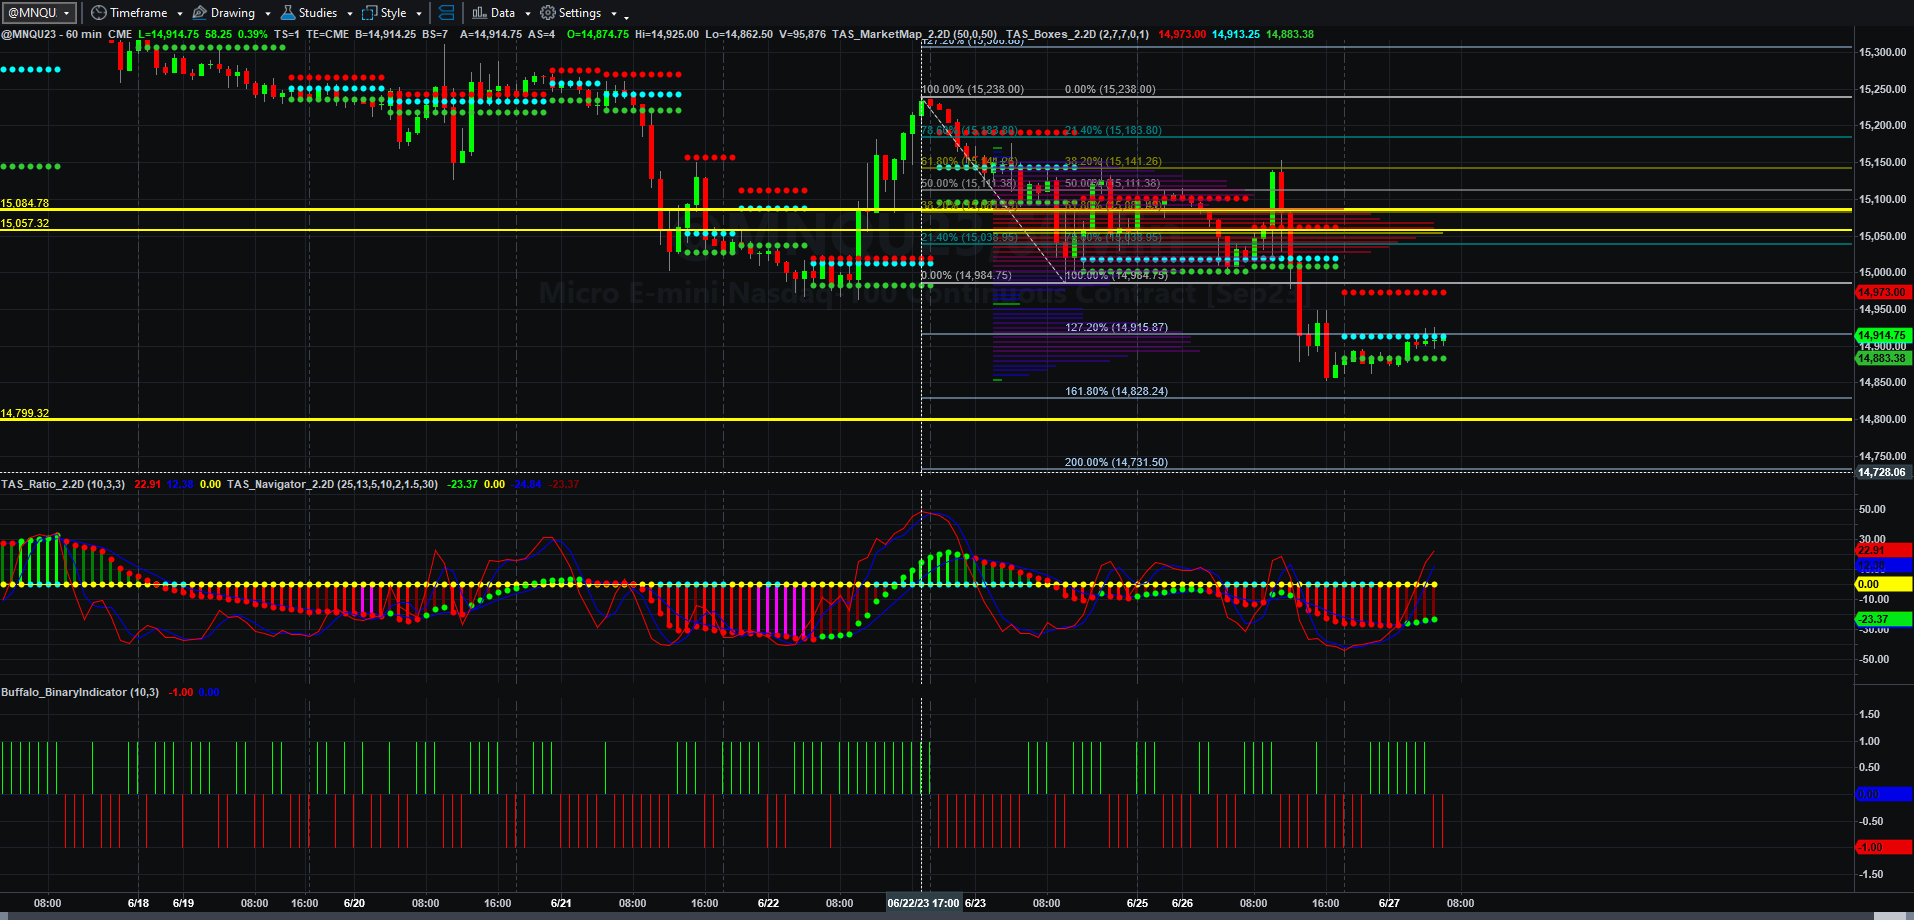
Price, Price Spread, Lagged Price/Volume Spread, and Binary Price/Volume Indicator
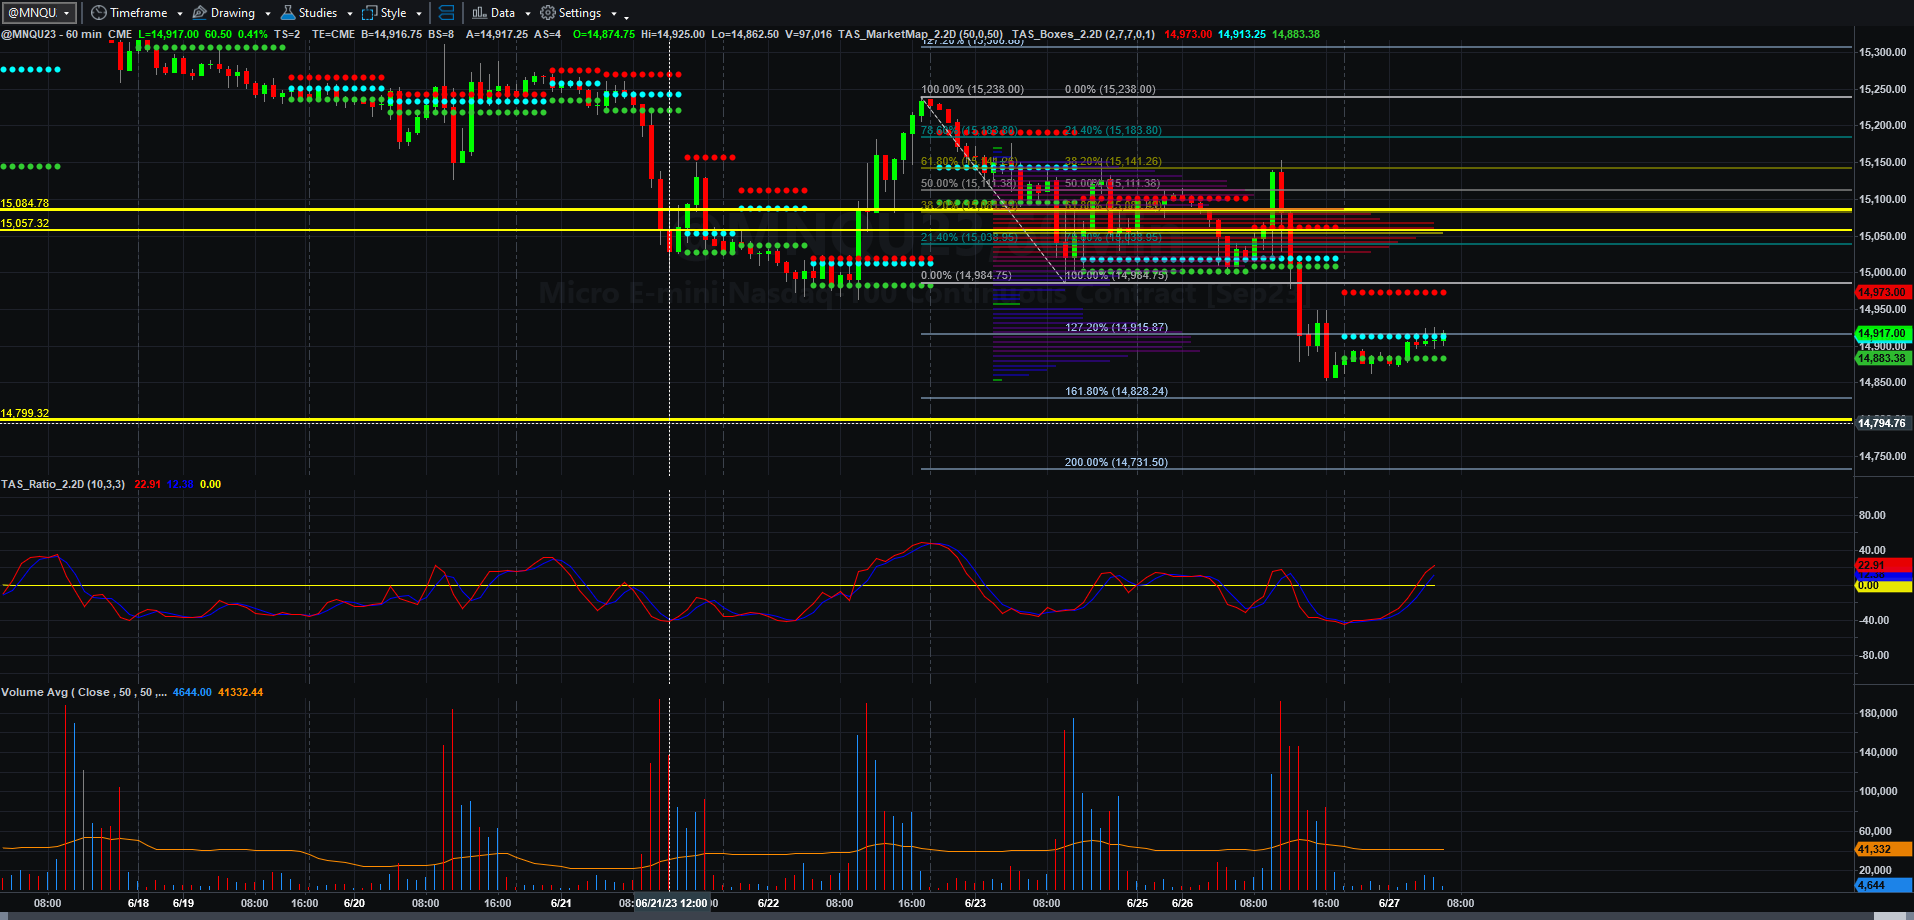
Price and Total Volume With 50-period Moving Volume Average
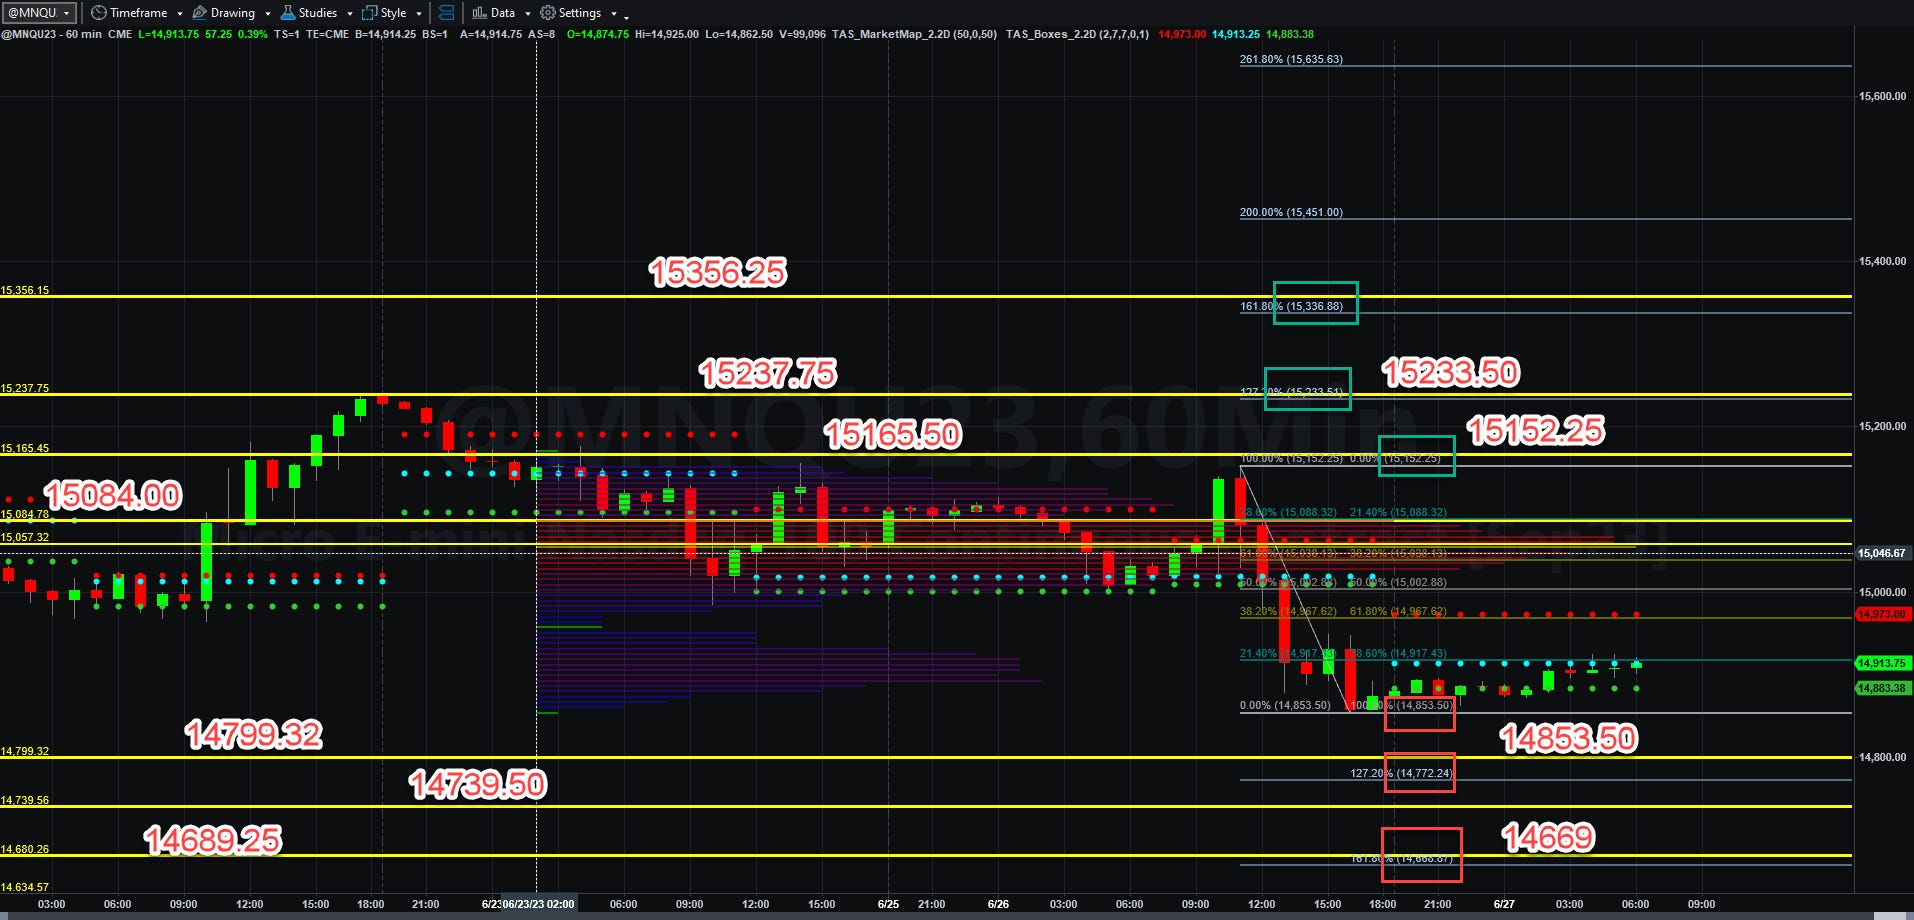
Fibonacci Price Scale With Targets
Everything I discussed on Sunday could be rearing its head, or it could just be another head fake in the rally that began earlier this year.
EU is raising rates again. The Fed will be talking about interest rates today and that will likely be hawkish (but who knows). Bulls and bears are trading volatility spreads like Vegas betters wager on point spreads in the NBA Finals. Traders, hedgers, and investors are bipolar. Since I was a child of the 1960s, I will just refer to them as suffering from manic depression.
We could be at the dreaded pivot point for the next decline to 9088 or the hick-up on the way to 21000 for MNQU23. I could write about this for days, but I have stuff to do. Let’s look at the charts.
As you can see from yesterday’s action, taking the broader Fibonacci scale led to a better description of the then future price action, as we first took a bullish breakout and then swan-dove into the area around 14980. I profited from the first breakout and then moved on to the business of the day. Afternoon traders would have been able to capture a nice profit from that reversal.
One reason I am using the larger scale is that long candles in both directions create opportunities to reclimb or fall through the old price VWAP lines. You can see from the charts today that it could in fact be more of the same, depending on which side predominates in trade action during the day.
Asia tried to rally MNQU23, but Europe drove the price back to those swing lows prior to 0500 EDT. We will simply have to see how strong the reaction to durable goods orders is and to the other wacky news of the day.
If MNQU23 can rally above 15084.75, it has another shot at rallying above 15152.25 and beyond to 15238.50 and 15307 by Wednesday.
If not, it could be another quick trip to the lows at 14984.75 to 14916 and 14828.75 by Wednesday.
We could have full-on wacky price action until the PCE is released on Friday. We will simply have to use patience and discipline to wait for setups to happen.
Yesterday I ran a single contract trade to 17 NQ points profit and took my money and ran on to other business. Had I stayed, I could have indeed traded the reversal for over 100 NQ points, but as I have said before, I try to trade only in the mornings as I have other things to manage during the day. My goal is to trade and scale, and job one is to PROTECT EQUITY.
I am still missing one password a software vendor owes me to unlock that new platform. I am hoping I can use that to demonstrate further the new statistically valid way of trading breakouts that goes beyond just riding the 2 standard deviation line of “unfair highs” and “unfair lows” provided by a typical volume profile chart. The other thing I do is confirm breakouts with my binary indicator and Fibonacci levels, using those same levels to set rational profit targets.
Hopefully, I will have that by the end of the week. Have a fantastic Tuesday in every aspect of whatever you do ( as long as it is legal and ethical, which is something rare in Washington, DC, and many state capitols today).
More will come soon.
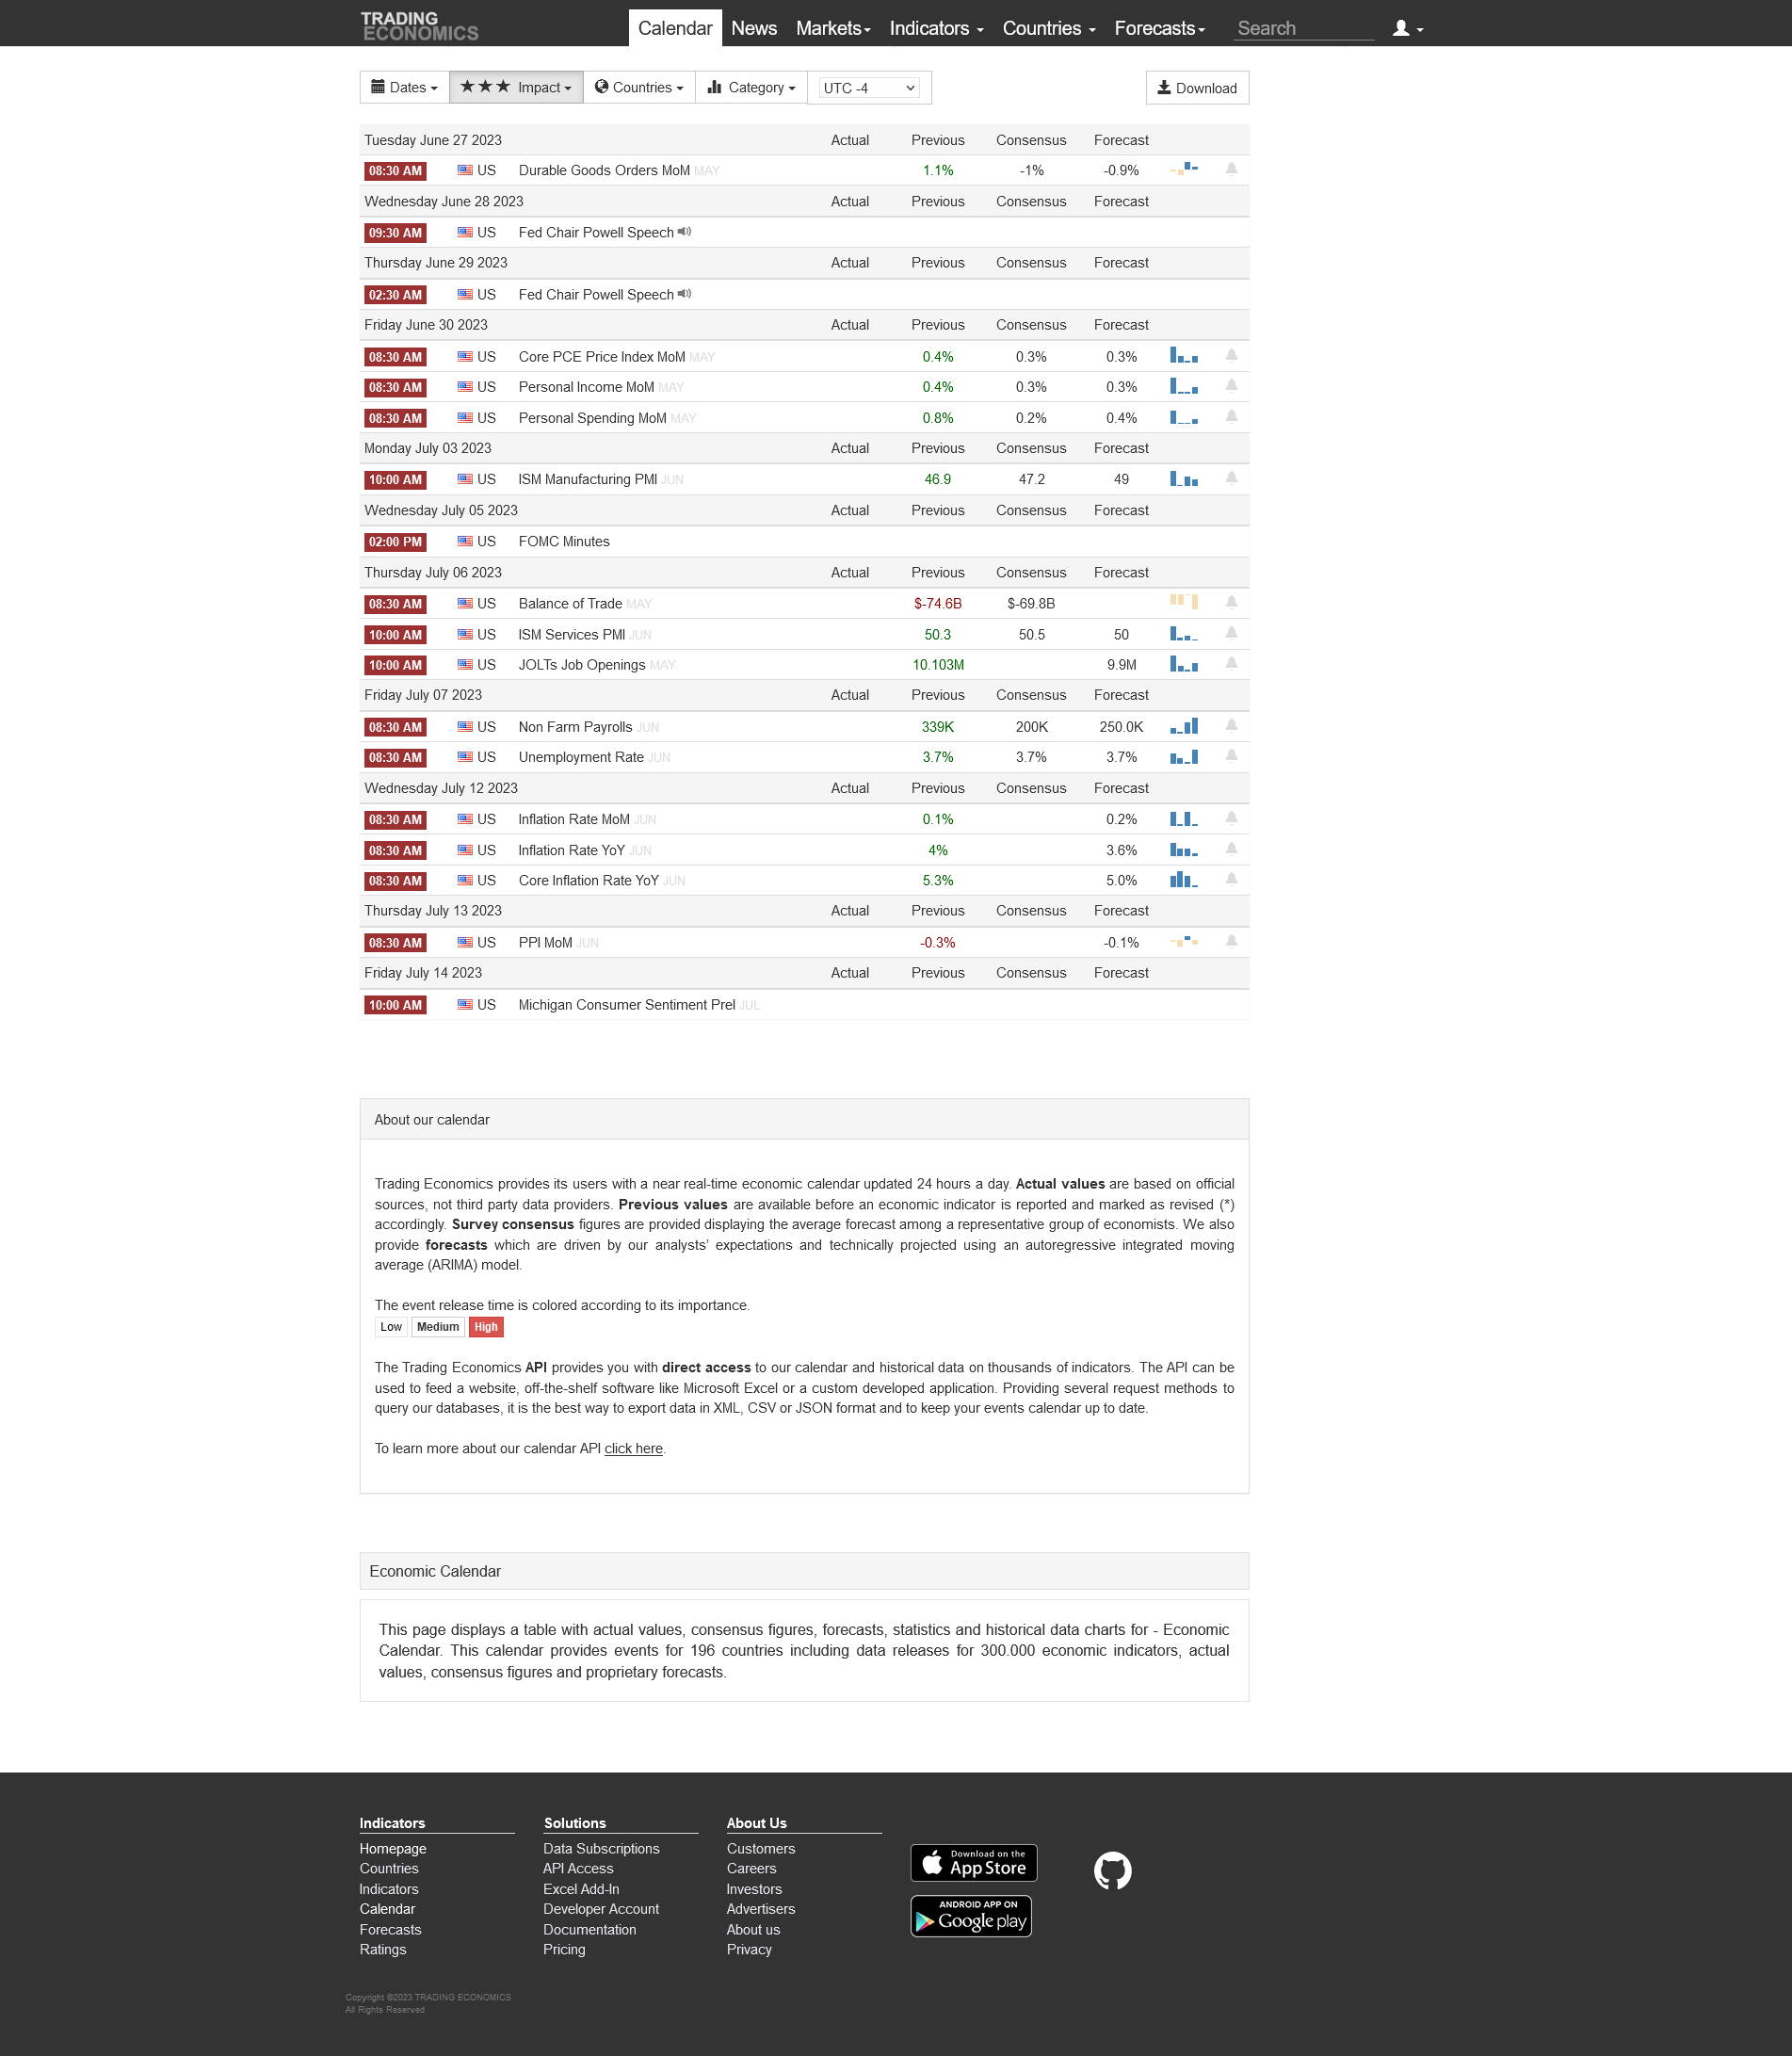
Today’s Economic Data Courtesy of Trading Economics dot com. Be sure to refresh the date at the top left.