

Price, Price Spread, Lagged Price/Volume Spread, and Binary Price/Volume Indicator
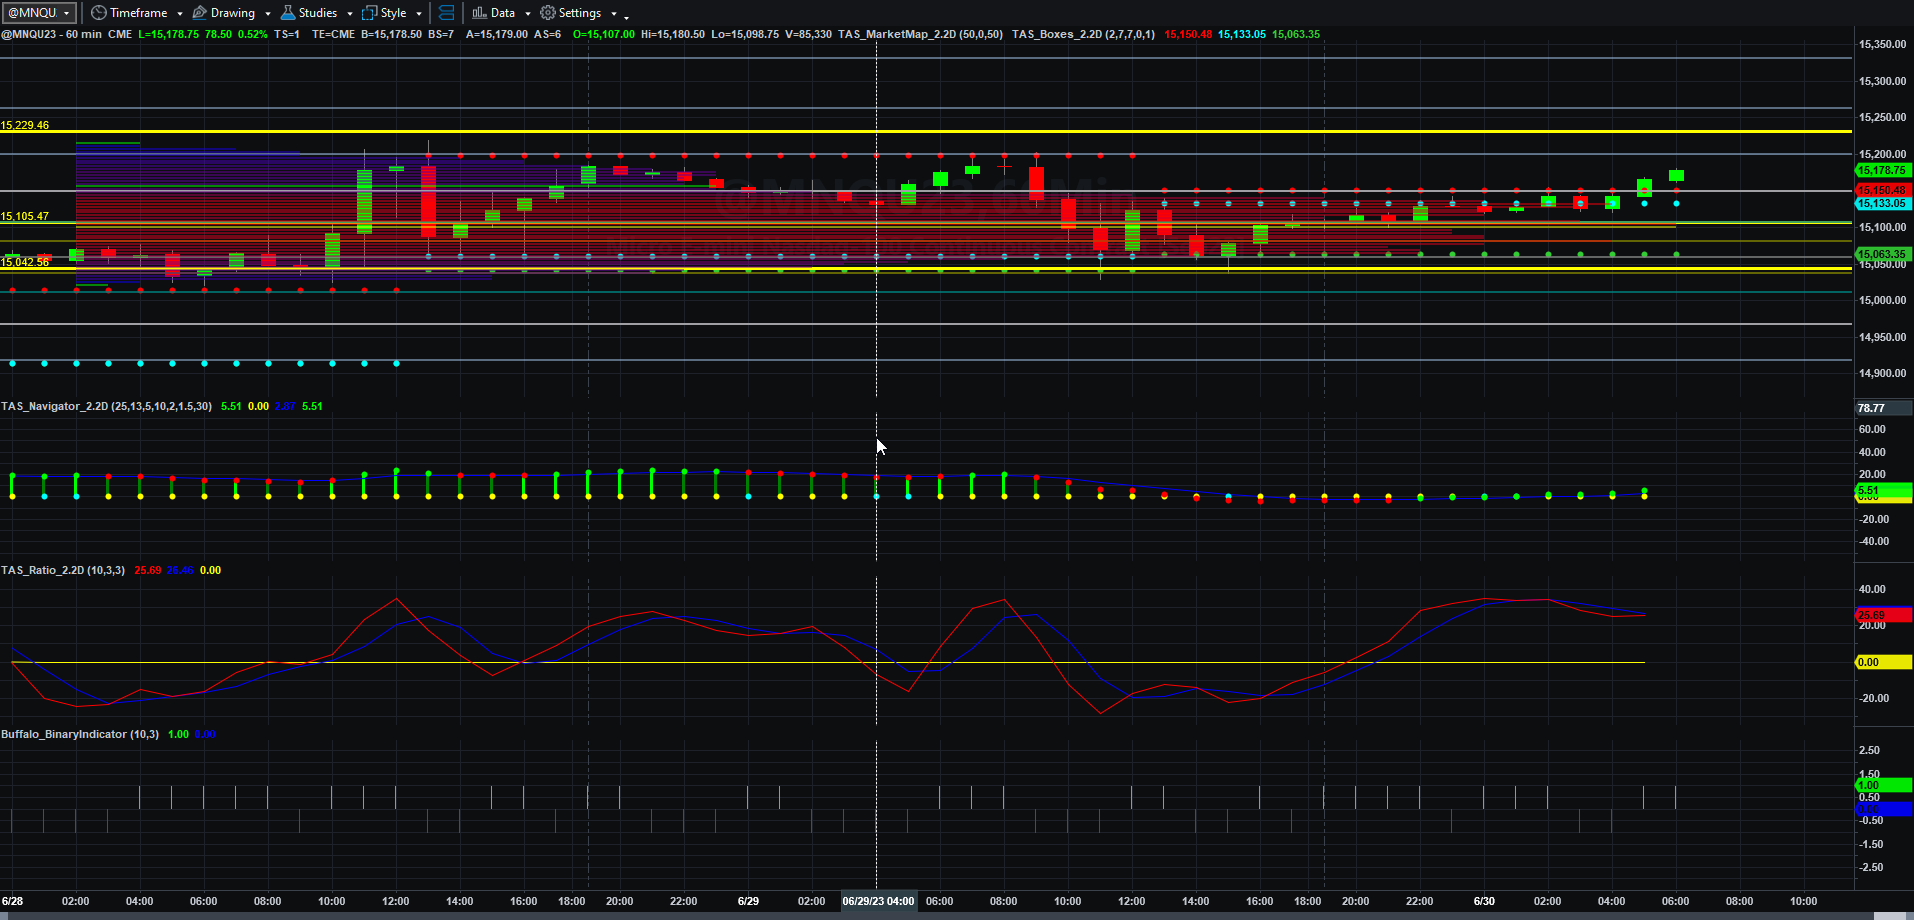
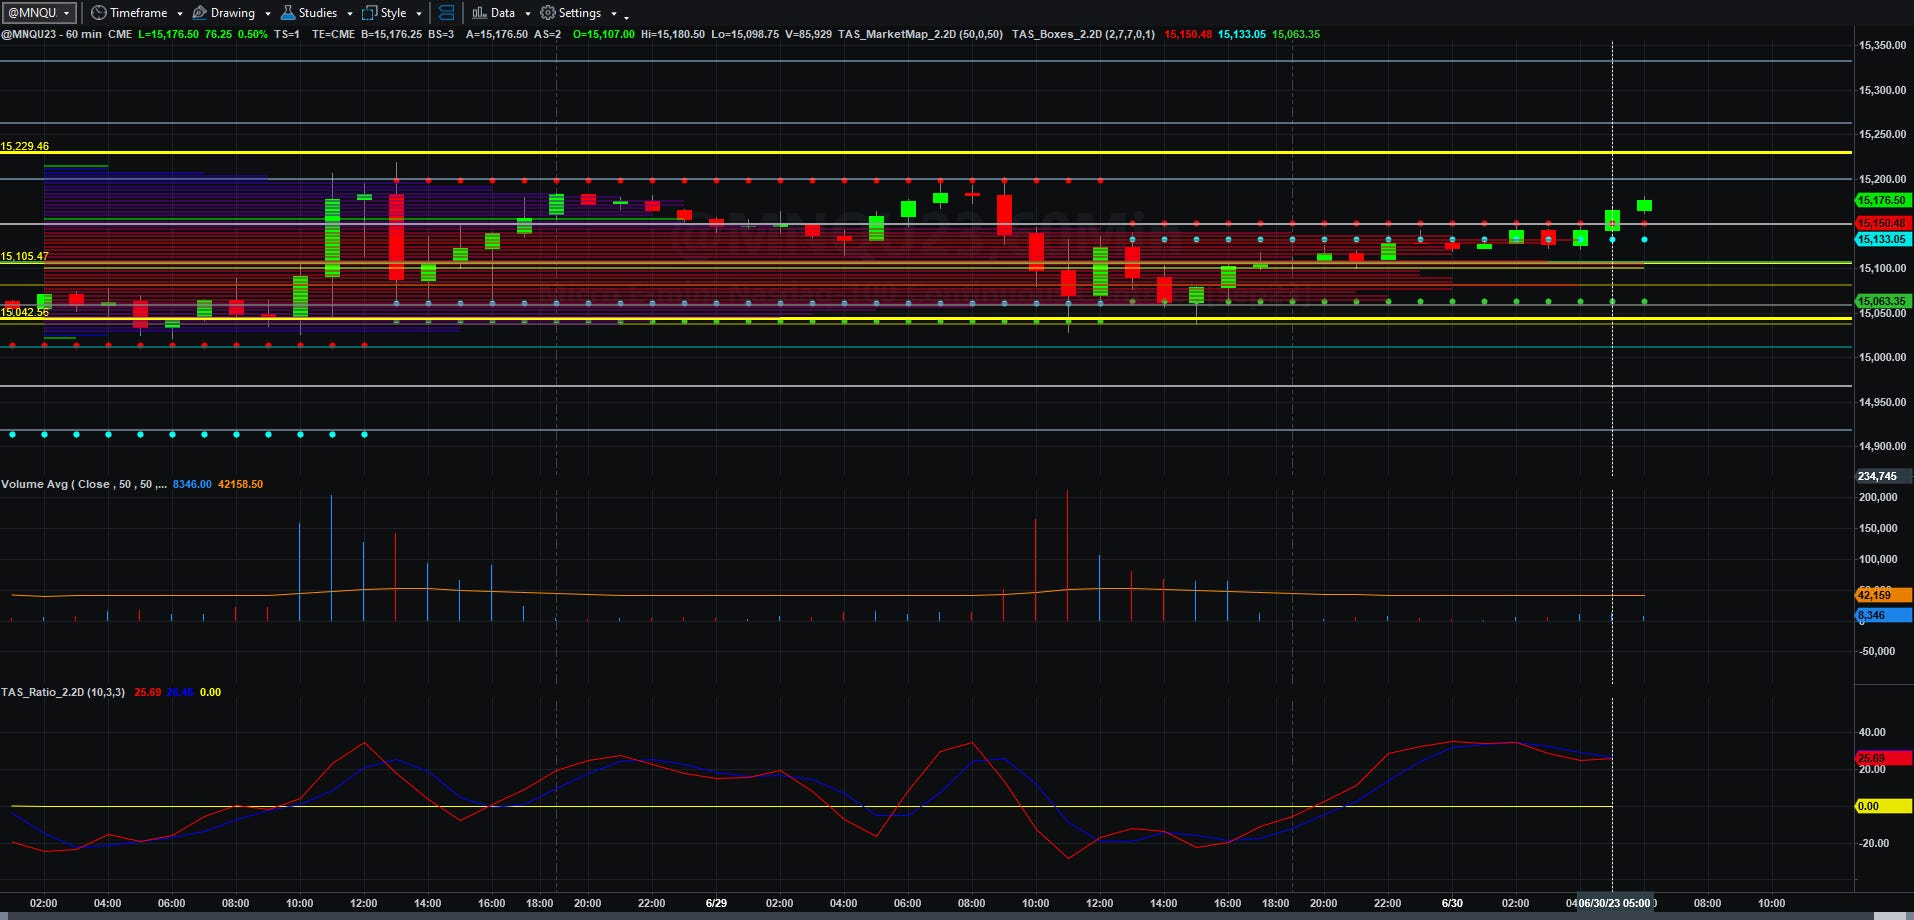
Price and Total Volume With 50-period Moving Volume Average
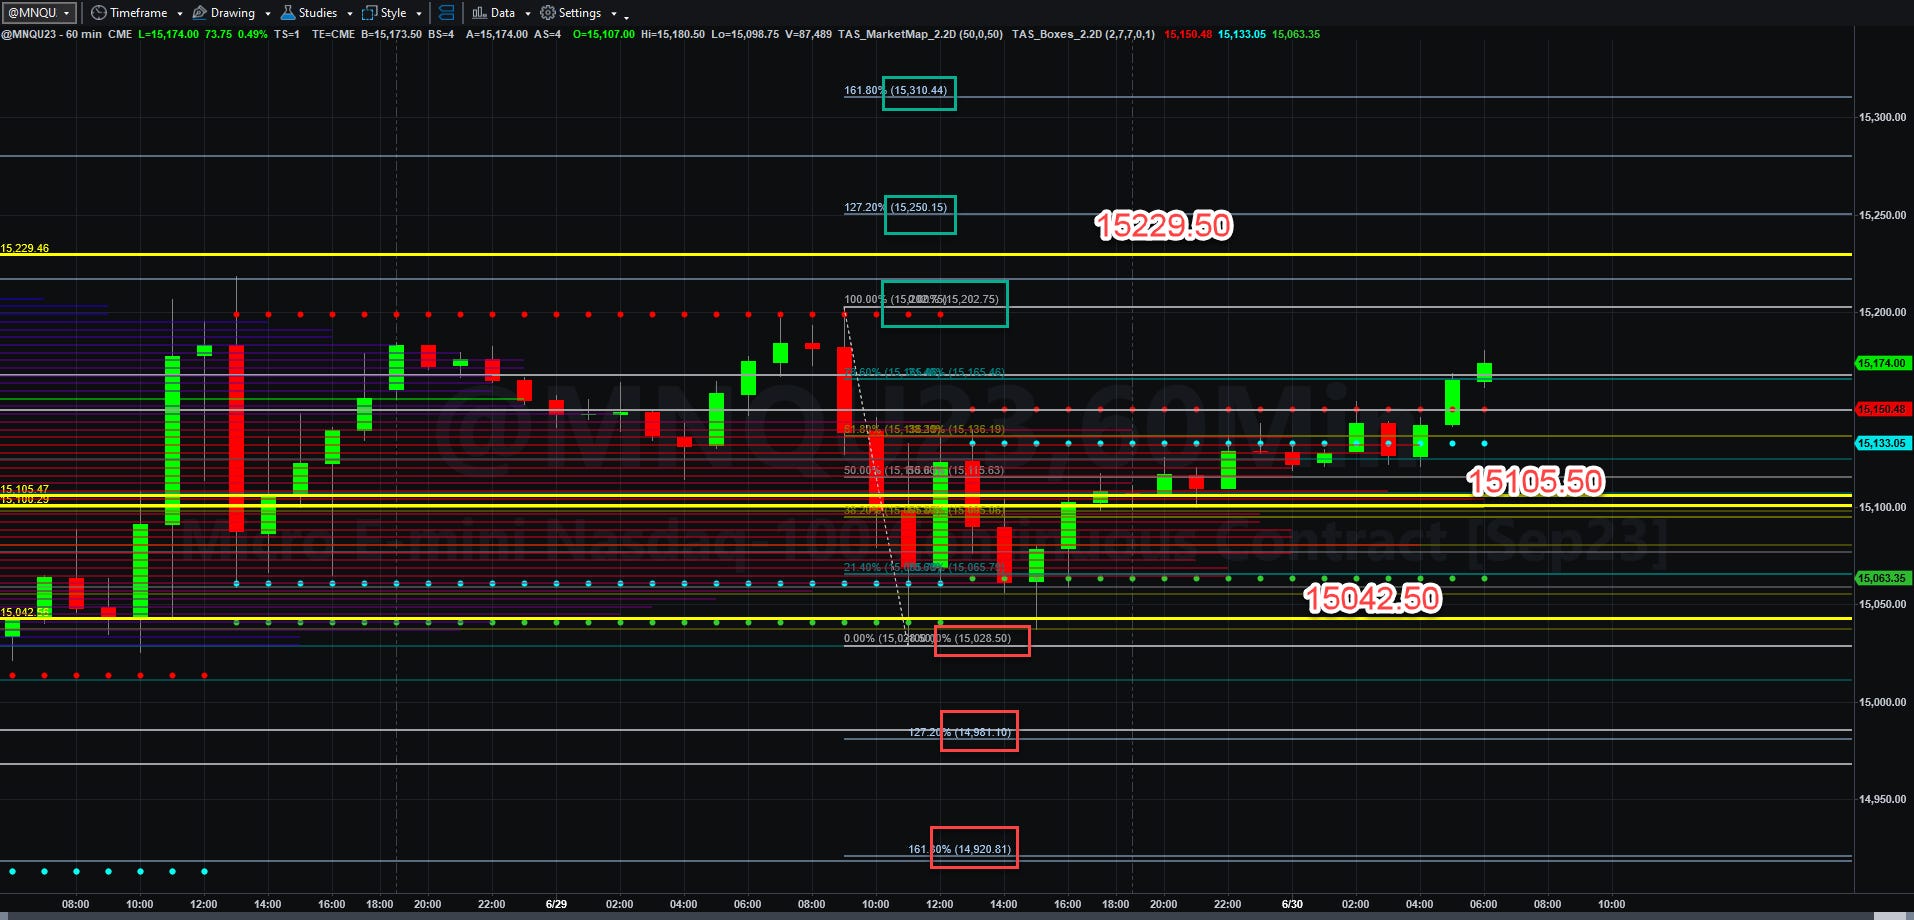
Fibonacci Price Scale With Targets
I have a lot to do this weekend, which means my ability to write this weekend may be compromised by projects of slightly higher priority, but I think one thing is clear.
All of the elements of continued inflation, and their negative effects, are still in place. Yields are still rising ( making borrowing tighter and business costs of operations stiffer ). They also put more ultimate asset risks on banks, and the value of their holdings shrinks. Despite the big government leanings of Bloomberg, states are also being punished ( or actually are punishing their citizens) with inflation. Profligate spending and entitlement handouts in blue states are causing people to leave states for lower tax havens like Texas and Florida. When they take their businesses with them, state budgets and state pensions suffer. More of the spending and inflationary pressure is put on the suckers who say put.
Commercial real estate, destroyed by government-mandated ‘covidiocy’ shutdowns, is still a threat to growth and to urban economic stability. Rates for commercial and even multi-family residential properties are still an issue. That will not go away any time too soon.
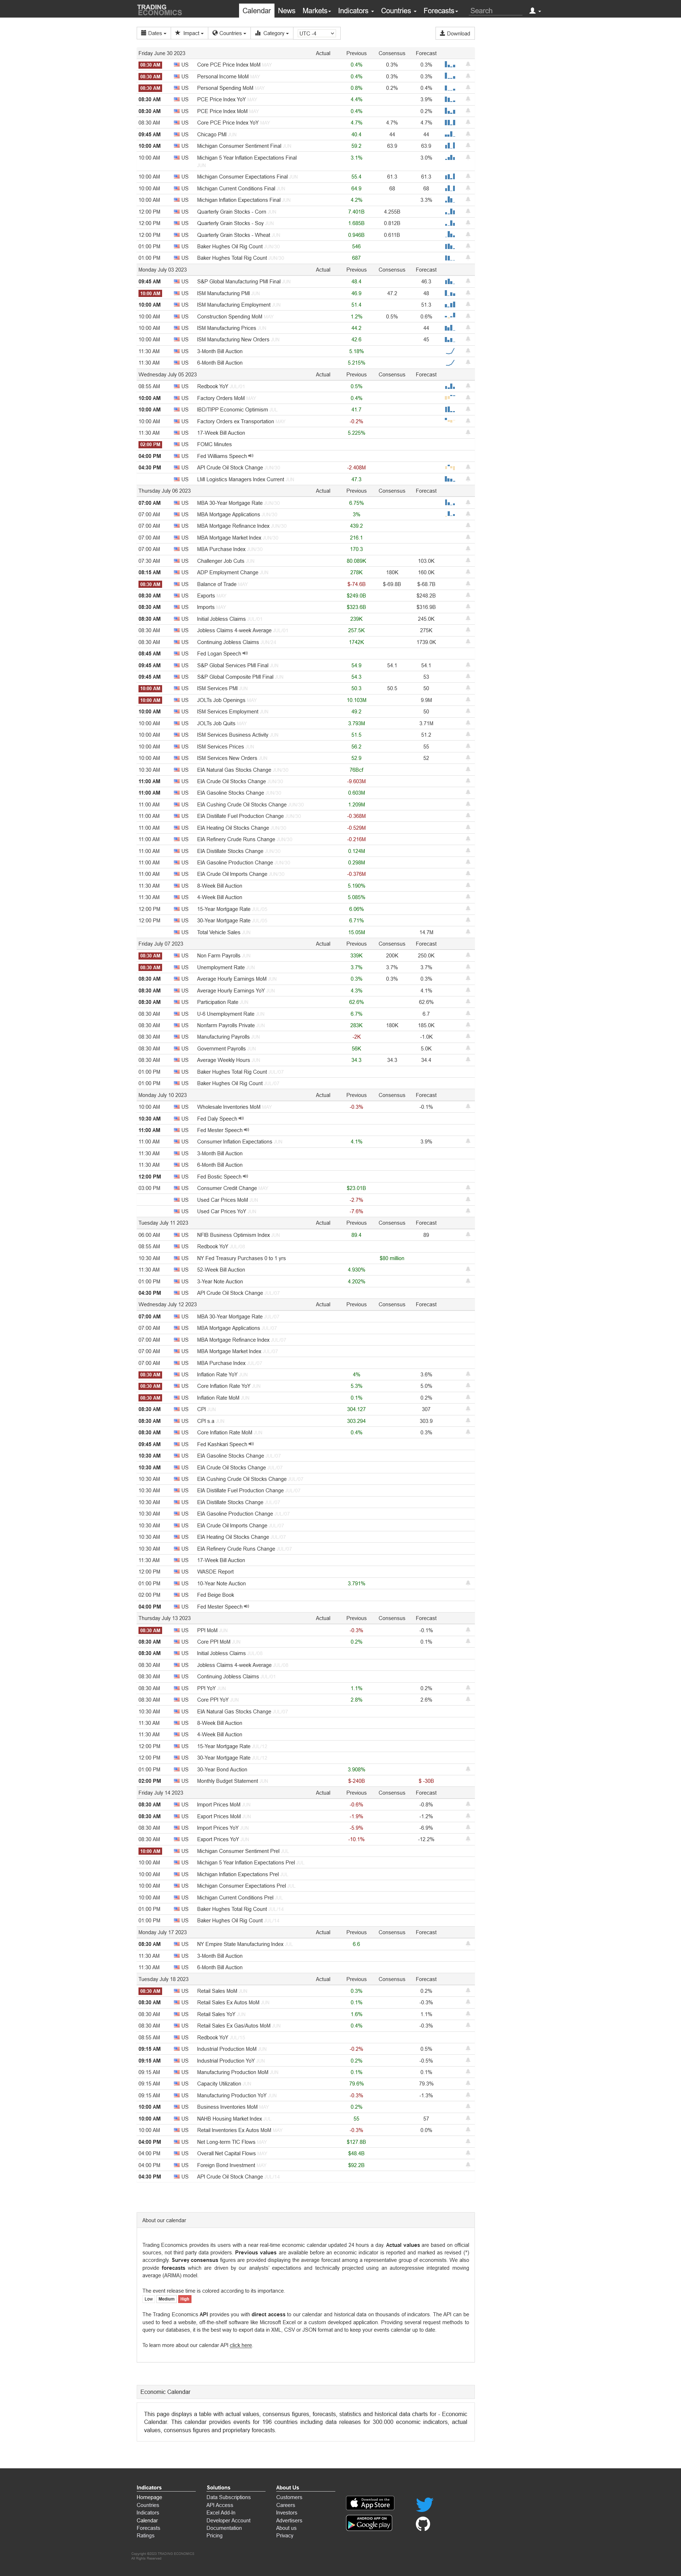
Is inflation really cooling? There could be deflationary/disinflationary effects in commodities, but at the street level, prices are still rising. You saw last night’s post about consumer spending rising above their net savings (and if you look at the forecasts on the Trading Economics chart below, that is expected to continue). We will simply have to watch what this data and other data from the Fed and Fed governors will be in the future to get a real picture as to whether inflation is really cooling. Spending at the Federal level is STILL out of control, no matter what else happens, until at least January 2025.
I think I better get to looking at the charts.
If MNQU23 can remain above 15105.50, it has a good shot at taking out 15205.75 and rallying to 15250 and 15310.50 by Monday if buyers predominate.
If not, we could get another selloff back to 15028.50 and continued pullbacks to 14951 and 14920.75 by Monday. I have no idea what will happen next, as this number could drive early price action as we get into July trading.
No trades for me yesterday as I solved the riddle of the UPCs. I will simply wait to see what happens with trading this morning. If nothing arises, I will simply have to wait again until next week.
Not sure yet if I will write this weekend, but check your email boxes just in case.
Have a productive Friday and a peaceful weekend!
Today’s Economic Data Courtesy of Trading Economics dot com. Be sure to refresh the date at the top left.
You are correct about CRE - there are a lot of blown deals out there with undercapitalized owners. Probably not going to be as bloody as 2008 because the deal structures have a lot more equity than then, but it's already getting sporty. Just got a $32MM refi over the goal line and the rate cap went up at the last minute pricing in higher rates in the future.