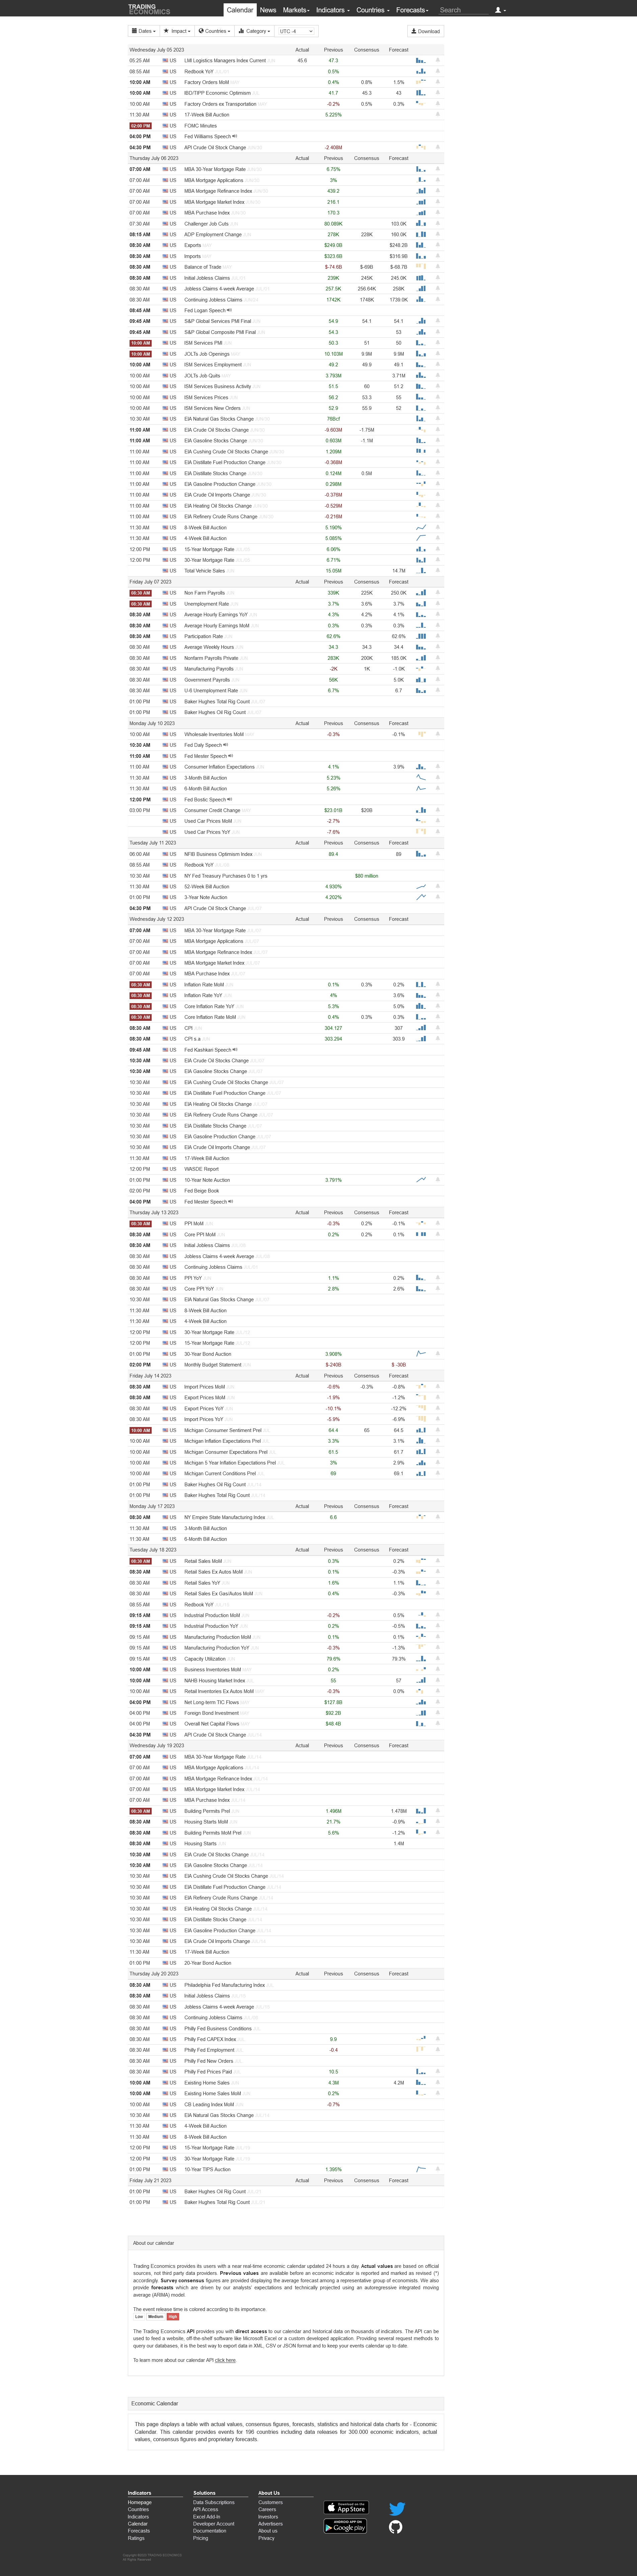
Price, Price Spread, Lagged Price/Volume Spread, and Binary Price/Volume Indicator
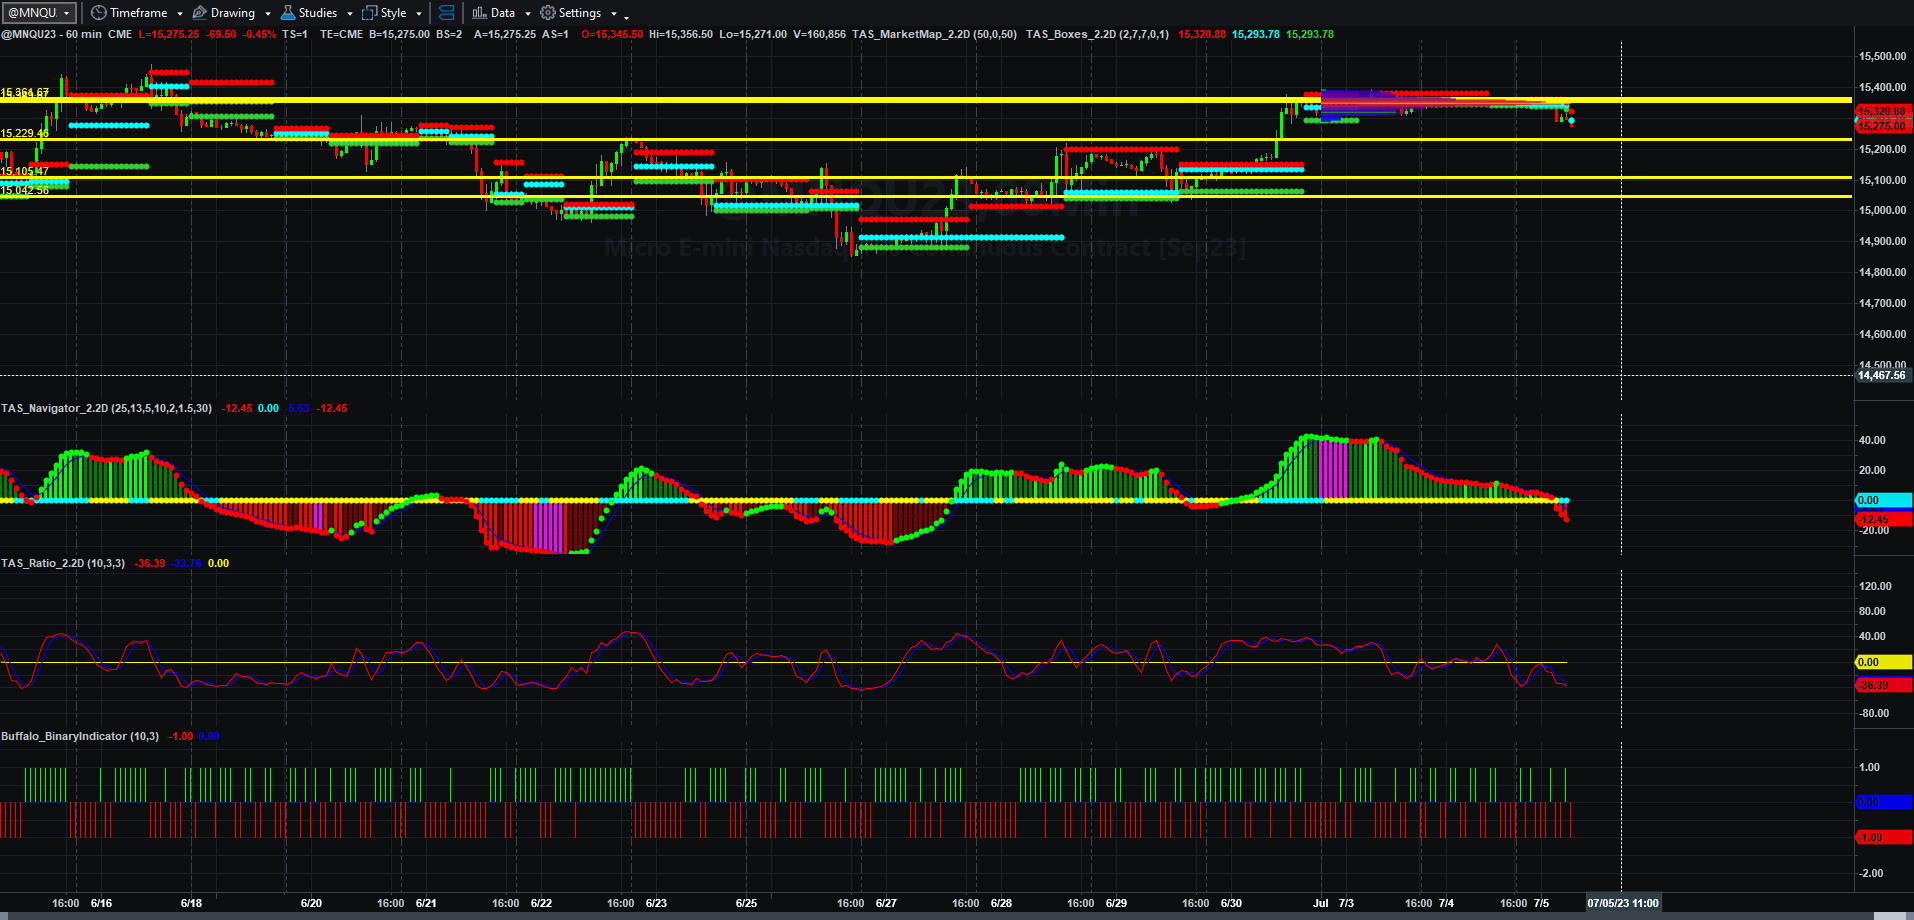
Price and Total Volume With 50-period Moving Volume Average
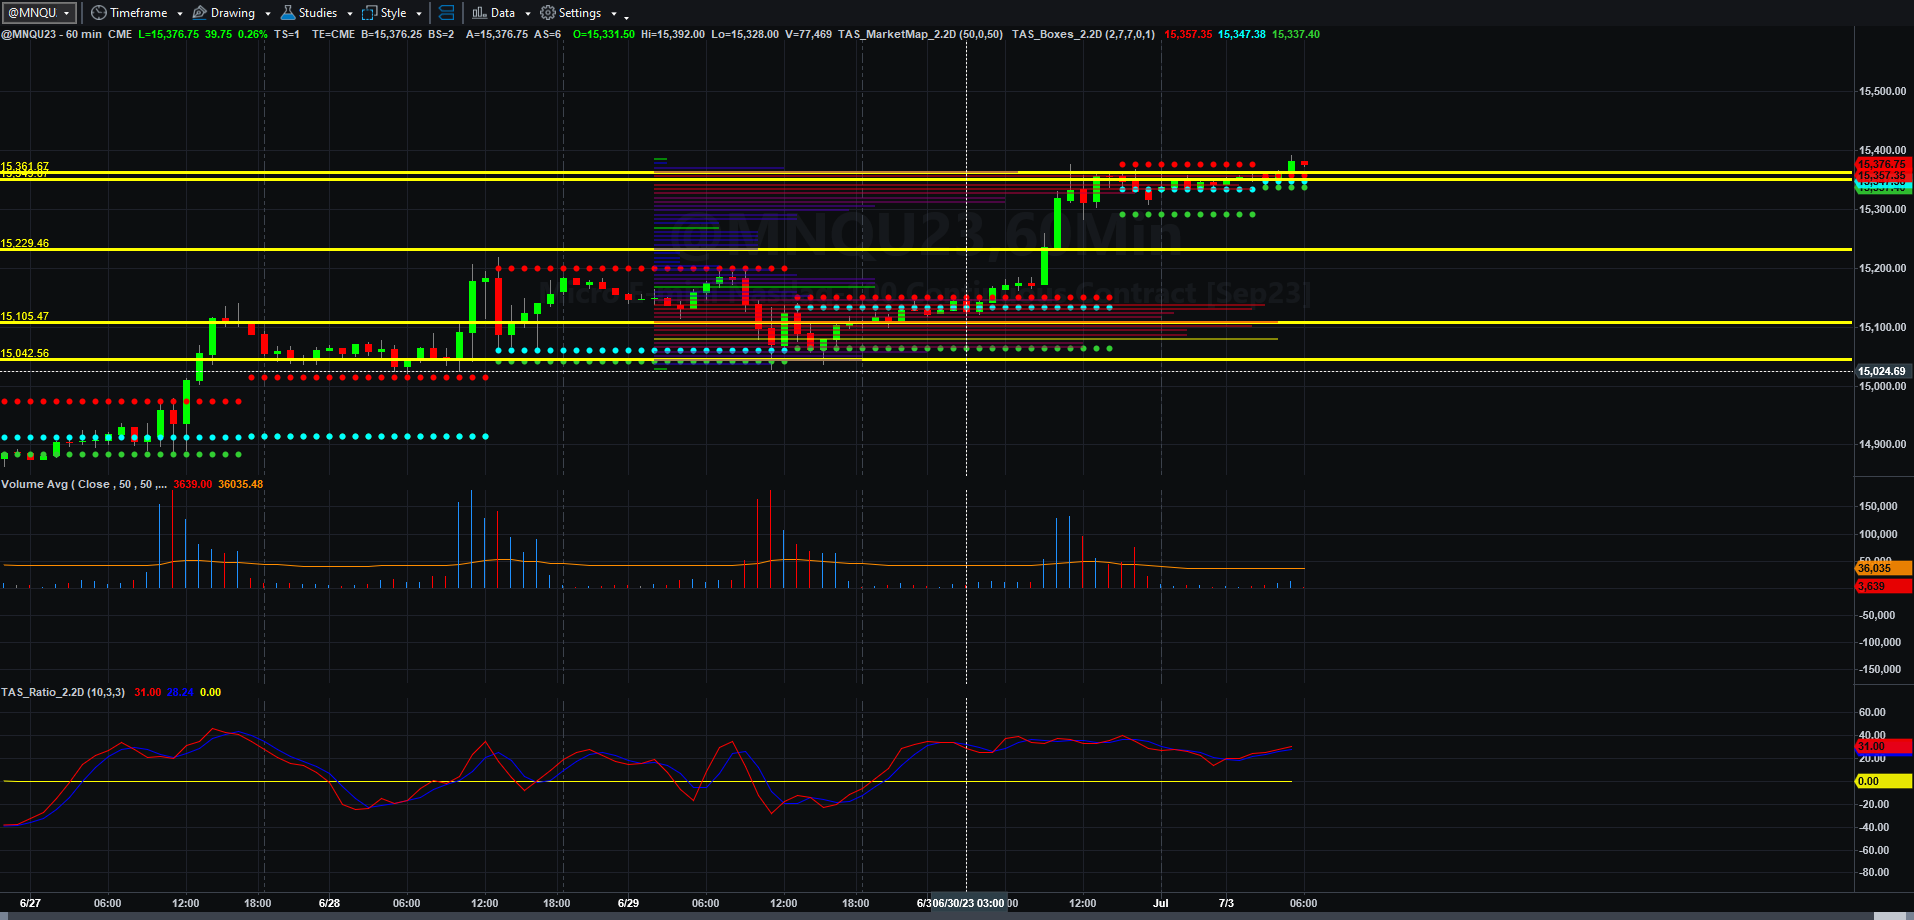
Fibonacci Price Scale With Targets
The first half of 2023 is over. Market returns have been rather significant (but the Fed has been busy in previous months printing, and some companies have regained footing after the ‘covidiocy’.
What could that mean for the future? Take a look at what Daily Chartbook presented a few days back:
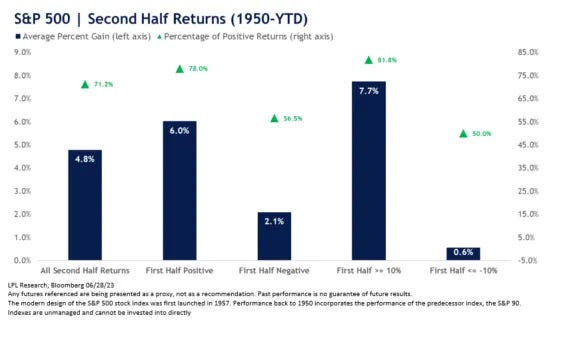
What this data tells you is that for the $SPX since 1950 when the first half provides a positive return for the first 6 months of >10% per annum, then there is a 81% chance that the second half will be positive too.
Will the NASDAQ do the same? It is hard to say, it is however, pretty easy to see that other than the seven large cap NASDAQ stocks (from the same collection source, Daily Chartbook) that may or may not be the case:
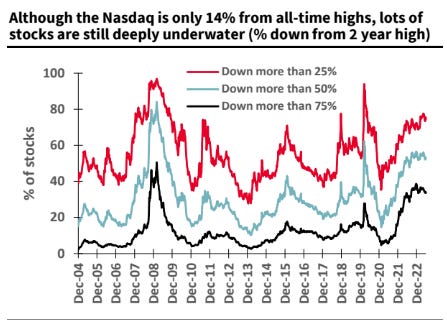
That chart, from Societe Generale, the French financial services conglomerate, shows a large chunk of NASDAQ is underwater and in some cases severely so. That could in fact be BULLISH longer term, but it shows that there is deep distress that could in fact get WORSE as interest rates rise. That would mean many of these companies could be culled from existence through financing woes, as most speculative technology companies can be.
There is also added confusion by the Fed (and from other Federal agencies) as to what inflation really is, and as to whether the need to raise Fed fund rates is the proper thing to do. To prevent rampant malinvestment, having proper “risk-free” rates of return IS a good idea, meaning the rates probably should be increased. The other thing to do is to end all Federal subsidies wherever possible, as by definition, anything subsidized is unprofitable otherwise. Unprofitable projects need to die unless citizens are mortally threatened. That subject will be for later debate.
Even with all this, it seems being long stocks is a very crowded trade. Boomers have almost everything at the casino table, and even Gen Z’ers are hopeful, despite the valuation and economic issues that face the US and world economies. We will simply have to see how this works out. I think the jury is just now going into deliberation on that subject myself.
Back to the charts.
MNQU23 fell as Europe opened, perhaps because of negative news about the PRC’s economy. One reason I expanded the Fibonacci scale is that any selling could in fact drive prices back to levels prior to PCE data last week, but only time will tell, it could also launch to the moon as well, and that is also reflected here.
If MNQU23 can remain above 15229.50, it has a shot and regaining 15361.25, the swing high at 15392, and potentially even 15491 and 15616.75 by Thursday.
If not, Then we likely see a correction in MNQU23 back to price support around 15200 to 15210.25, and failing that support, a selloff back perhaps to 15106.25. If selling is voracious, the gaps are large enough to drive prices back to 15042, 14929.50, and 14084 by Thursday or Friday. That sounds like I am being bearish. I am NOT in this case, I am only acknowledging the possibility of price cascading to levels that existed prior to the PCE data euphoria.
It really depends on who shows up and what reaction to Fed pronouncements are this afternoon in all likelihood.
That is it for now. I did not trade on July 3, so nothing to report there. More will be coming soon. Thanks for supporting this Substack. If you like it, press that like button!
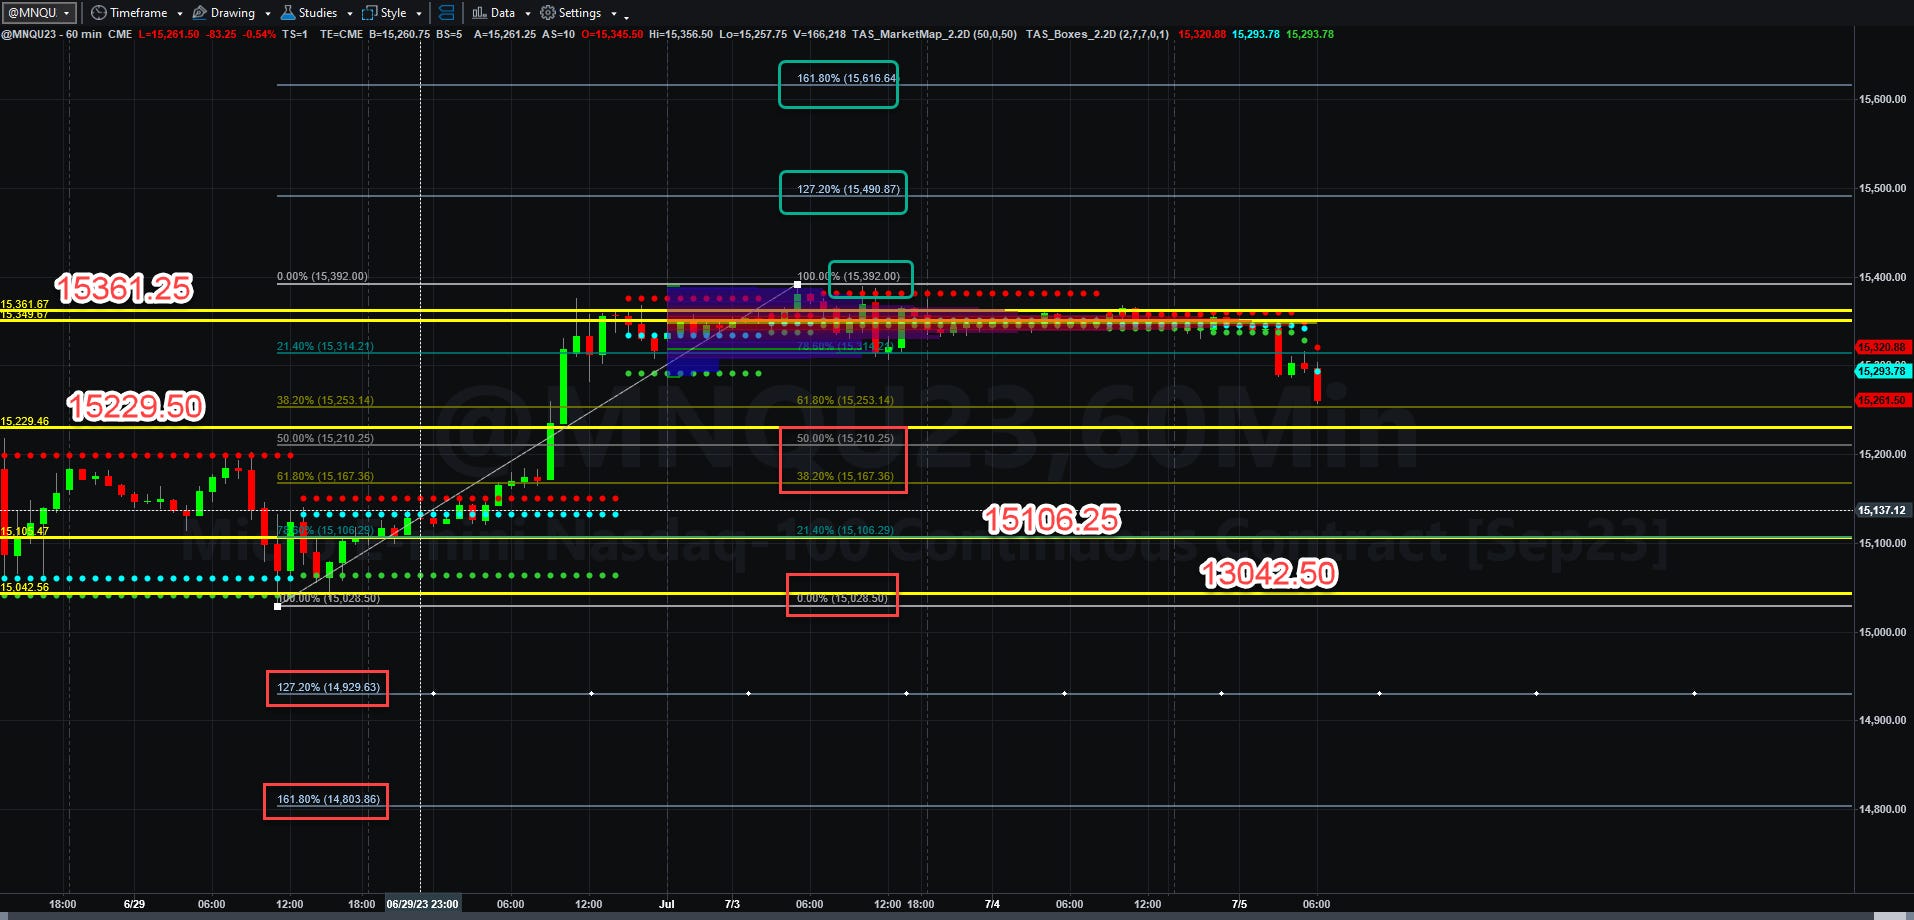
Today’s Economic Data Courtesy of Trading Economics dot com. Be sure to refresh the date at the top left.