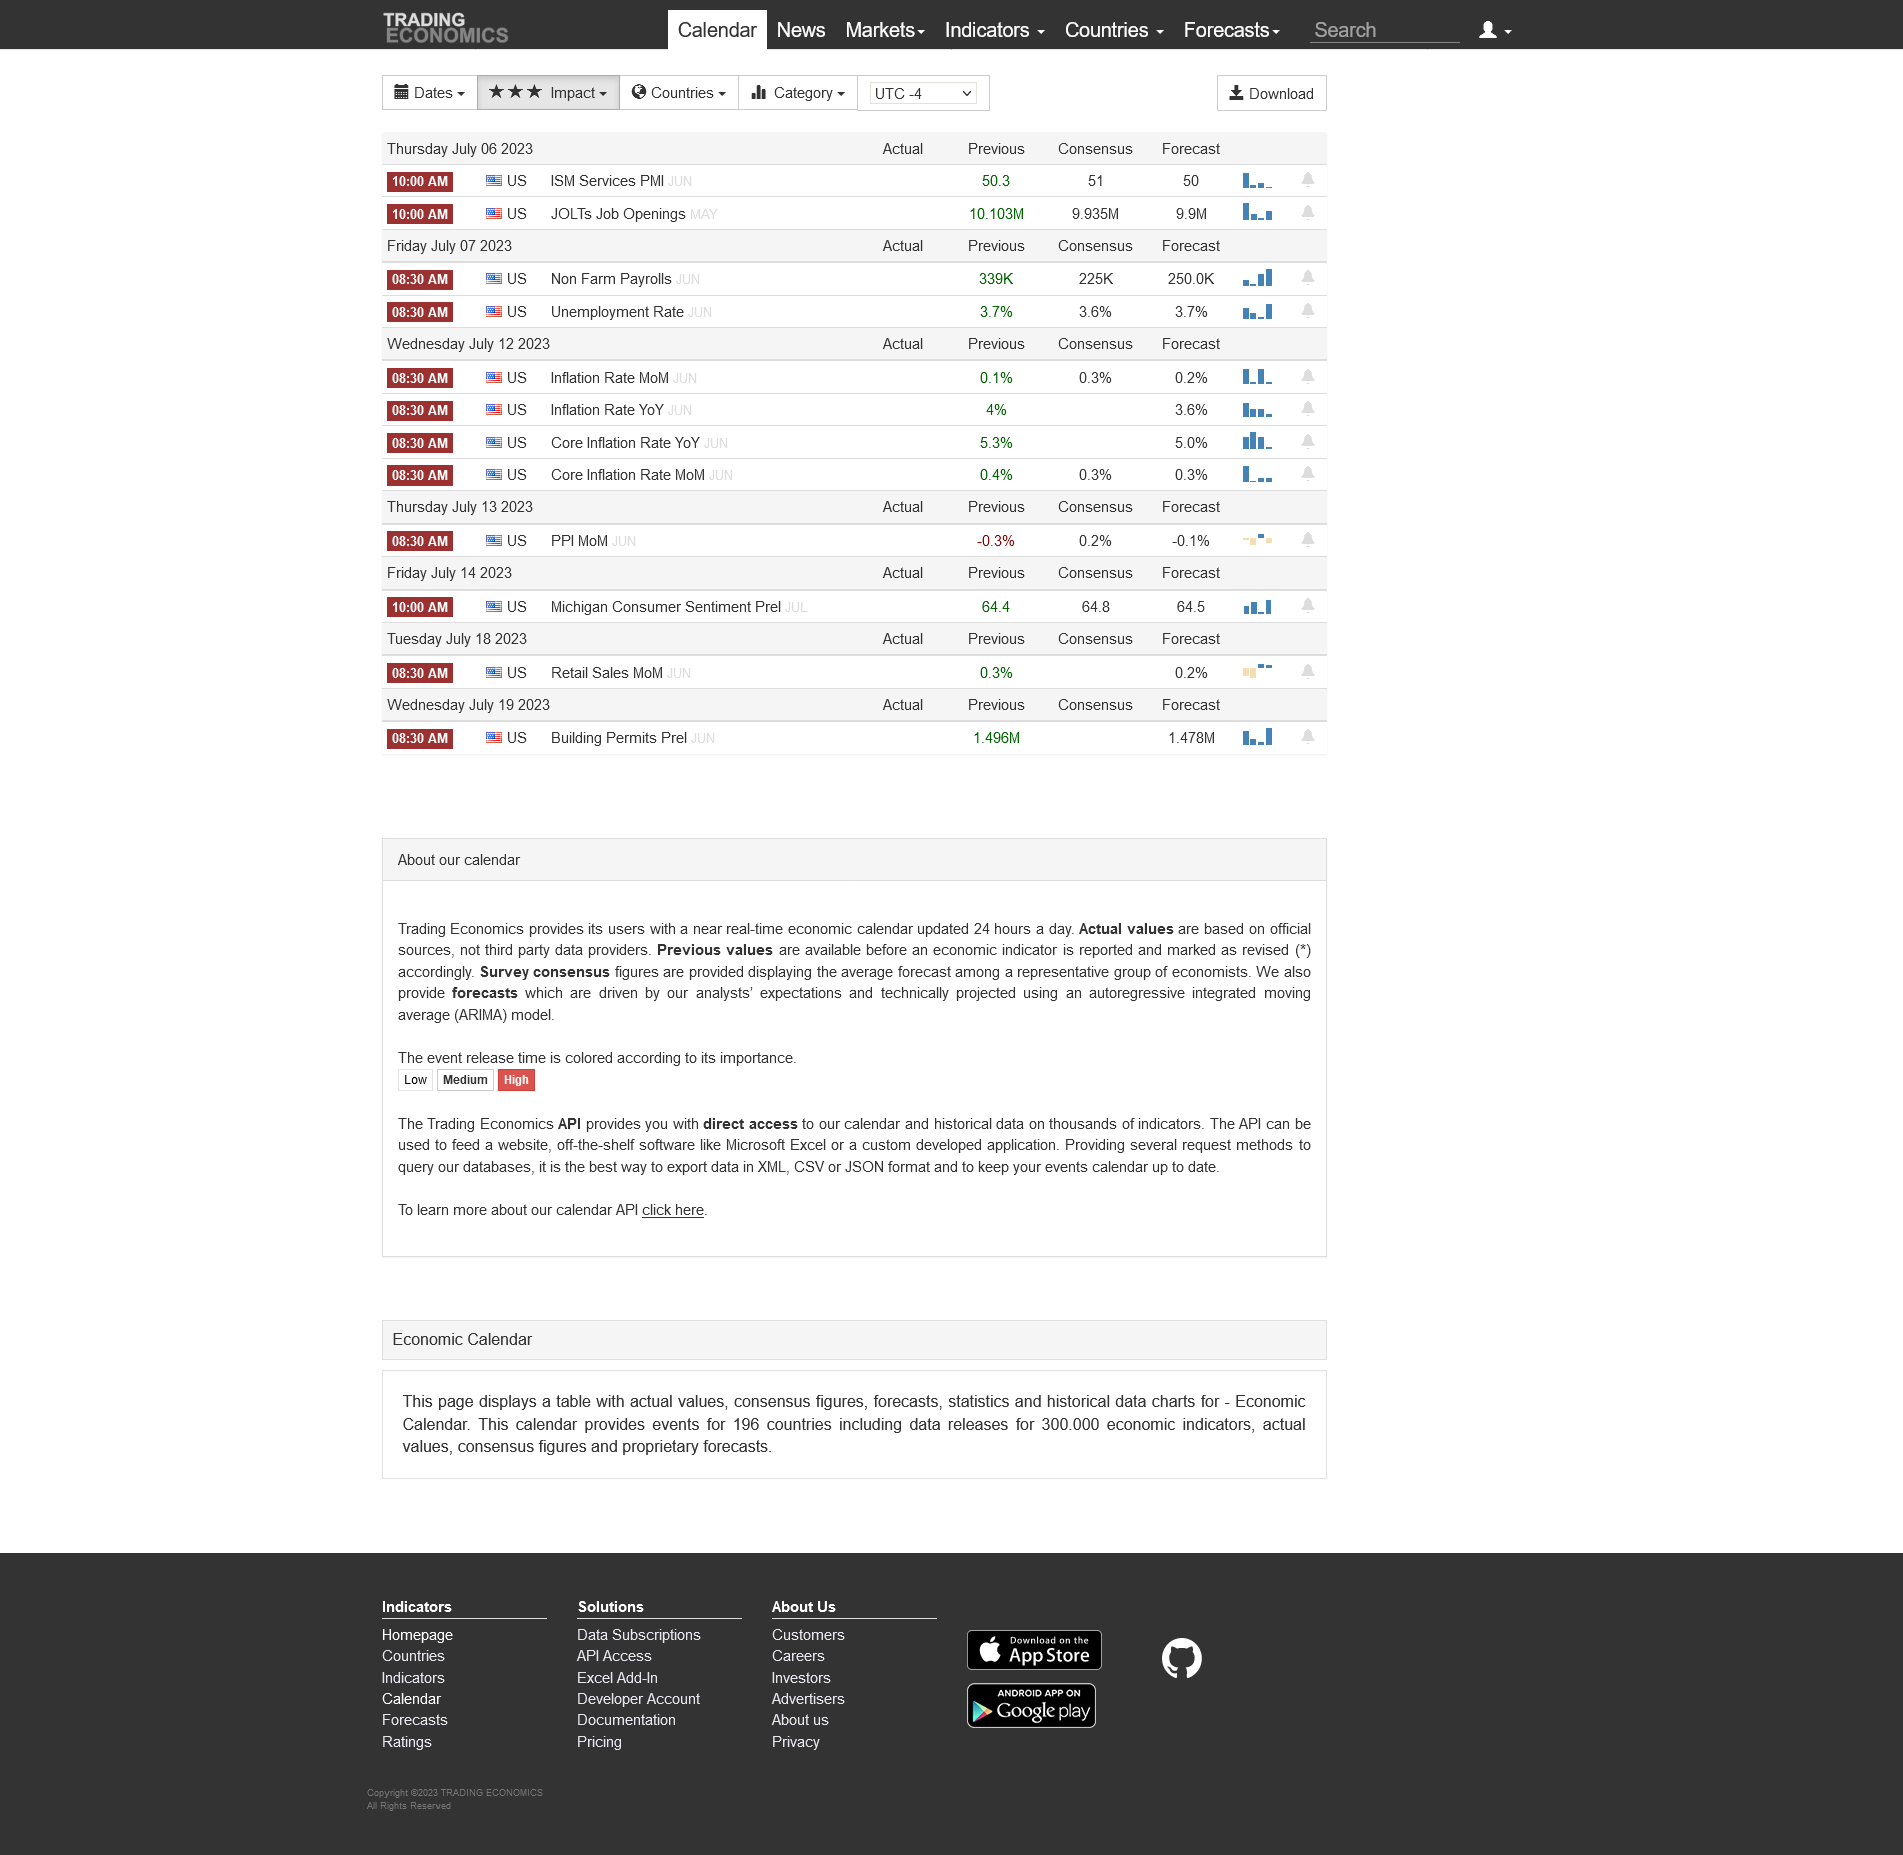
Price, Price Spread, Lagged Price/Volume Spread, and Binary Price/Volume Indicator
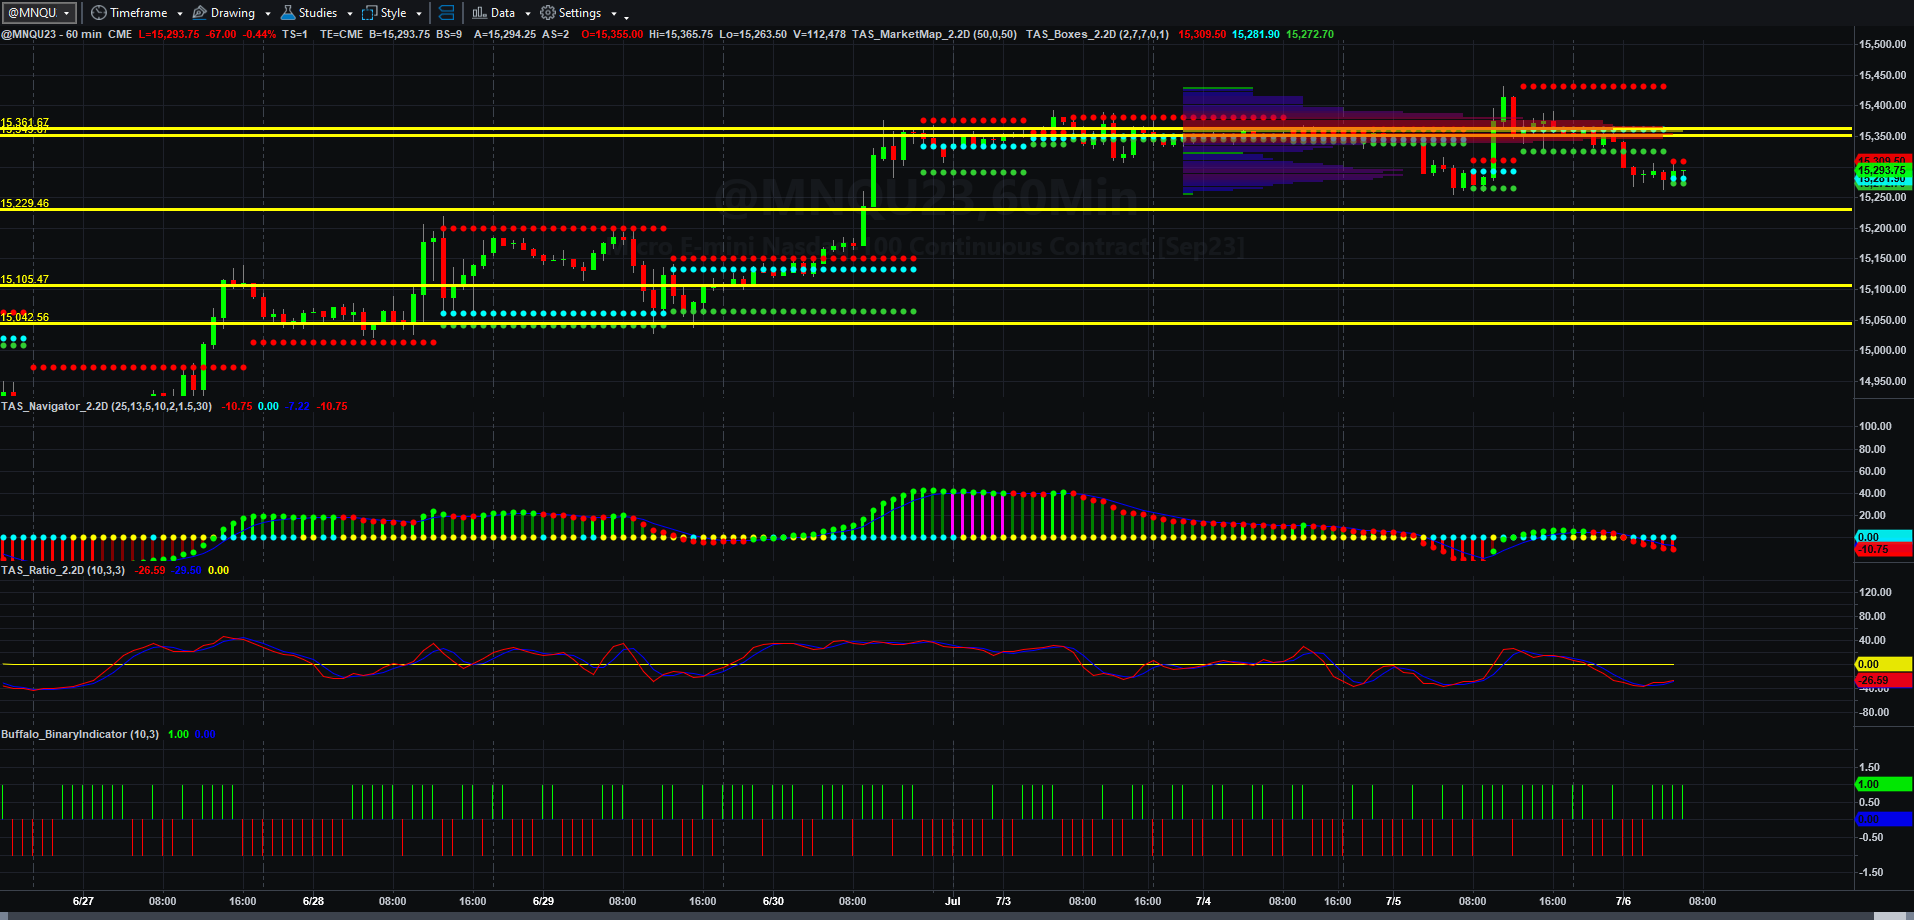
Price and Total Volume With 50-period Moving Volume Average
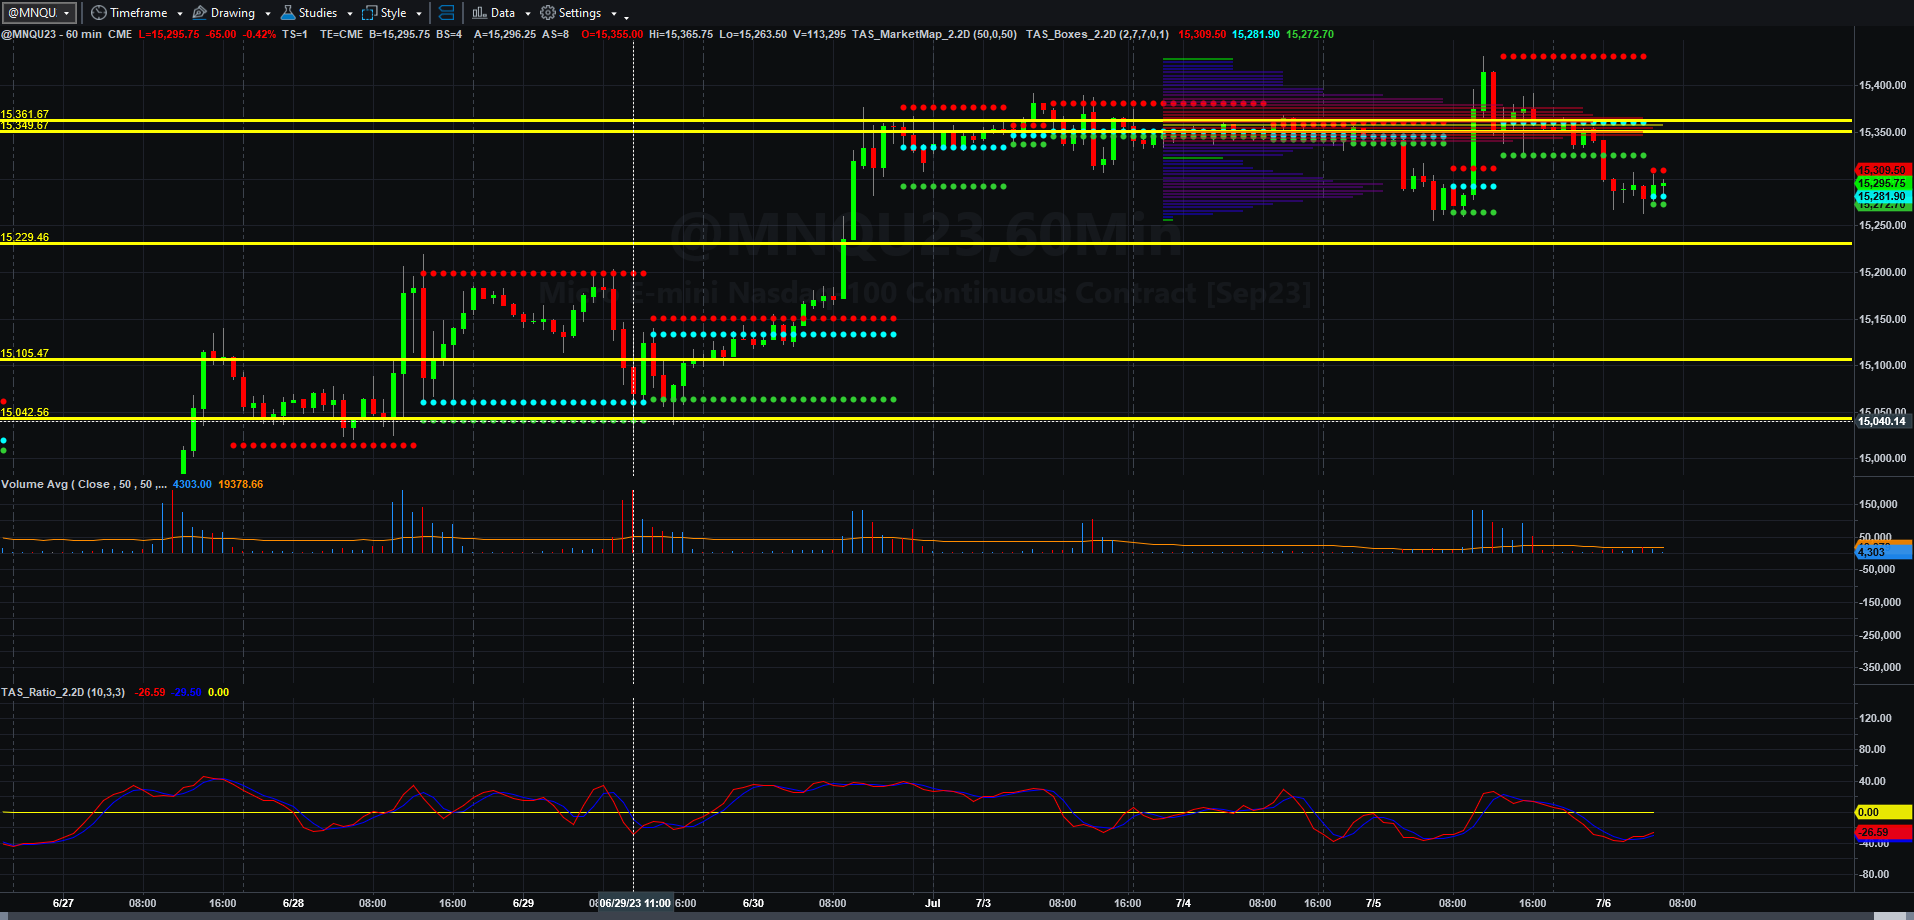
Fibonacci Price Scale With Targets
I am forced to deal with an alternate time commitment today that limits writing, but the data I have read today still points to a very mixed picture with some scary and some positive things on the near horizon. If I have time this evening, I will create a separate email and send it to you. Perhaps I can cover that in more depth this weekend also.
Let’s get to the charts.
Although the Fed didn’t make investors happy yesterday afternoon, the afternoon selloff was followed last night by mild selling that may have hit bottom around the 0500 EDT hour in Europe.
If MNQU23 can rally above 15361.75, prices could rally to the old 15431.75 swing high and beyond to 15479.75 and 15540.75 by Friday. If not, given the swiftness of the rally yesterday, the selloff could be brisk back to 15255.25 and potentially back to 15207.25 and 15146 by Friday.
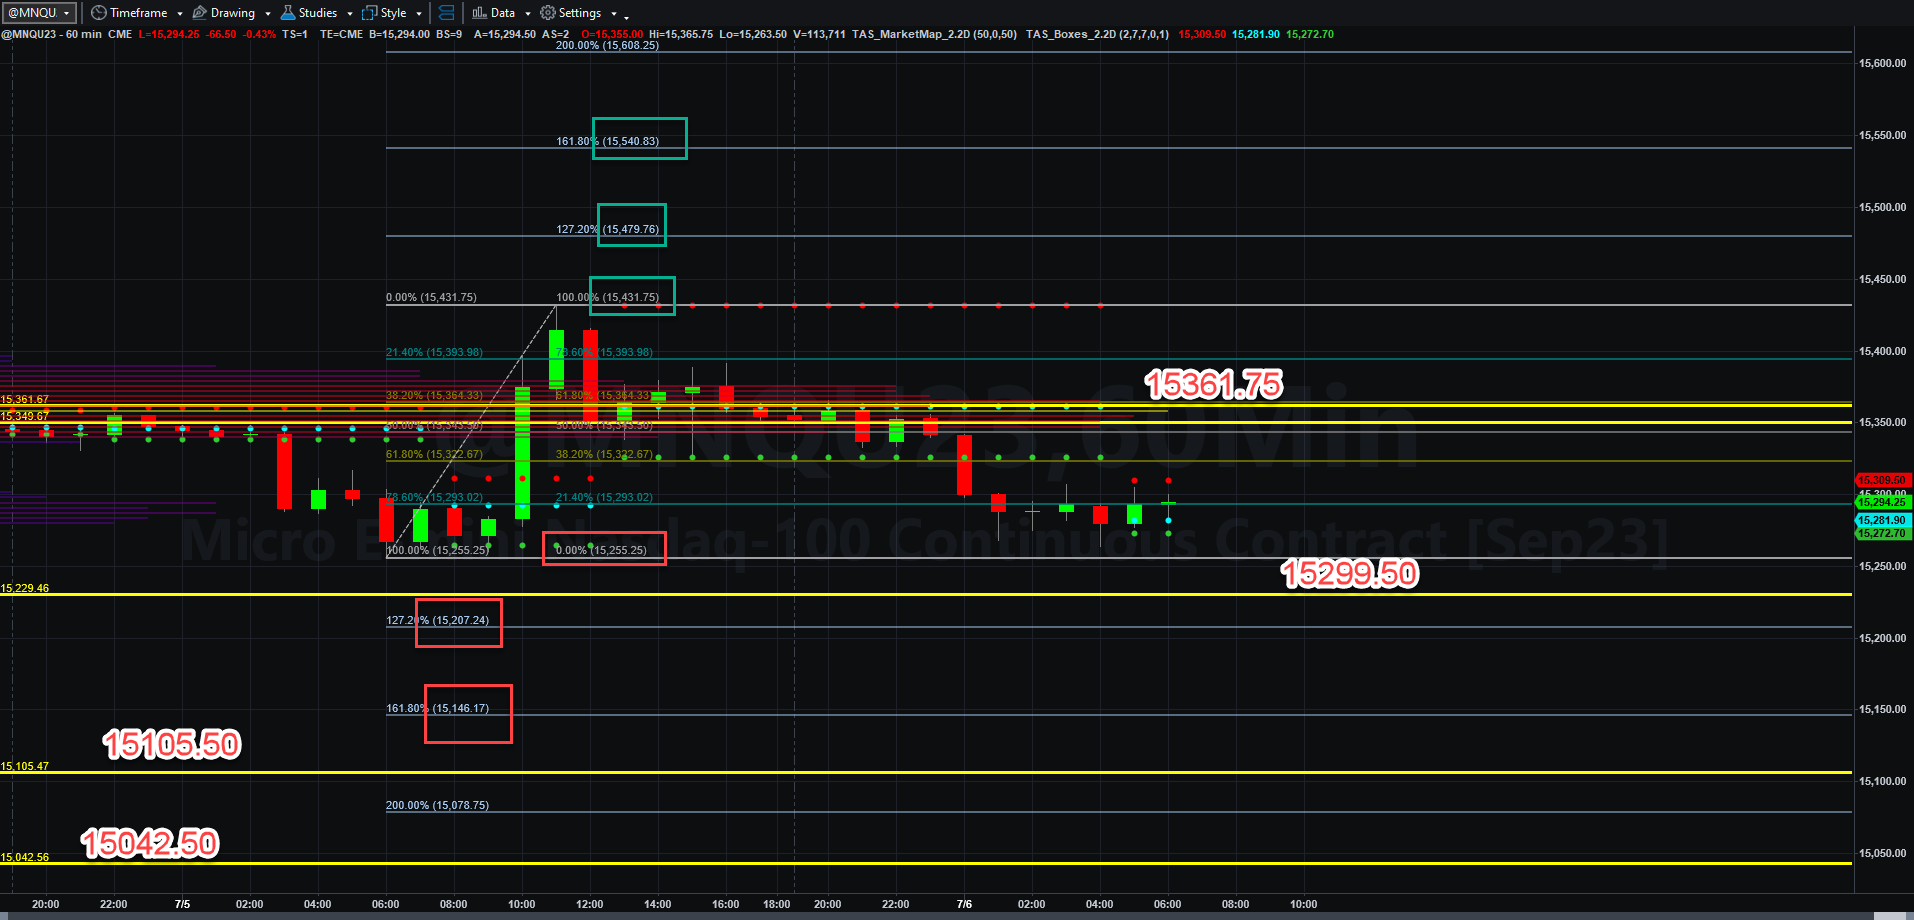
I think the ISM and JOLTS numbers may give signals as to strength in employment and perhaps economic growth into Q4. The mixed-bag economic picture probably needs to clear up before interest rate jitters spook investors away from throwing money back into equities the way they did.
I made 1 dollar net of all commissions and moved a stop too soon, as I missed the 150 NQ point rally. Over time as I adjust stop methods, I should be able to 1) trade less and 2) profit more by launching only single trades using the statistical approach to trade entries using volume profile. So far it has worked nicely.
More about that will come soon. Have a fantastic and profitable Thursday!
Today’s Economic Data Courtesy of Trading Economics dot com. Be sure to refresh the date at the top left.