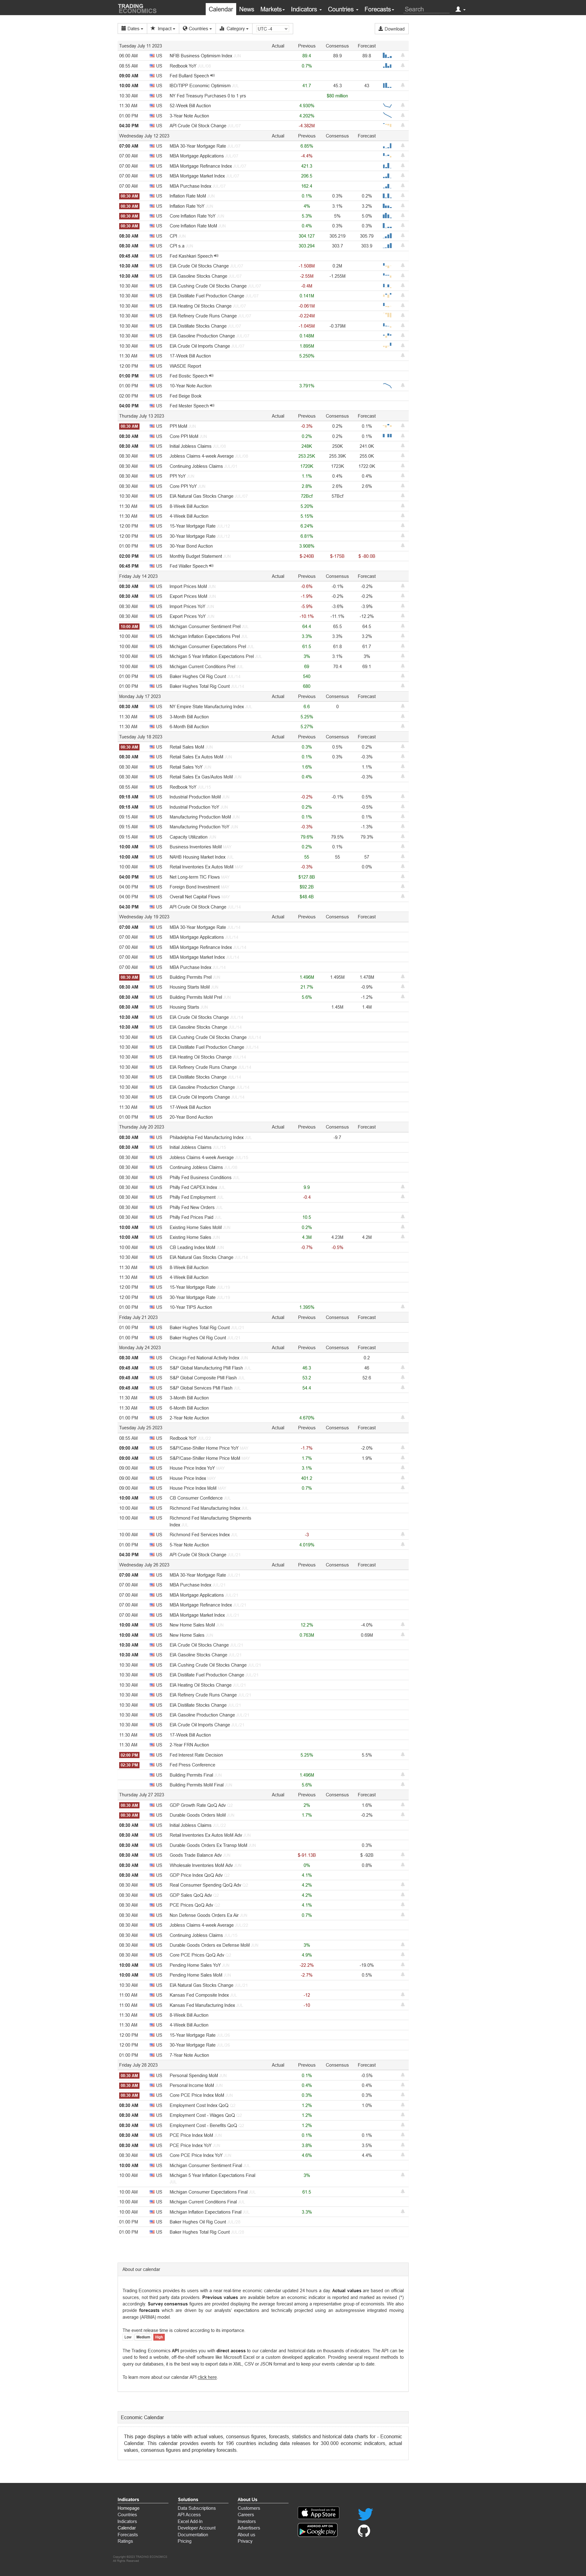
Price, Price Spread, Lagged Price/Volume Spread, and Binary Price/Volume Indicator
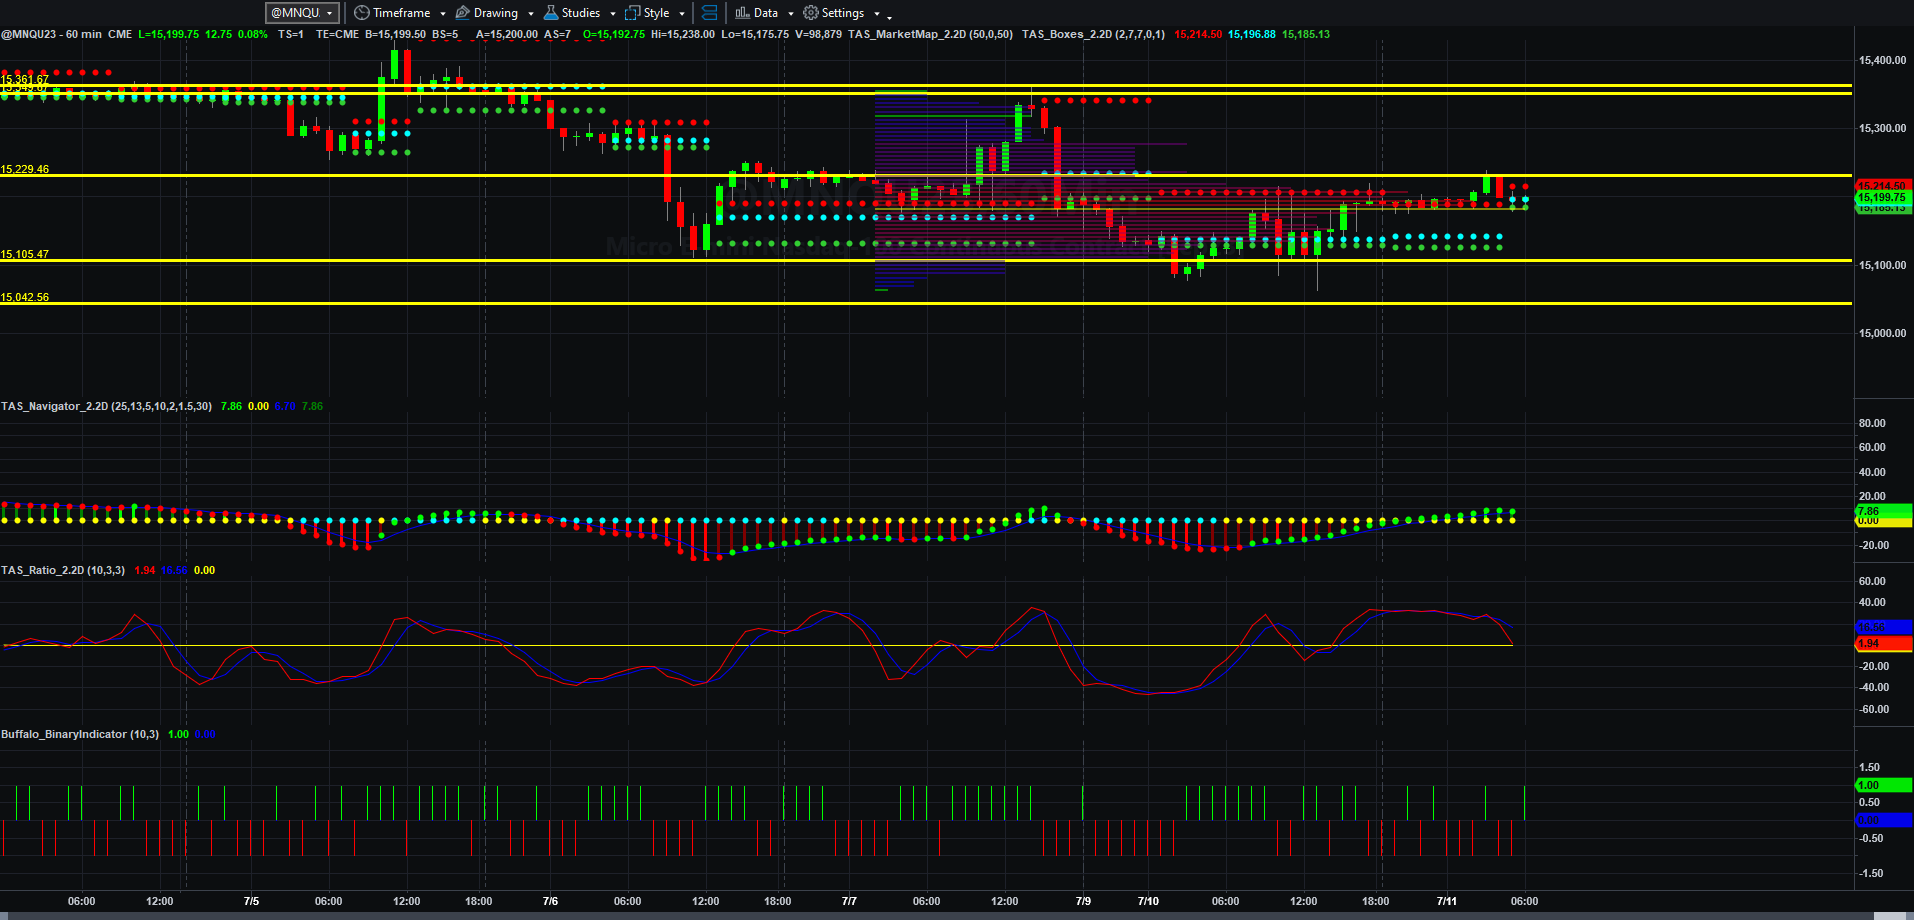
Price and Total Volume With 50-period Moving Volume Average
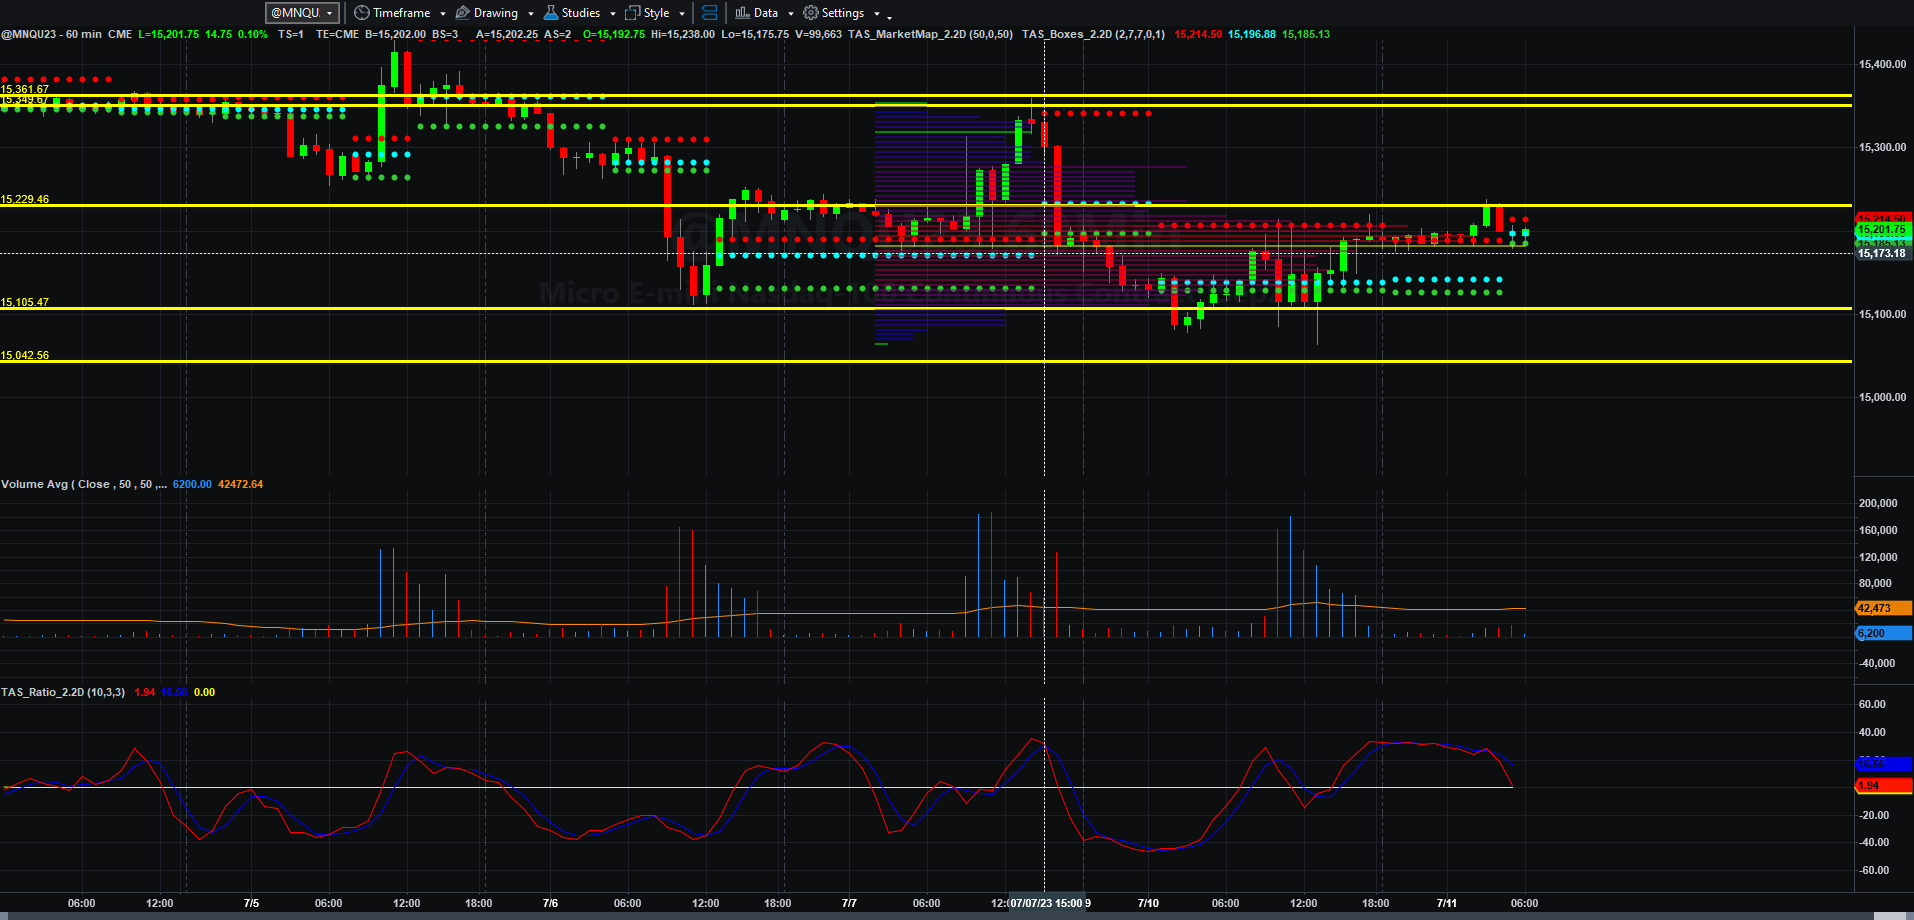
Fibonacci Price Scale With Targets
Because some errant redneck drove his car over a node that connected Spectrum Communications’ headend to my neighborhood at 0230 EDT yesterday, I could not produce yesterday’s Buffalo Trader’s Writing Desk. Local driving proficiency has improved this morning, so I can write and publish once again.
There is still a ton of conflicting economic data out there, both here (as reflected by Friday’s WSJ article, and in China, according to this Bloomberg article.
From the standpoint of key economic indicator conflicts, I found a very interesting video from Game of Trades. It describes quite well the conflicts created by Fed policies and market dynamics, not seen since the death of the “Nifty Fifty” era back in 1967. This analysis is much in the style of Norman Fosback, the author of “Stock Market Logic”. His insights were and still are, as he is still alive and apparently still consulting, brilliant. One of the reasons the rally we started late last year may have stalled is because of these factors.
As time goes on, I will try to add articles and commentary about conflicting signals, but let’s get back to looking at charts.
The general sloppiness of trading yesterday morning (I assume because wholesale inventories remained unchanged from the previous month), ended up with traders deciding to continue to trade MNQU23 higher. At the end of the session, Asia and Europe decided to idle these markets around those highest levels of yesterday afternoon.
If MQNU23 could rally above 15229.50, it has a shot at moving above 15238 to 15285.50 and 15346 by Friday. If not, it is quite possible that this market could find support around 11505.50. Failing that, it could pull back to the previous low of 15063.50 and perhaps back to 15016 and even to 14955.75 by Friday.
Even though hourly spreads all seem somewhat bullish, the hourly chart of MNQU23 shows the properties of lower highs and lower lows indicative of a downtrend. If (AND ONLY IF) there is a swift selloff, one could imagine a bearish AB=CD pattern in the making, assuming the price decline is symmetrical. It could look like this:
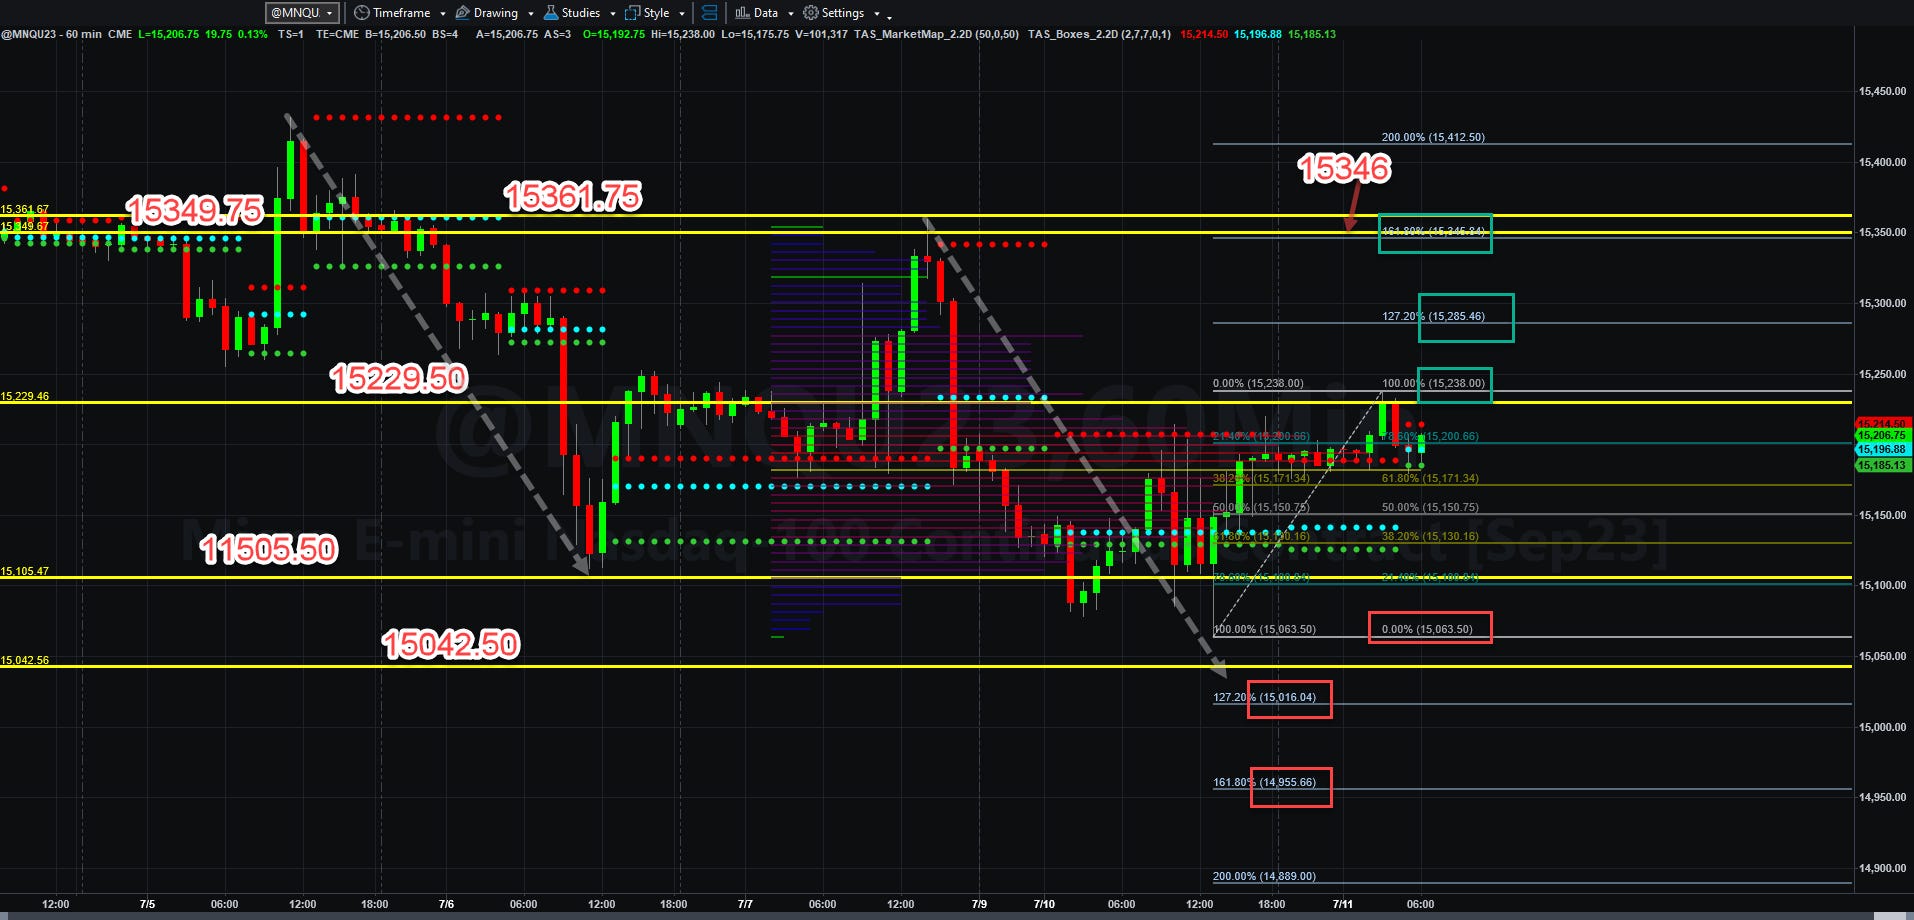
You would need a hard sell-off to achieve that, so it is, at this point, only a speculative analysis. We will see what happens.
I did not trade yesterday, as it was about 1100 EDT before internet service was restored. If I see something today that fits the trade plan, I will take a look. Friday’s trade produced 25 NQ points long profits.
More is coming soon. Have a wonderful and profitable Tuesday!
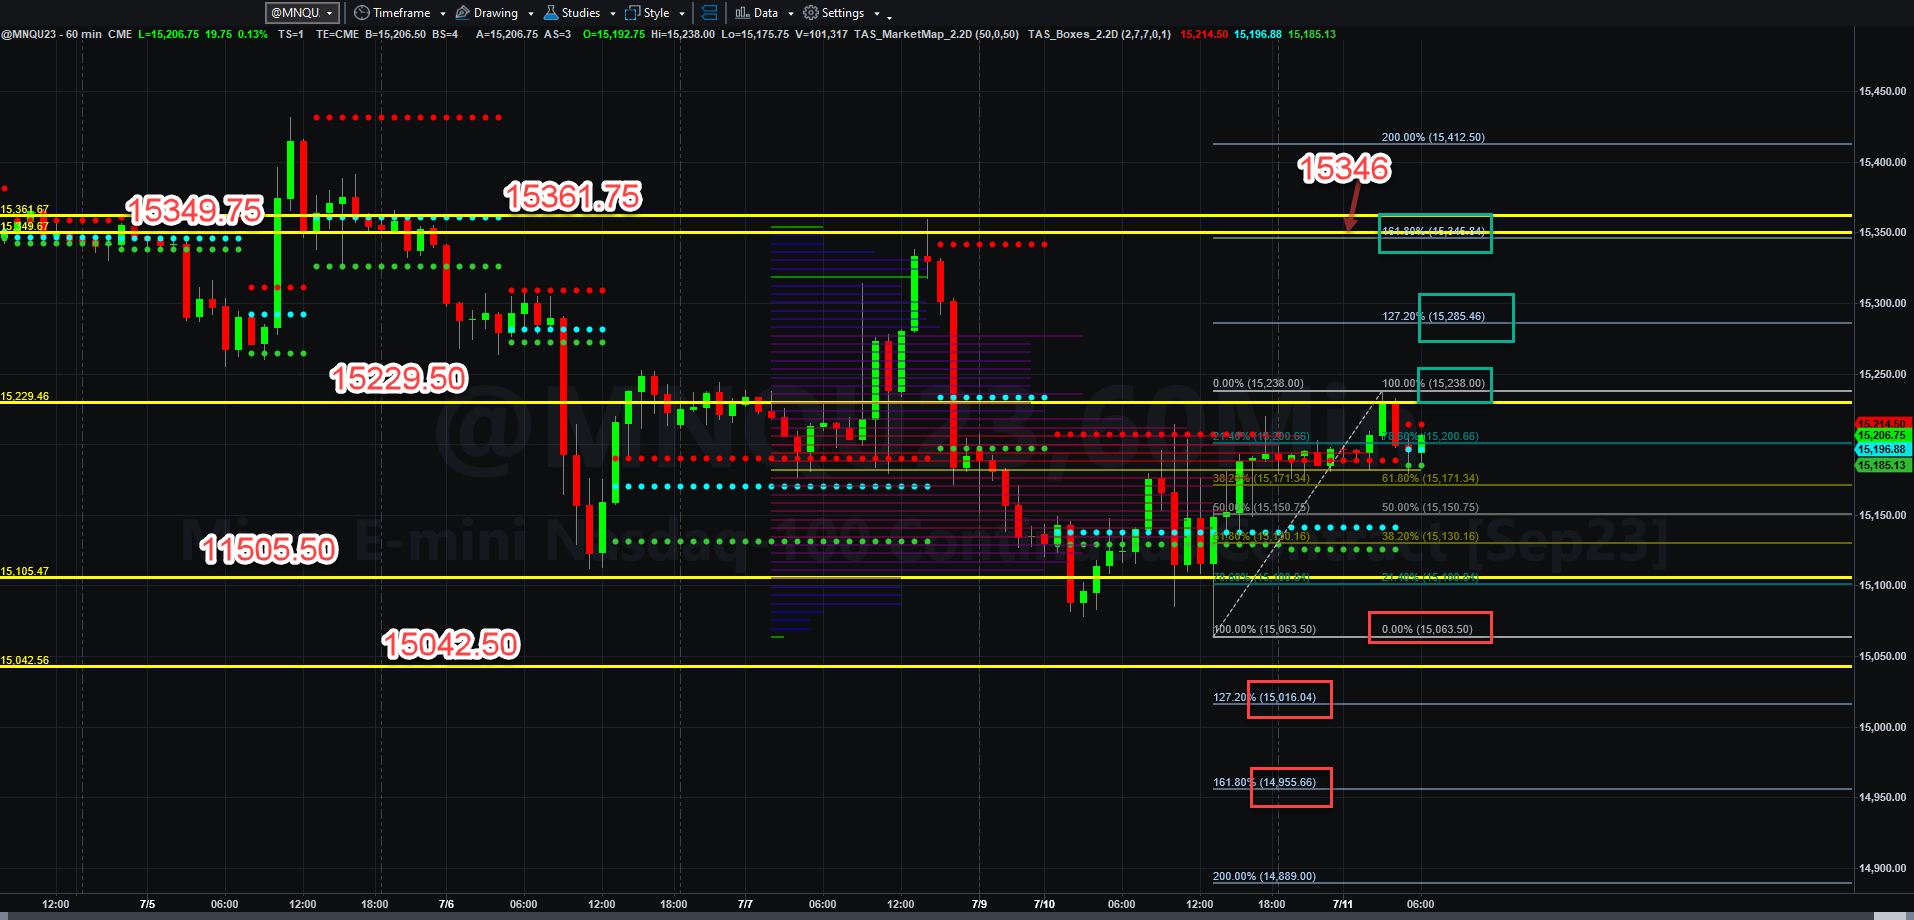
Today’s Economic Data Courtesy of Trading Economics dot com. Be sure to refresh the date at the top left.