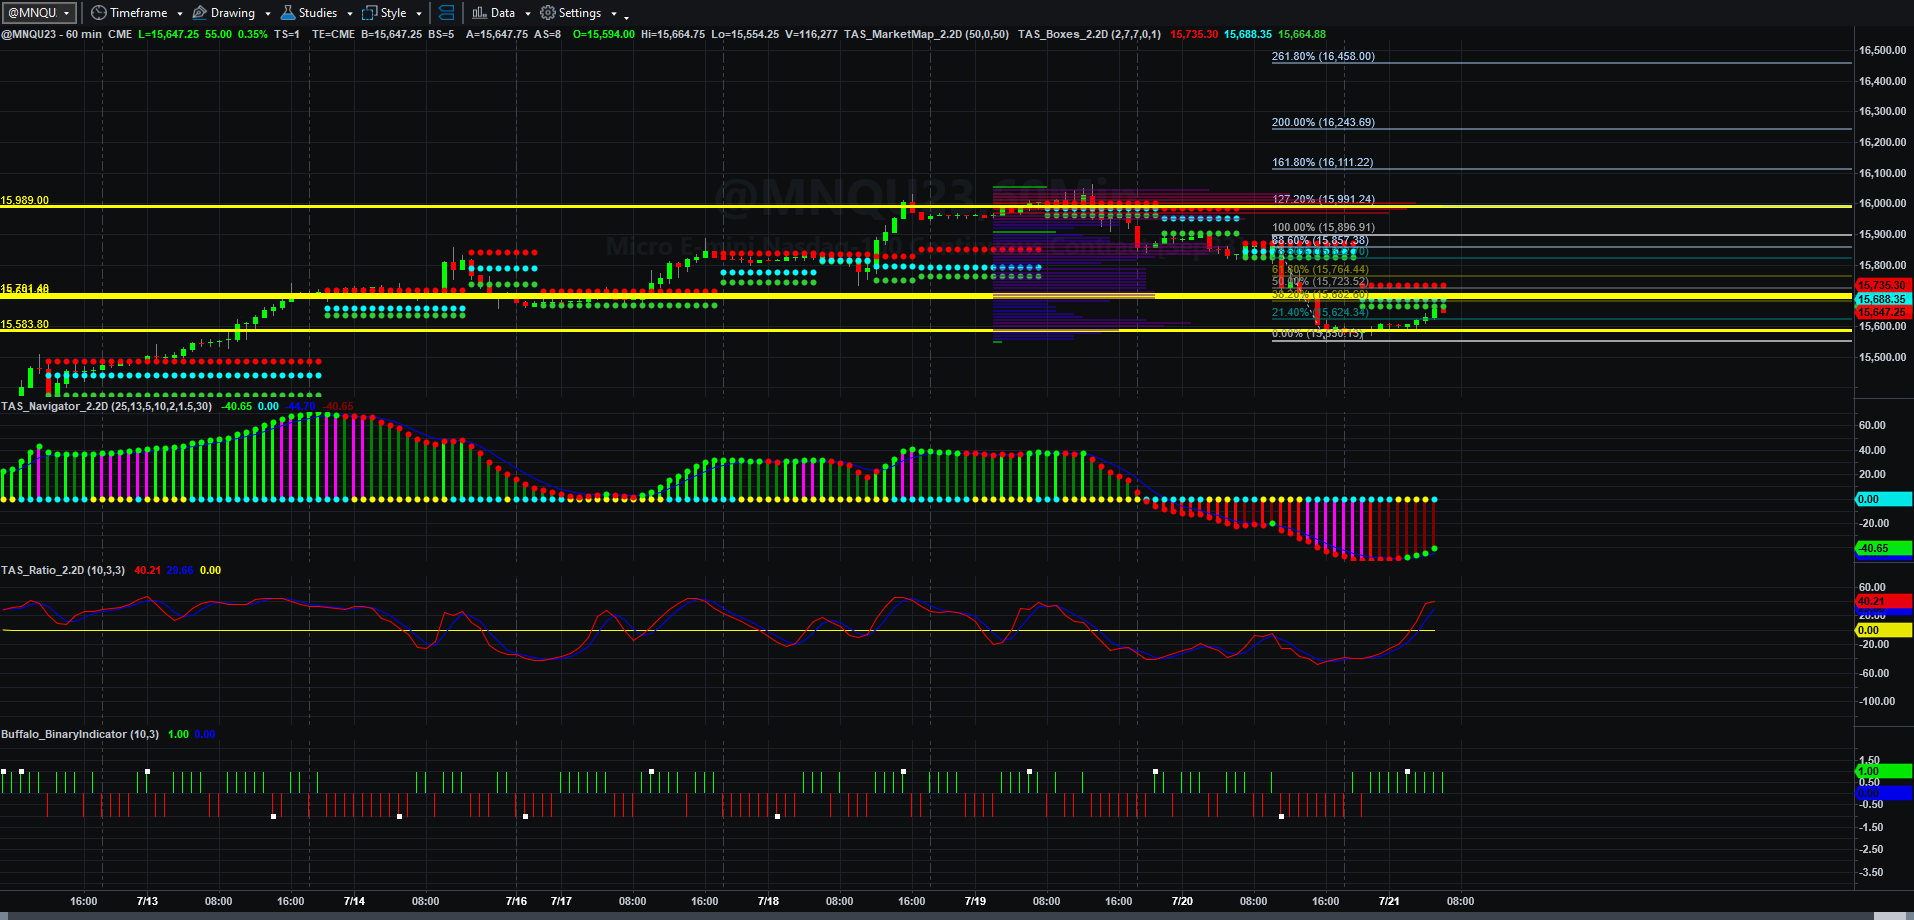
Price, Price Spread, Lagged Price/Volume Spread, and Binary Price/Volume Indicator
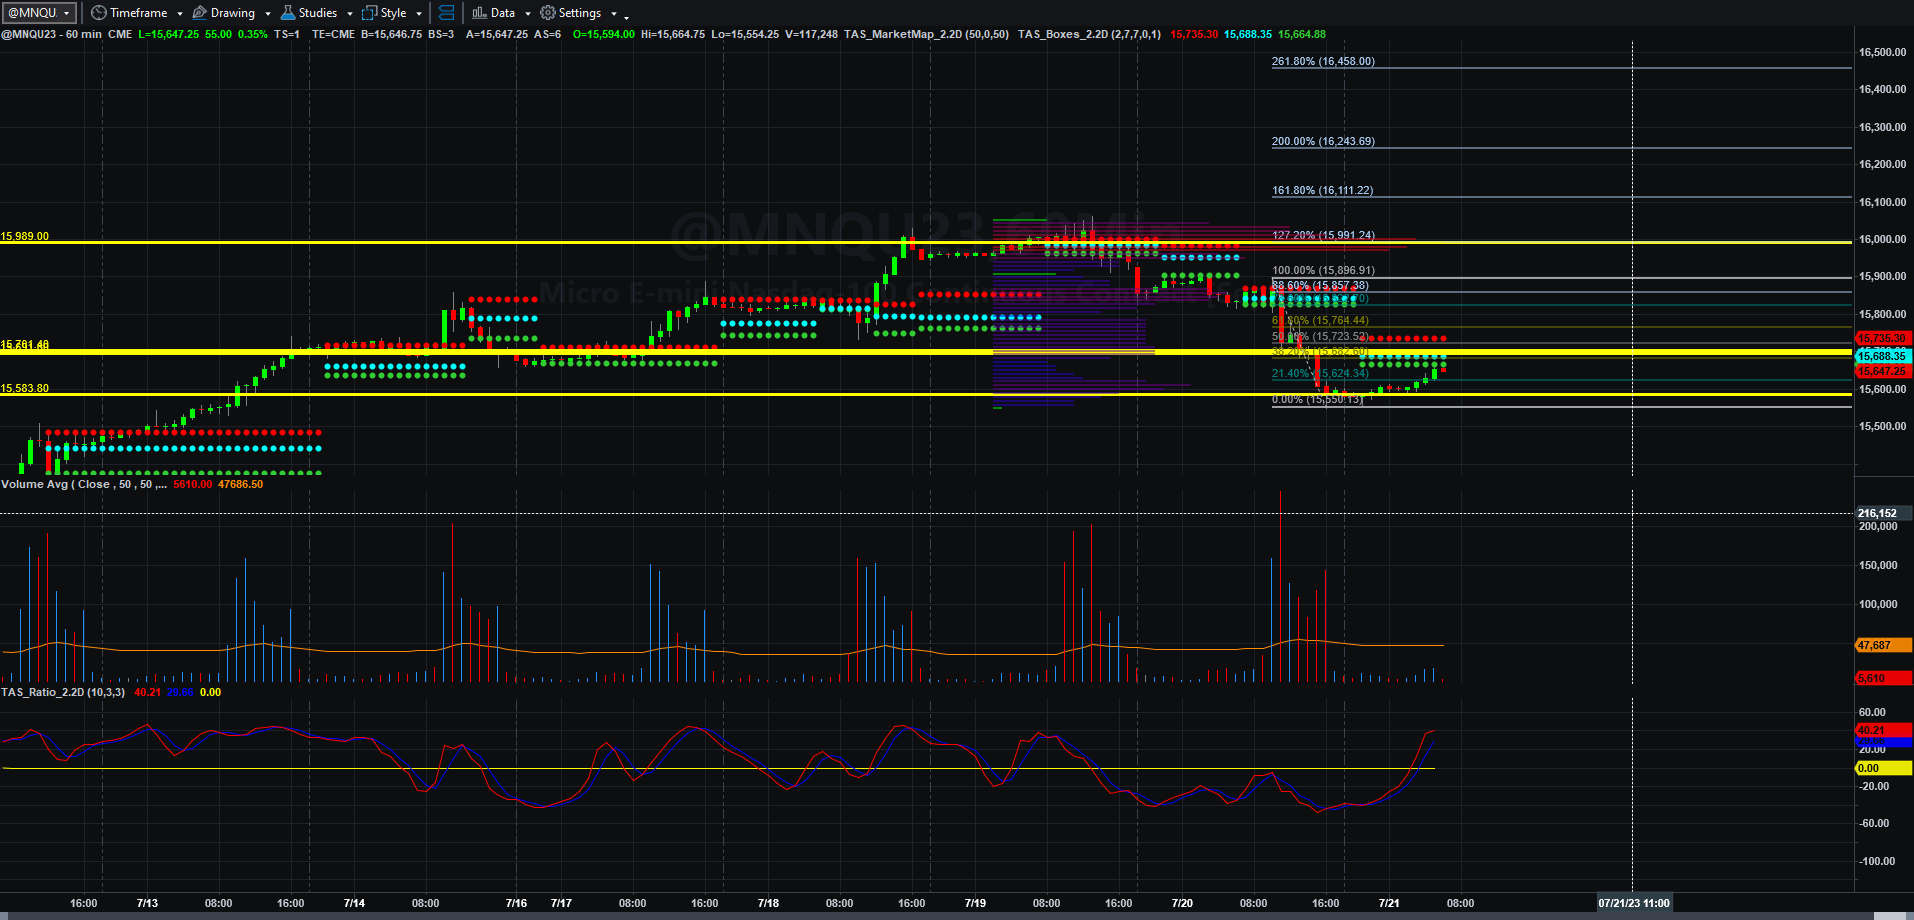
Price and Total Volume With 50-period Moving Volume Average
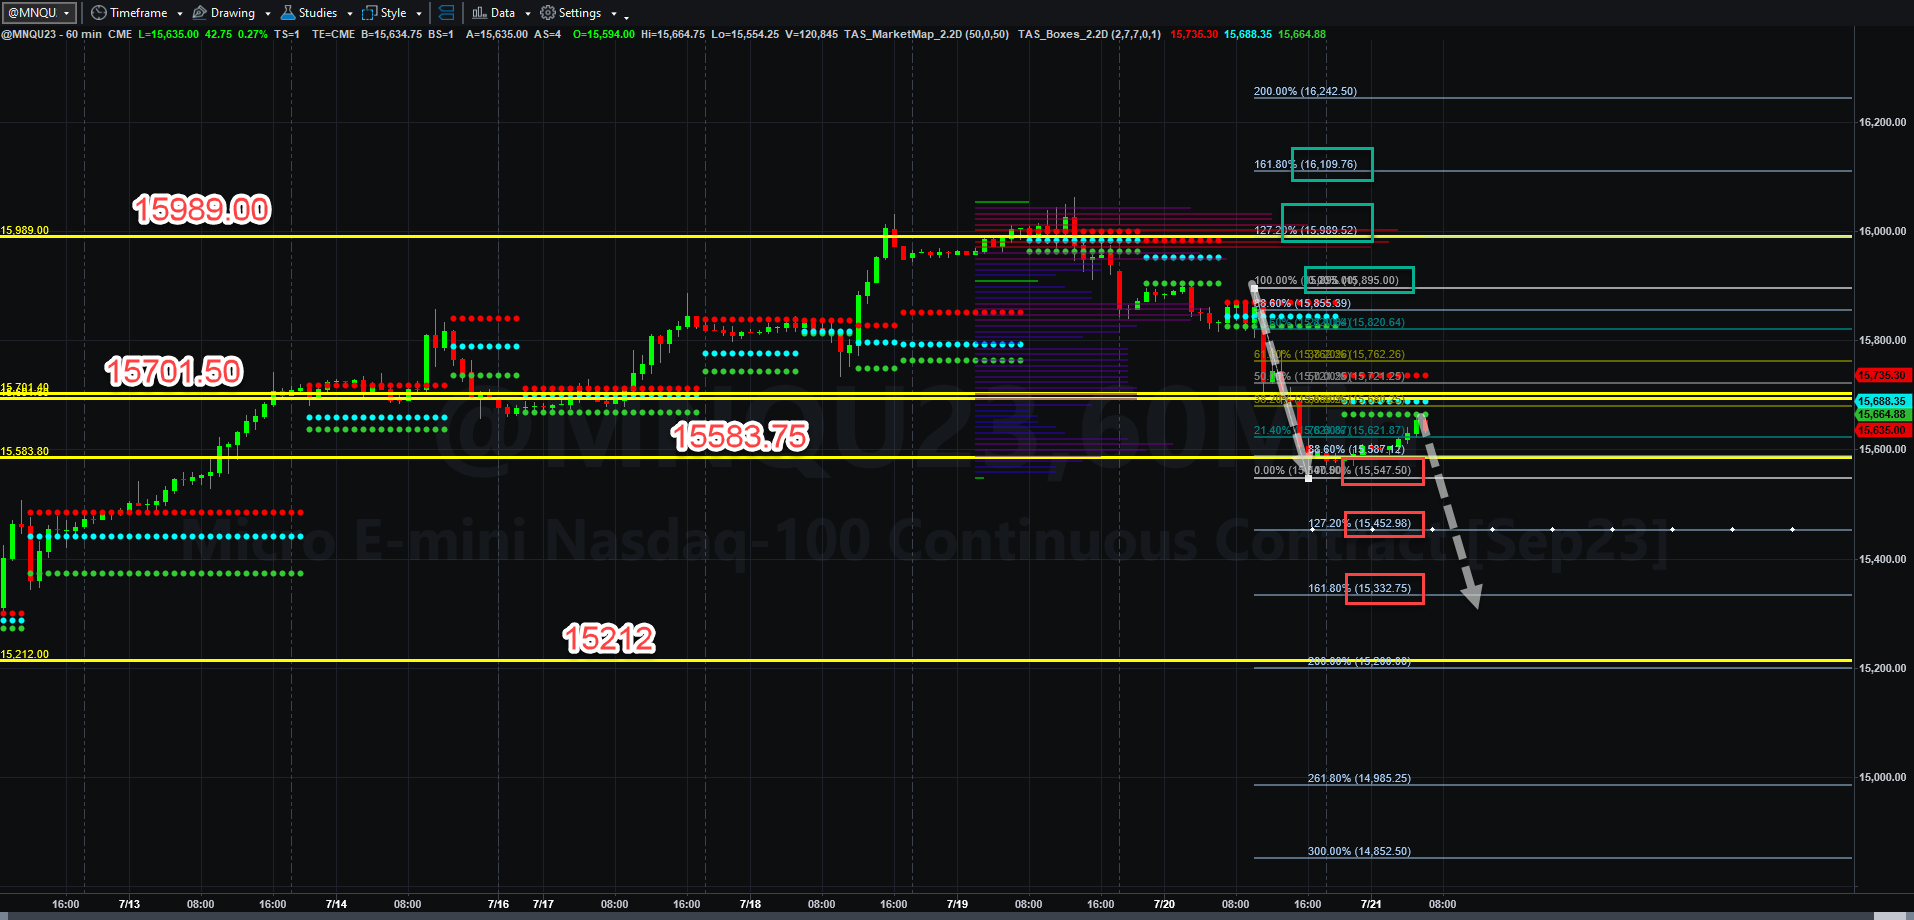
Fibonacci Price Scale With Targets
Because I needed to make some adjustments to the network this morning, this write-up will be a bit shorter, but I think still be impactful.
Today, the QQQ will be rebalanced to reduce the influence of the FAANG stocks (I call them MANGA stocks because of Facebook’s name change to Meta). This will fire a very active options market today. Some of the price action this week might have been influenced by this event, but nonetheless, it will lead to higher volatility over the next couple of days.
Economic data is still all over the map, and I will do my best to discuss this more over the weekend. China’s economy and demographics look increasingly dour, and that could have impacts on the USA and the world down the road.
Instead of rambling, let’s cut to the chase with the charts.
We literally blew through the AB=CD pattern I showed yesterday as sellers broke key support and drove prices down as I assume the combination of earnings disappointment and the coming rebalancing created a huge downswing. I was done trading after getting my initial target to the LONG side yesterday, but as I shifted to other business missed the gift of the short signal that basically came before the bearish C-D leg of the AB=CD happened and subsequently blew apart another support level.
This morning Asia and Europe continued selling into the 0500 EDT hour. What I showed in the Fibonacci patterns chart is a possible “three drives to a bottom” possible second bearish AB=CD pattern completion. THERE IS NO GUARANTEE THAT WILL HAPPEN, but the gaps to the downside are large enough to support such a move if the volume becomes aggressive.
If MNQU23 breaks 15583.75 decisively, then it is possible that the 15547.50 low will be broken and that 15453 and 15332.75 lows are possible by Monday.
If it can remain above that level and rise above 15701.50 again, it has the ability to run back to the old high of 15895 (given the fact that a large bearish candle could easily be retaken to the upside if buying volume is strong), and 15909.50 and even 16108.50 are possible targets by Monday.
I will speculate on which situation wins out as it all depends on who shows up. I was able to pick up the measured 10 NQ point per contract profit in the minor bullish swing that occurred prior to the collapse. Had I been at the screen to trade again, I would probably have taken the short and rode that one out, but it did not present itself during the time I traded. As the Substack expands (hopefully), I will get into how I will transition some of my trading into hourly trading as I continue to refine the new method I learned in the long-awaited and often delayed course I took. With proper risk management, it will allow me to greatly expand profitability and to scale more quickly. More on that soon.
I will try to write this weekend and attempt to demonstrate in a “sped-up” real-time video how I trade the breakouts. Have a profitable productive Friday and a pleasant weekend!
Today’s Economic Data Courtesy of Trading Economics dot com. Be sure to refresh the date at the top left.