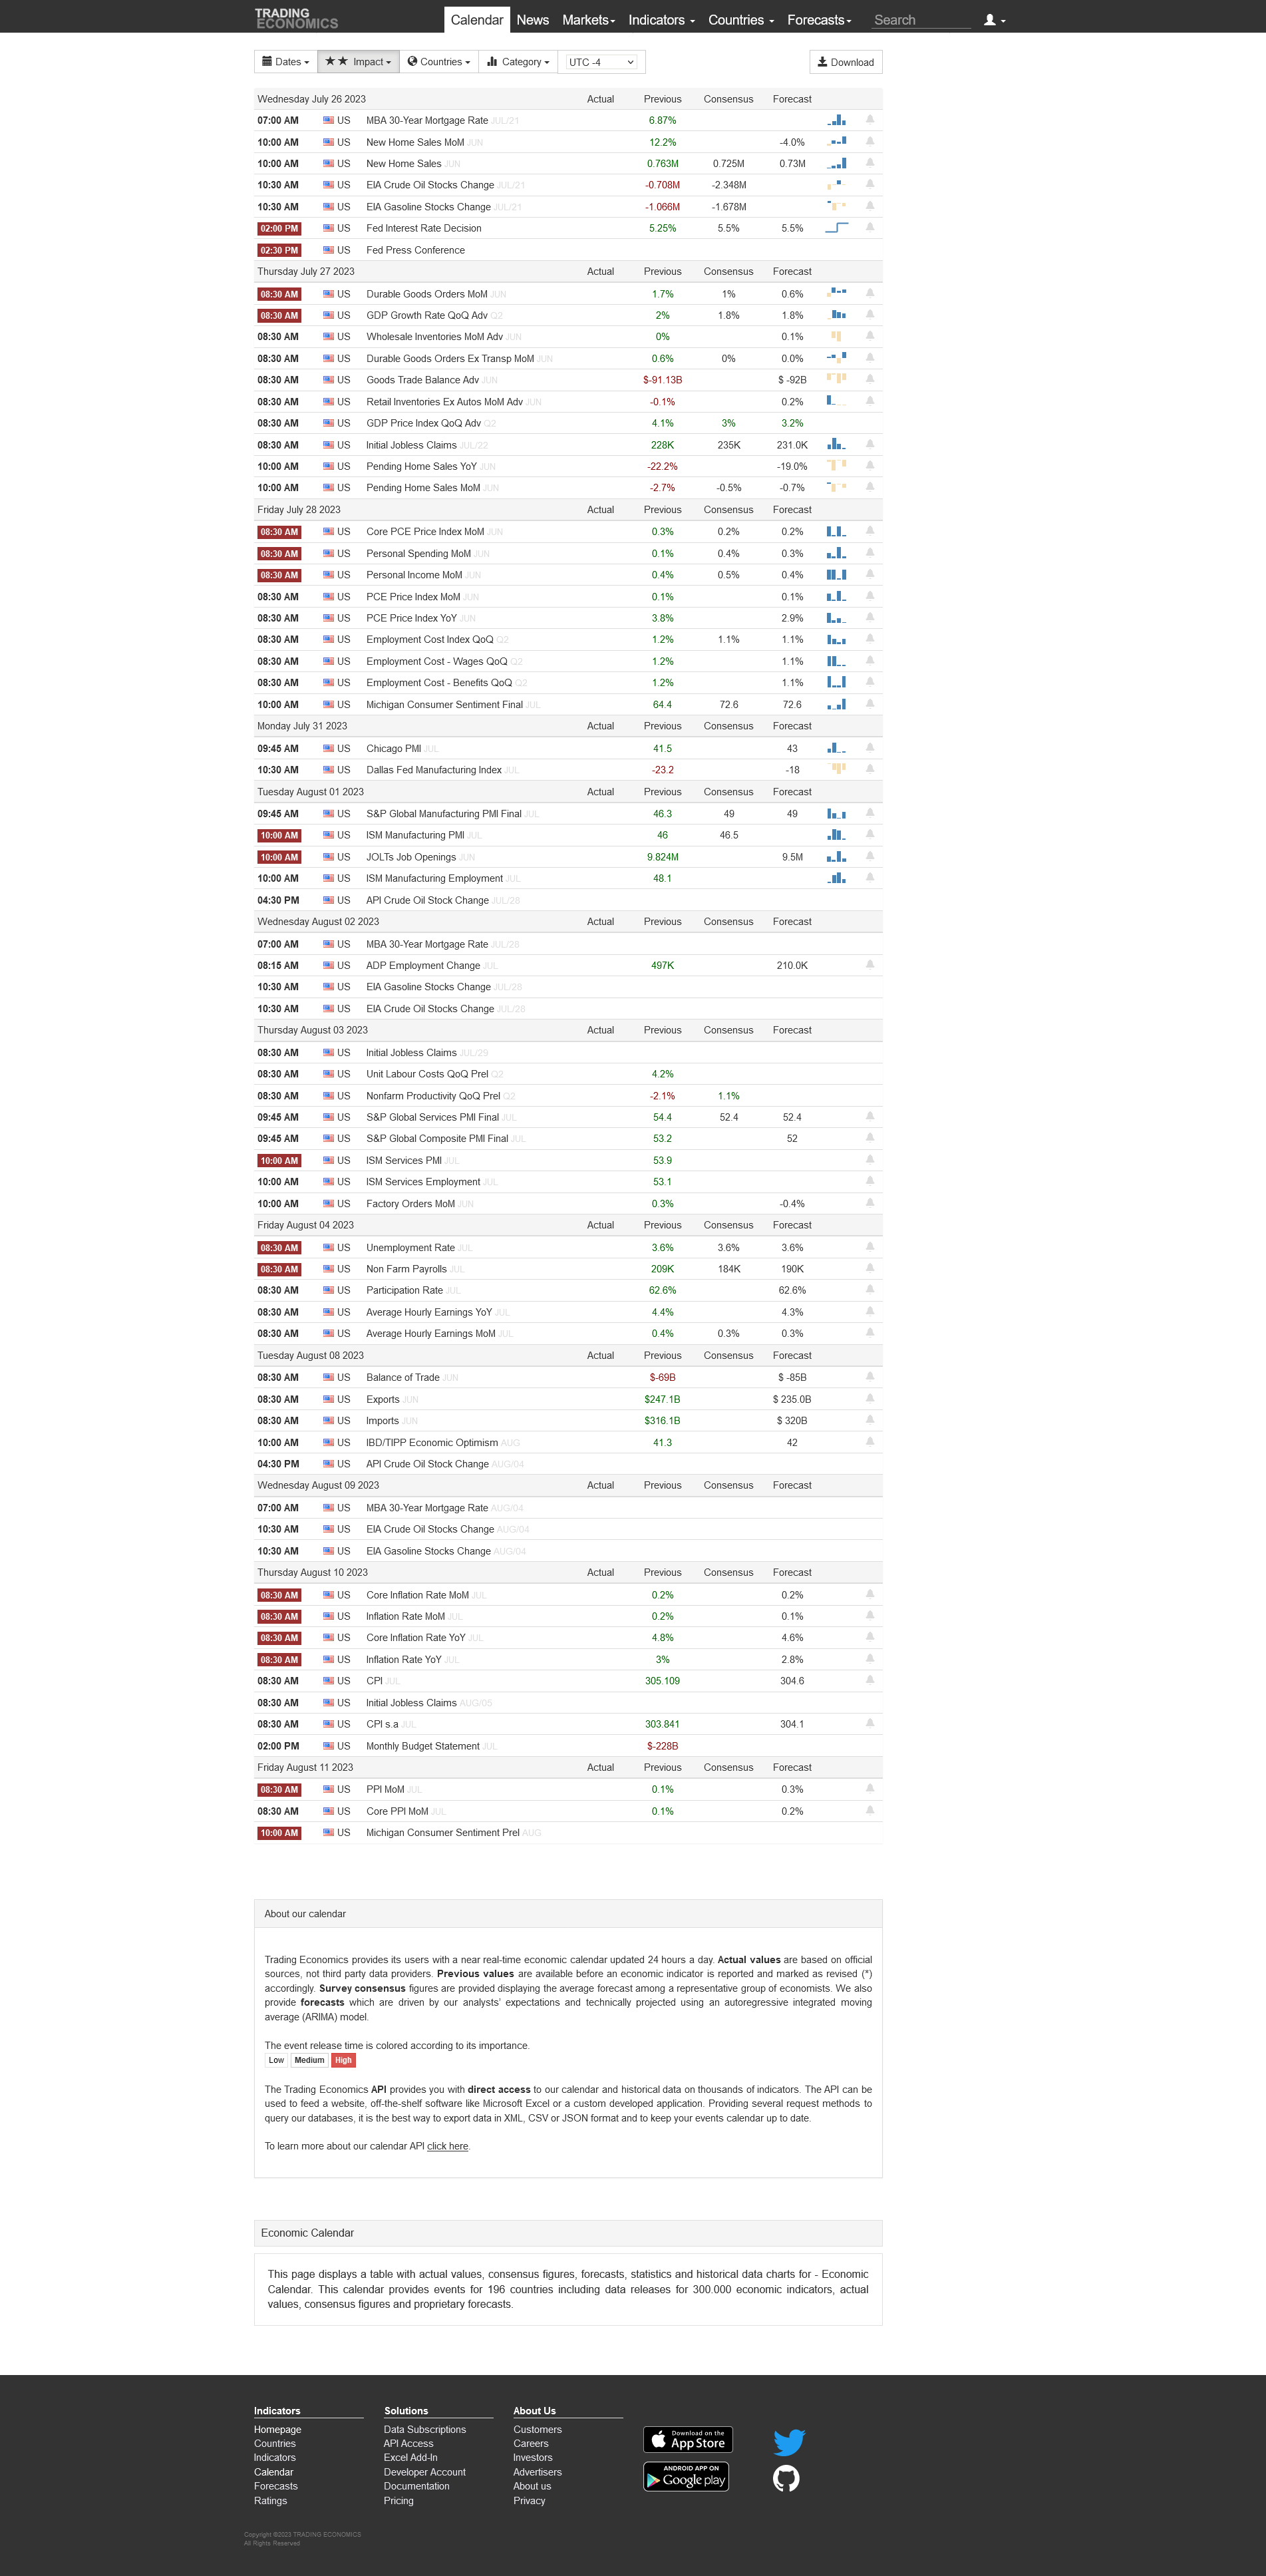
Price, Price Spread, Lagged Price/Volume Spread, and Binary Price/Volume Indicator
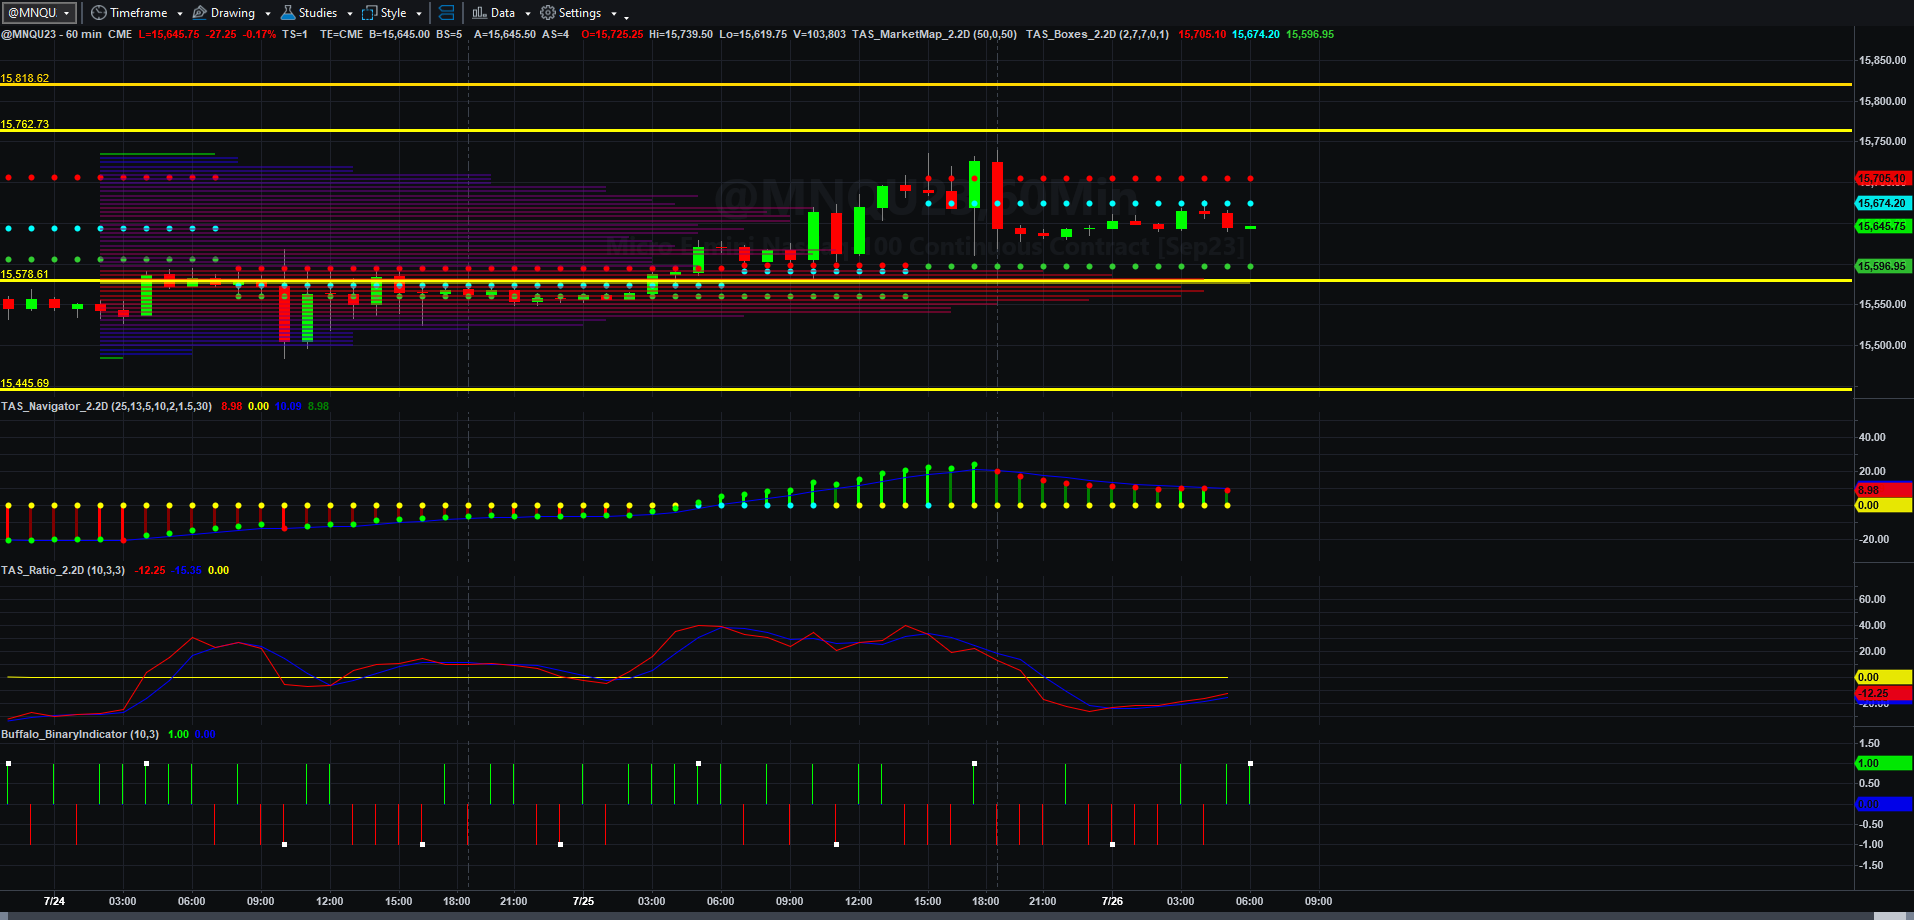
Price and Total Volume With 50-period Moving Volume Average
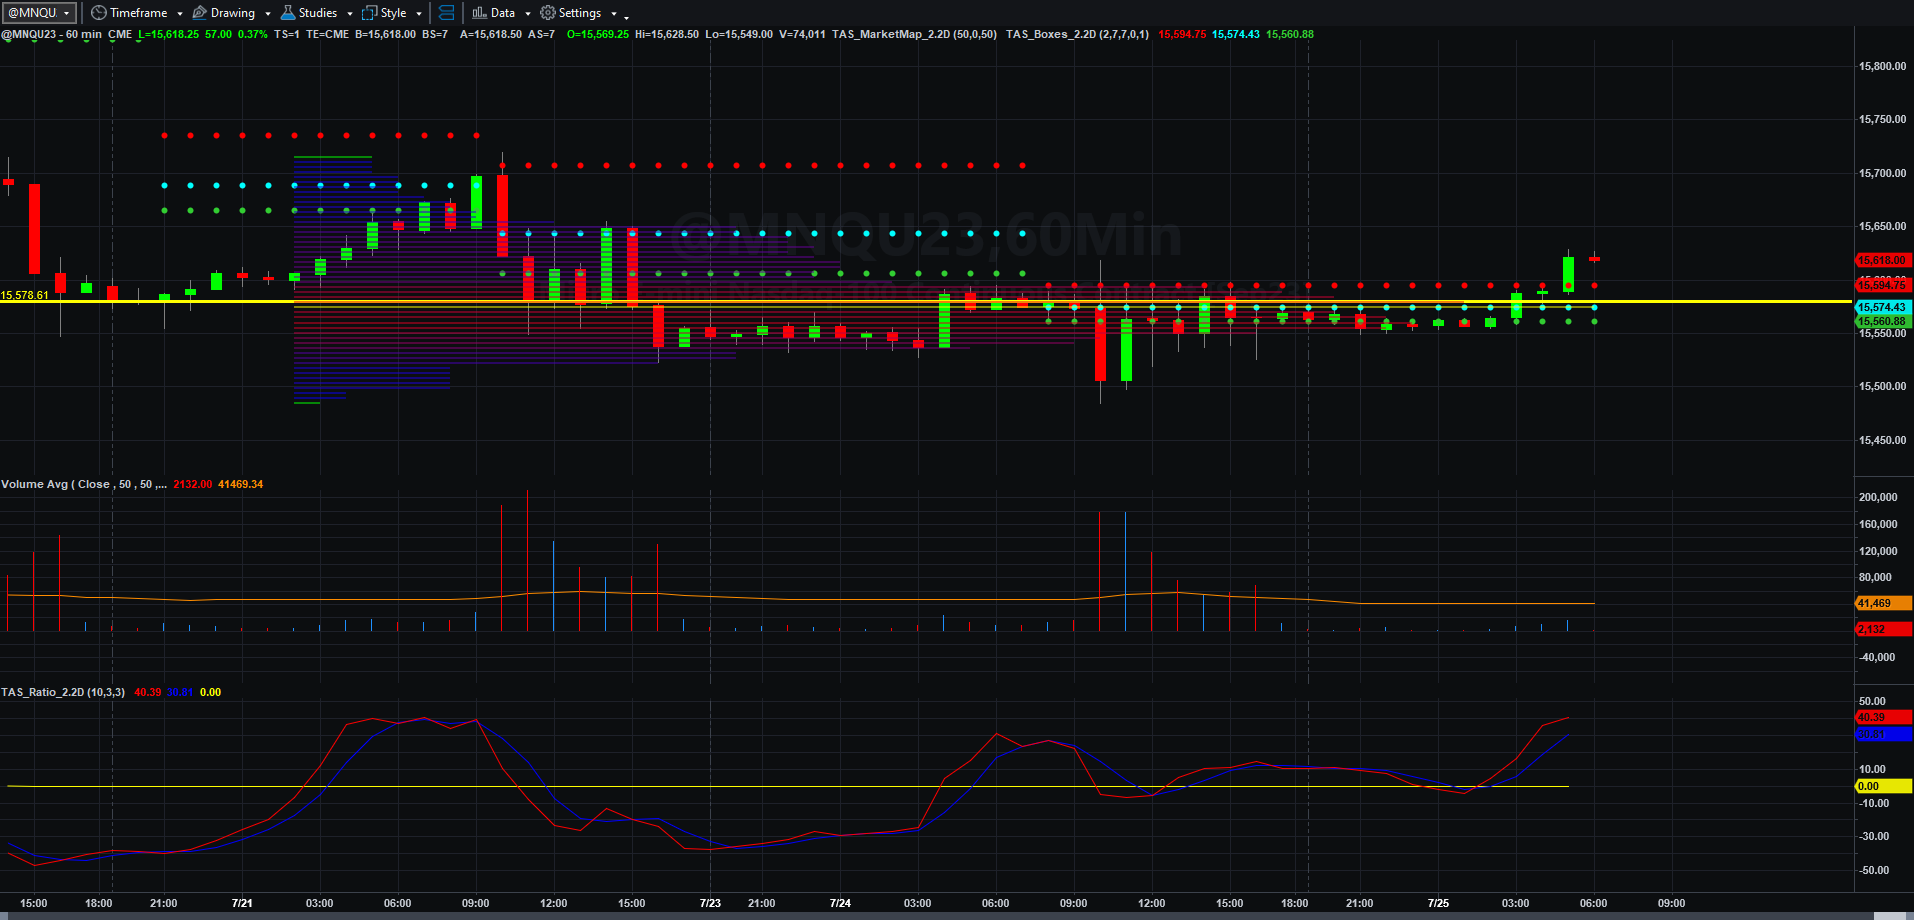
Fibonacci Price Scale With Targets
It seems everyone has an opinion as to what comes next for Federal Reserve interest rate policy. It seems that even news sources like the Wall Street Journal are even speculating on the wisdom of the baked in rate hike today NOT being the last one and preparing investors for that prospect of impact on stock and other asset pricing.
If you have been to the gas pump in the last week, you have already seen gasoline in some places (even in South Carolina) exceed $4 a gallon. The evidence of consumer inflation in food, energy, and services continue to increase. Stuff is NOT getting cheaper and in some cases is beginning to rise at an accelerated pace again.
I attempted to pull the latest report from shadowstats.com but as luck would have it, the site is changing servers so the latest report is not available. I do have the most recent chart of inflation calculated as it was in 1990 and in 1980 (during the Volker era):
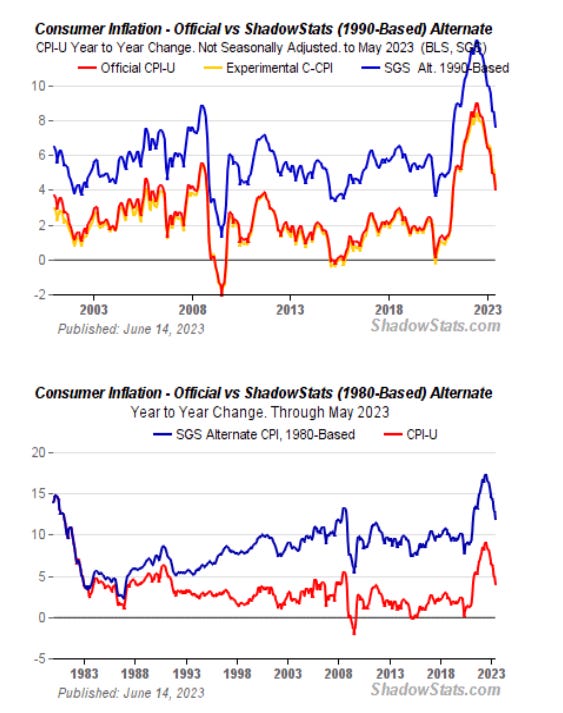
The bottom chart (shown above this paragraph), in this writer’s opinion, more accurately reflects what is still happening to consumer inflation, if one includes food and energy. We area still seeing in some cases over 10% annualized inflation even though the pace may have cooled in things like eggs where supplies have stabilized. In other areas, like peaches, the lack of cold in some areas will drive those prices up as much as 40% per annum. Between the rather weak wheat crop in the U.S. and the idiocy our government seems obsessed with accelerating in Ukraine, grain prices will also be higher locally and internationally, with some people literally running out of supplies who most need the nutritional benefits of wheat, leading to potential famine internationally. With our SPR drained, American energy production restricted by a Uniparty fascist regime in Washington, and further insanity in utility power generation added because of “climate change”, everything probably WILL get much more expensive, and the cost of end use goods will escalate off the back of these resource price increases.
We will know the answer at 1400 EDT today. I will not speculate on the decision, as that is a crapshoot. Let’s just focus on the charts.
If MNQU23 can remain above 15570.50, it has a very good shot at taking out 15739.50 and even advance to 15774.50 and 15818.75 by Thursday. If not, 15611.25 is likely challenged to the downside once again, and if 15570.50 can be broken decisively, the 15532 would be a minimum downside target by Thursday. It could fall all the way back to 15483, but if the commercial interestes remain in place near the 15570.50 VWAP line, that could be a floor depending on whether or not those positions remain intact. As usual, it all depends on who shows up to trade and whether sellers or buyers dominate the trading action.
Picked up another 10 NQ points long yesterday in simulation but becuase I stopped trading at 1030 EDT I did not participate in the rather strong volume countertrend swings that would have benefitted me more. For that reason, until I get to test the new technique for adjusting stops, I will likely trade the Fed action in simulation today also. I want to see how that adjustment affects profits in high volume situations. Because of summer sluggishness in trading, those opportunities are temporarily blunted. We will see what happens today.
That’s all for me today. Have an incredibly productive, prosperous, and happy Wednesday!
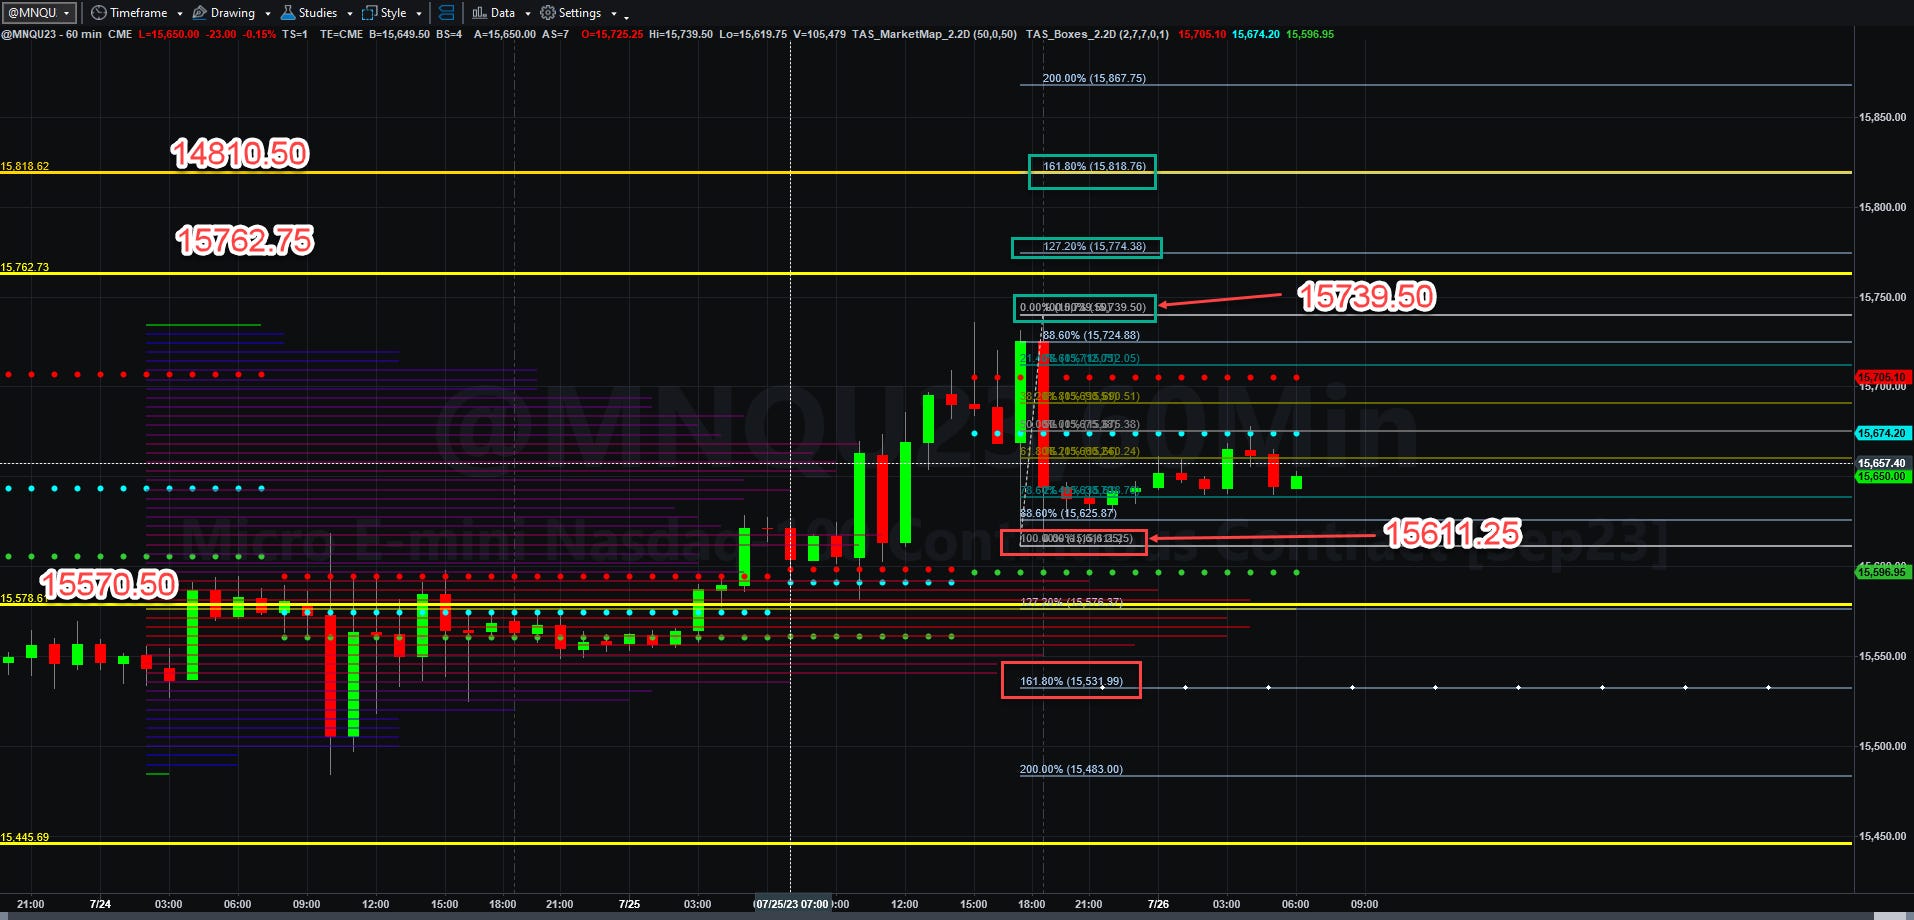
Today’s Economic Data Courtesy of Trading Economics dot com. Be sure to refresh the date at the top left.