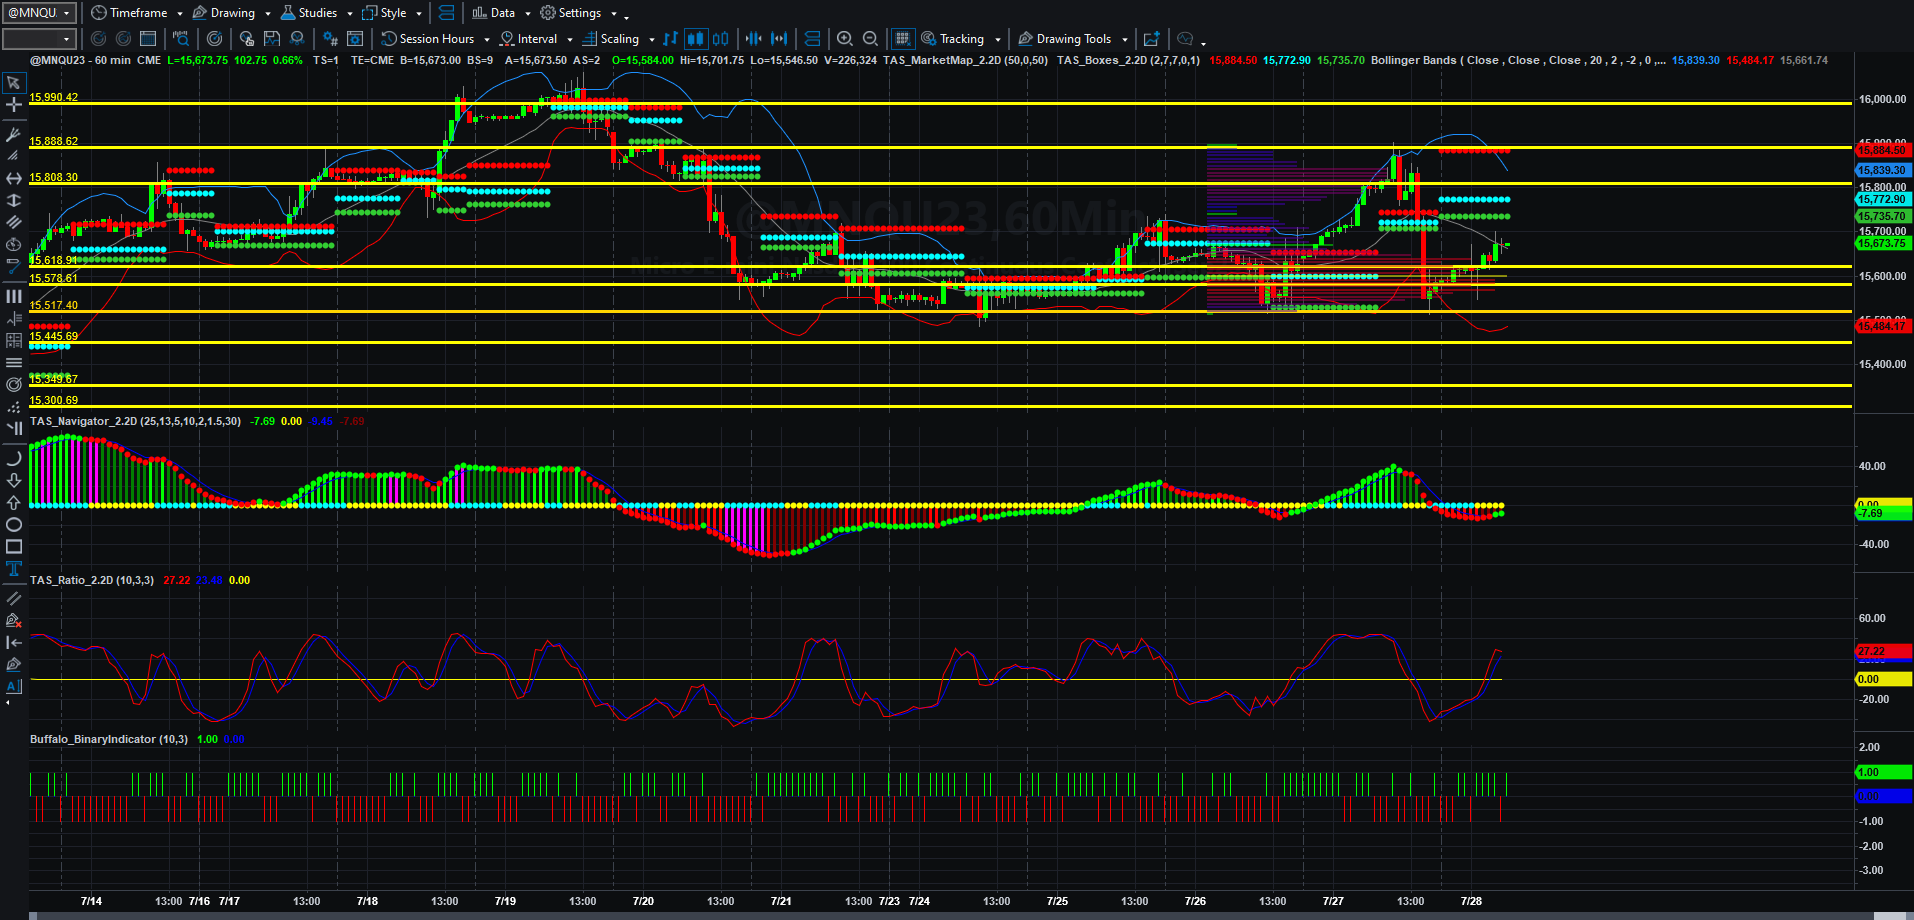
Price, Price Spread, Lagged Price/Volume Spread, and Binary Price/Volume Indicator
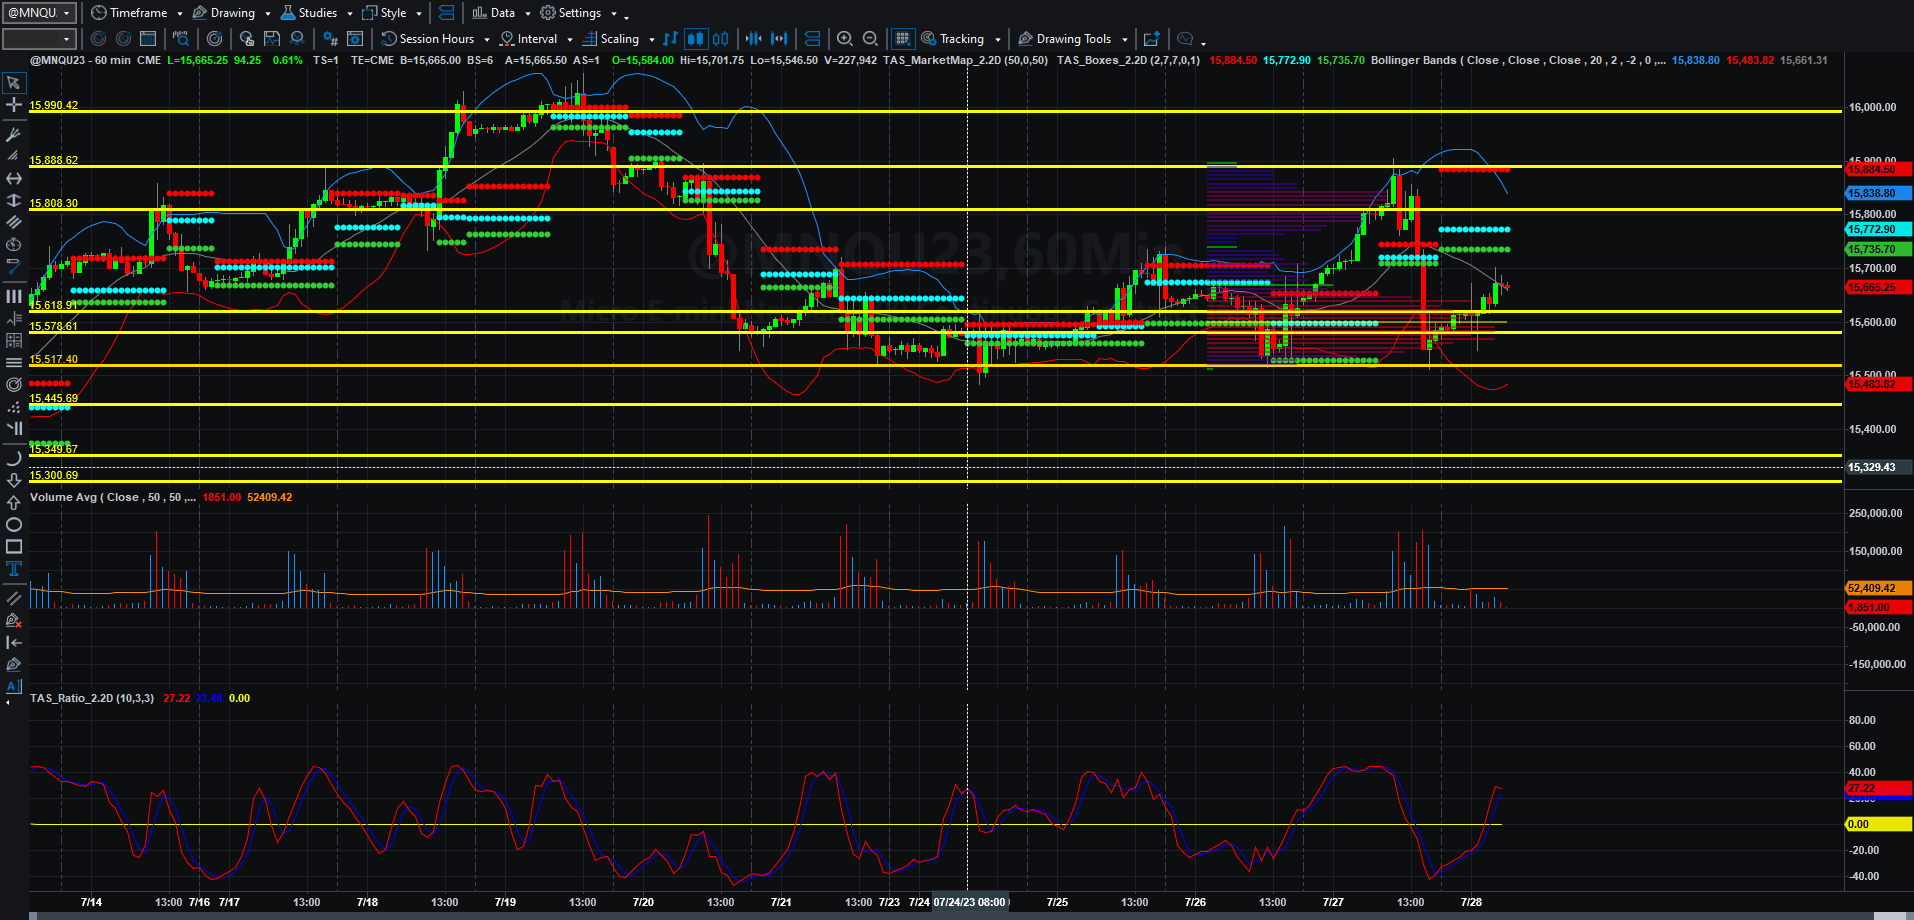
Price and Total Volume With 50-period Moving Volume Average
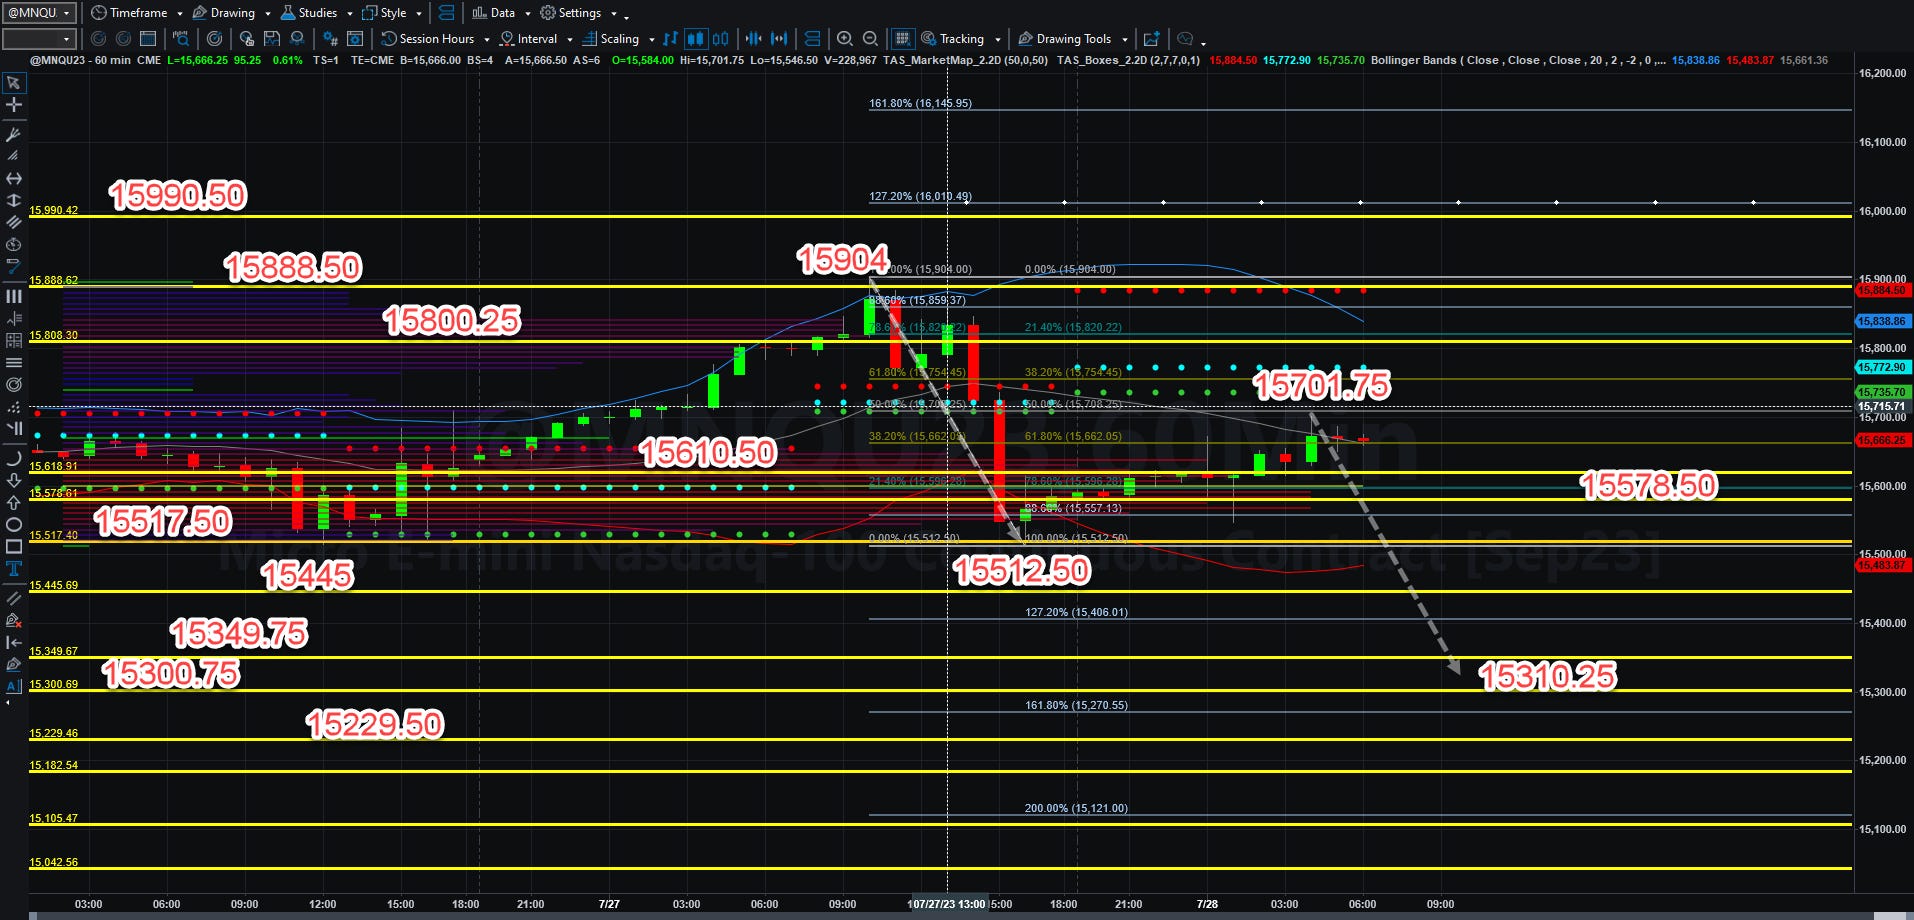
Fibonacci Price Scale With Targets
Yesterday certainly started off nicely for U.S. stocks, but as the afternoon dragged on, markets took a bounce (I am assuming because of rumors of Japanese interest rate policy changes) which made U.S. bonds look shaky, and sellers went hard to the trading terminals (or algorithms).
We seem ( in terms international economic decisions ) to be approaching maximum chaos, as Bank of Japan did indeed decide to allow rates to float higher this morning. The reason I say that it represents chaos is that some currency analysts think the dollar WILL RISE against the yen even if this event occurs, meaning hedge funds and international funds will be scratching their heads awhile figuring out the implications of that move.
Reaction to PCE inflation data today will only add to the general insanity, fear, and loathing that U.S. equity markets are now seemingly experiencing after the euphoria of percieved invincibility to U.S. rate hikes it has felt for nearly two weeks. Bipolarity lives on!
Add this to all I have discussed this week in terms of inflation, war, potential famine, and one simply has to wonder if the “free-money” casino party on Wall Street will continue. I have no idea, but here is a good Substack summary of the challenges that the Federal Reserve must make to navigate the rise in rates and the largely government-created inflation contagion the United States is dealing with currently.
Let’s leave that alone for now and go back to the charts.
You will have to forgive the look of the Fibonacci scale chart. It look’s like one of the late John Madden’s football play diagrams. There is a lot going on there though, so I think it’s appropos for the current day. Bollinger bands were added to see if we could be headed for a change in direction.
If MNQU23 can remain above 15610.50, then it has an excellent chance of once again rallying back to 15904 (based on the wide hourly bars of that selloff yesterday) and can achieve 16010.50 and even 16146 sometime Monday or early next week. If that were to happen, the rally is likely back on again as there is nothing but blue sky above that price to the 17-handles. There is very little left of commercial holdings above that point, so prices could run there fast if buyers become motivated.
If not, however, it would be a rather quick trip back to test 15512.50, and beyond to 15406 and back to 15270 assuming that the 15349.75 VWAP line does not serve as support. The key thing to watch is a break of 15512.50 as there are few commercial holdings there back to at least the 15349.75 line, and that would tempt sellers to become aggressive once again.
There is a possible AB=CD pattern (based on nearly perfect price symmetry going forward) at 15310.25. Will that happen? Hard to say if it will or not, but if there is scat commercial holding between 15512.50 and that level, it could happen. We will simply have to watch.
Trading plan produced 67.5 NQ points (20 long and 47.5 short) yesterday, but my only concern was that risk reward was slightly less than 1:1 . I am still using that slightly wider stop strategy until sufficient price moves allow a breakeven stop. So far, it is working, but I am going to continue simulation until the middle of next week. I am comfortable with it, but I want to see how it reacts to the inflation numbers we see today.
That is all I have for now. I will be quite busy on a number of tasks this weekend, but I will probably post a brief summary of timeframe charts for MQNU23. Stay tuned for that.
Have a wonderful and profitable Friday! If you like what you read, hit the like button and if you want to read this everyday, please subscribe. Many more of you are, and I greatly appreciate all the support!
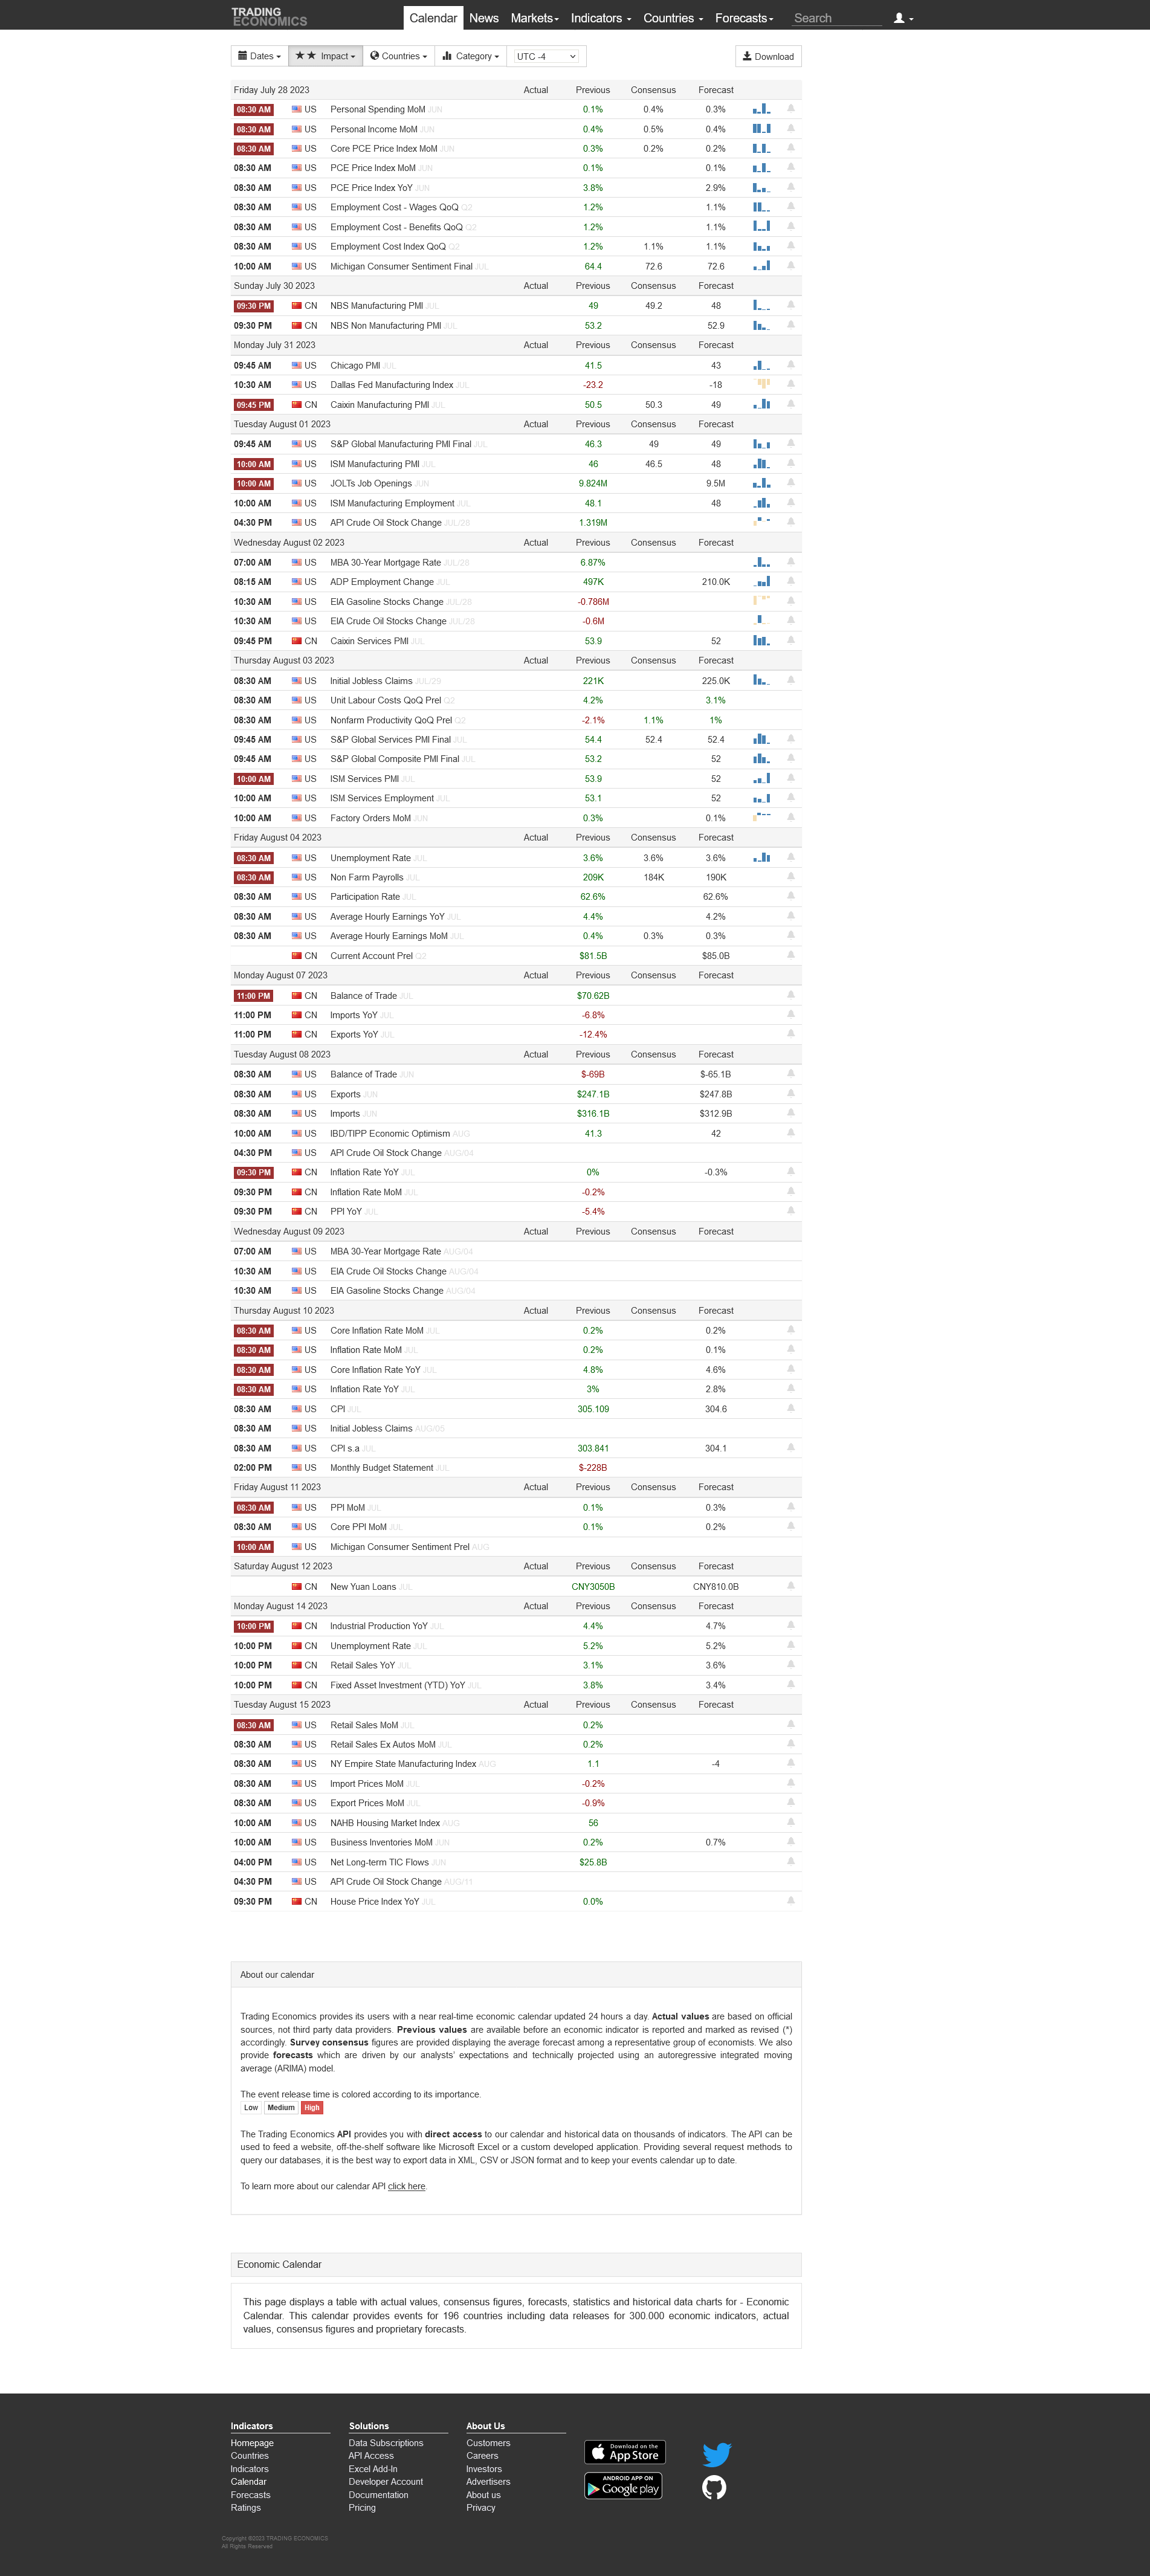
Today’s Economic Data Courtesy of Trading Economics dot com. Be sure to refresh the date at the top left.