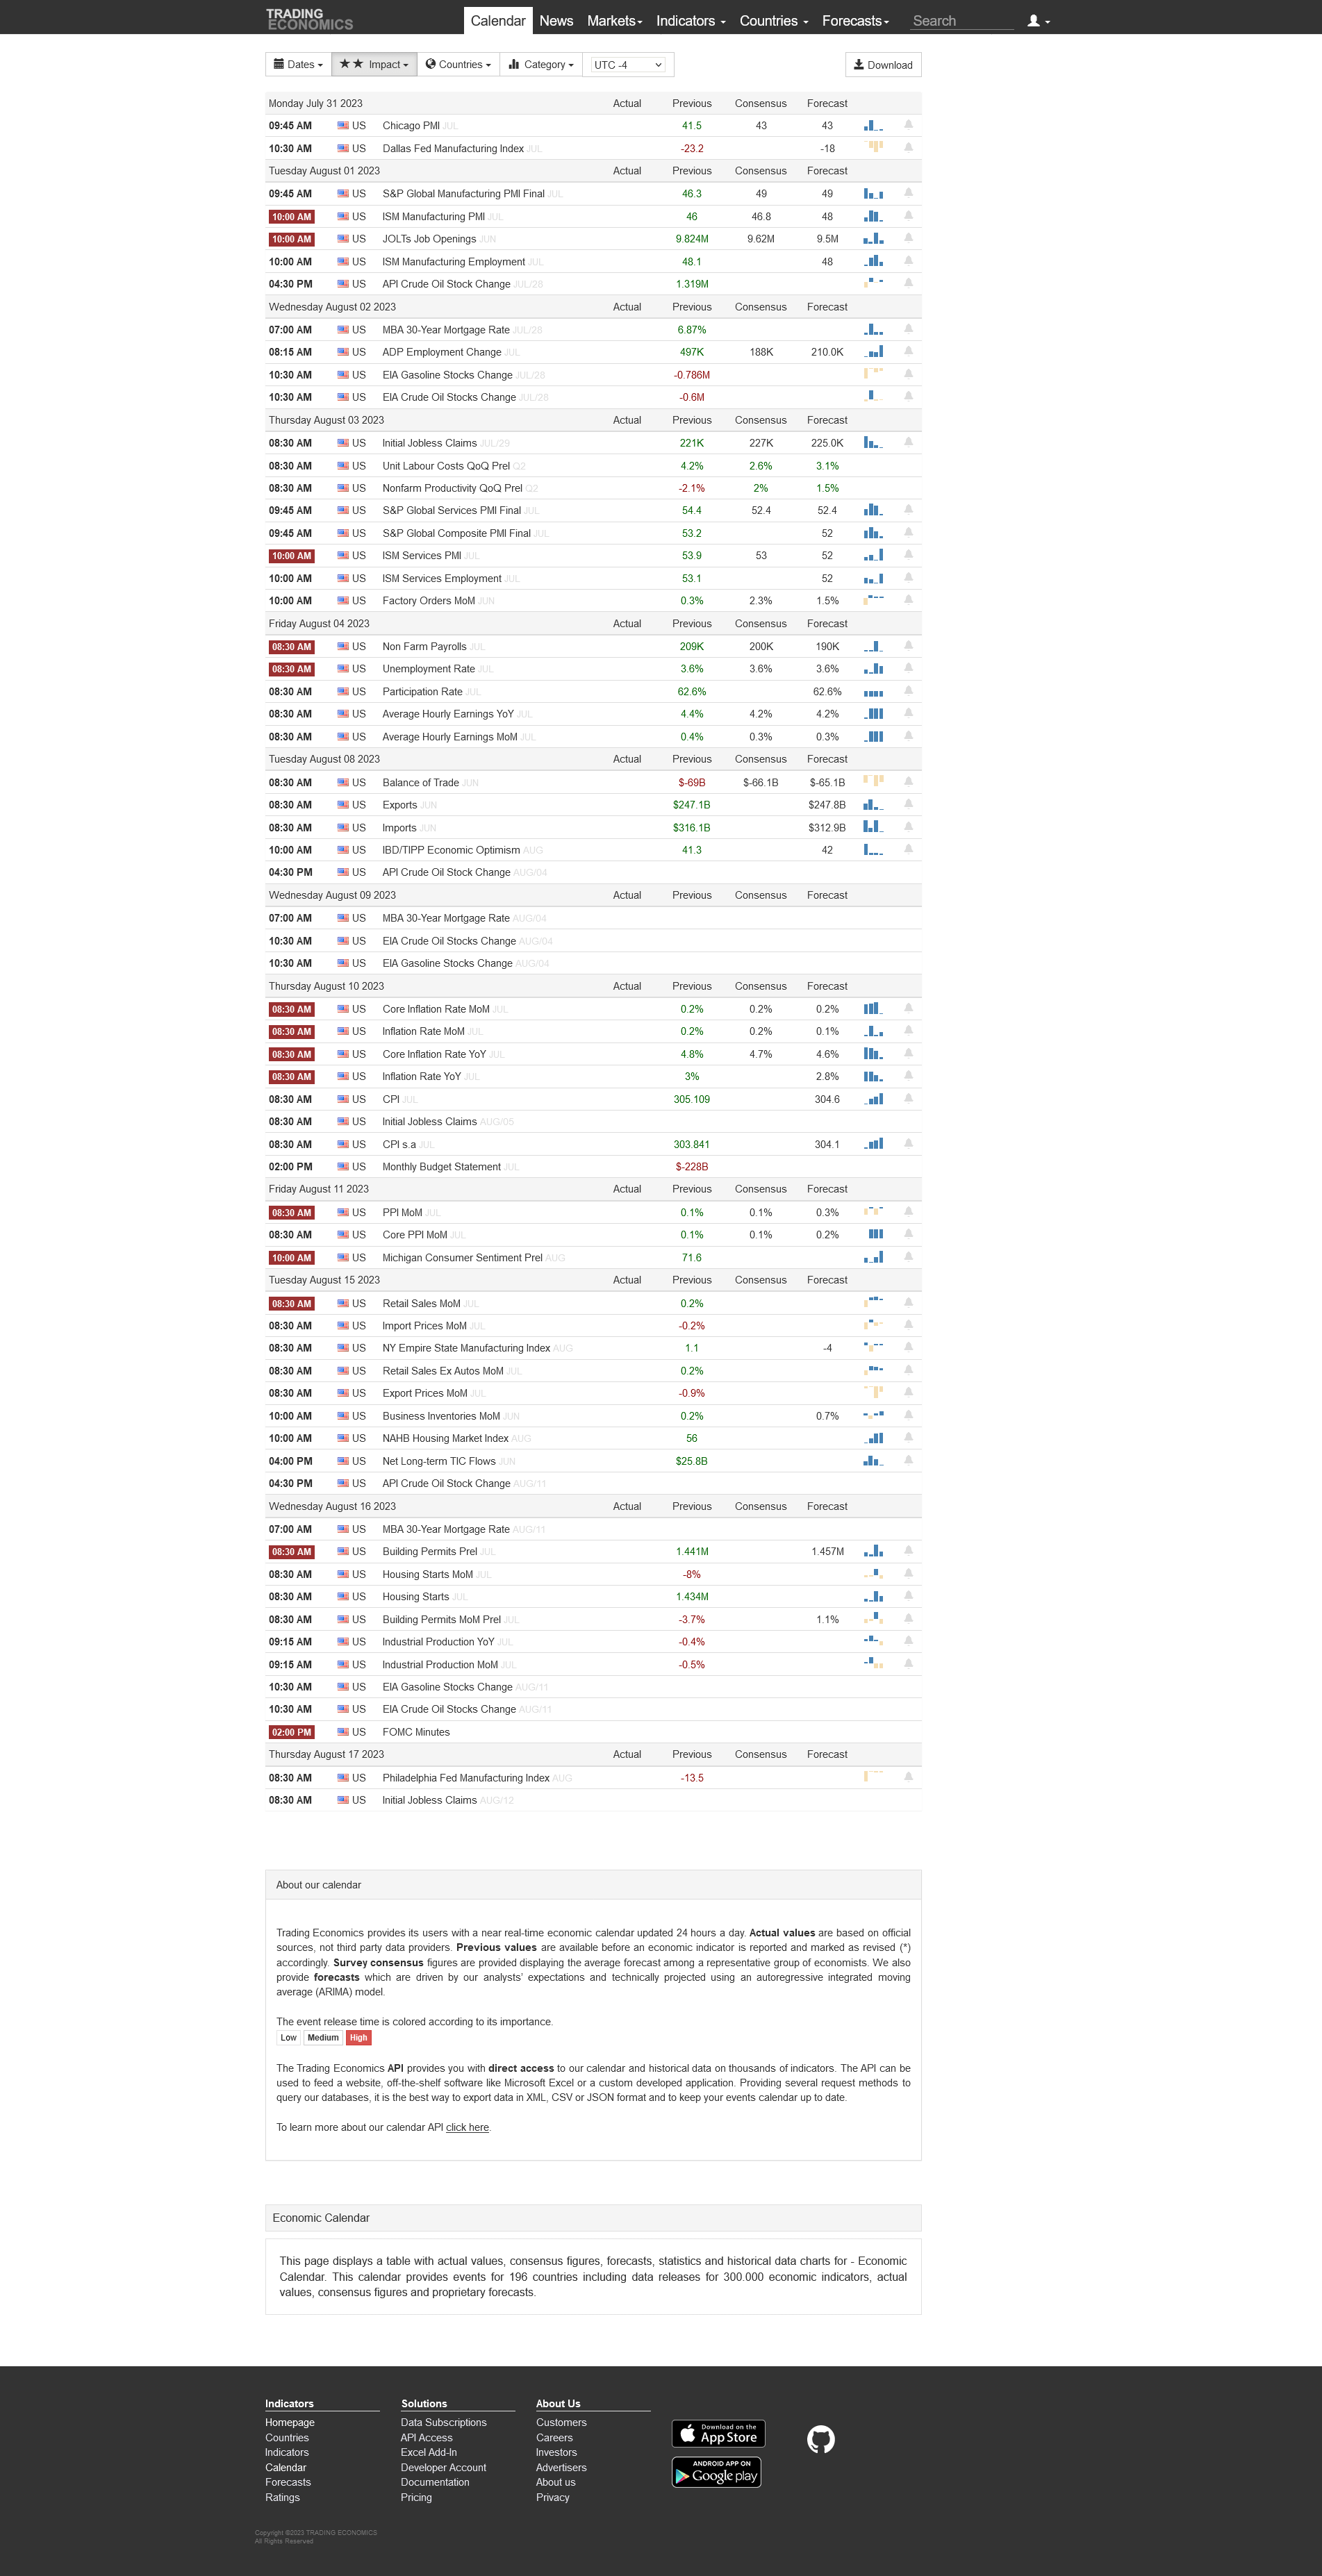
Price, Price Spread, Lagged Price/Volume Spread, and Binary Price/Volume Indicator
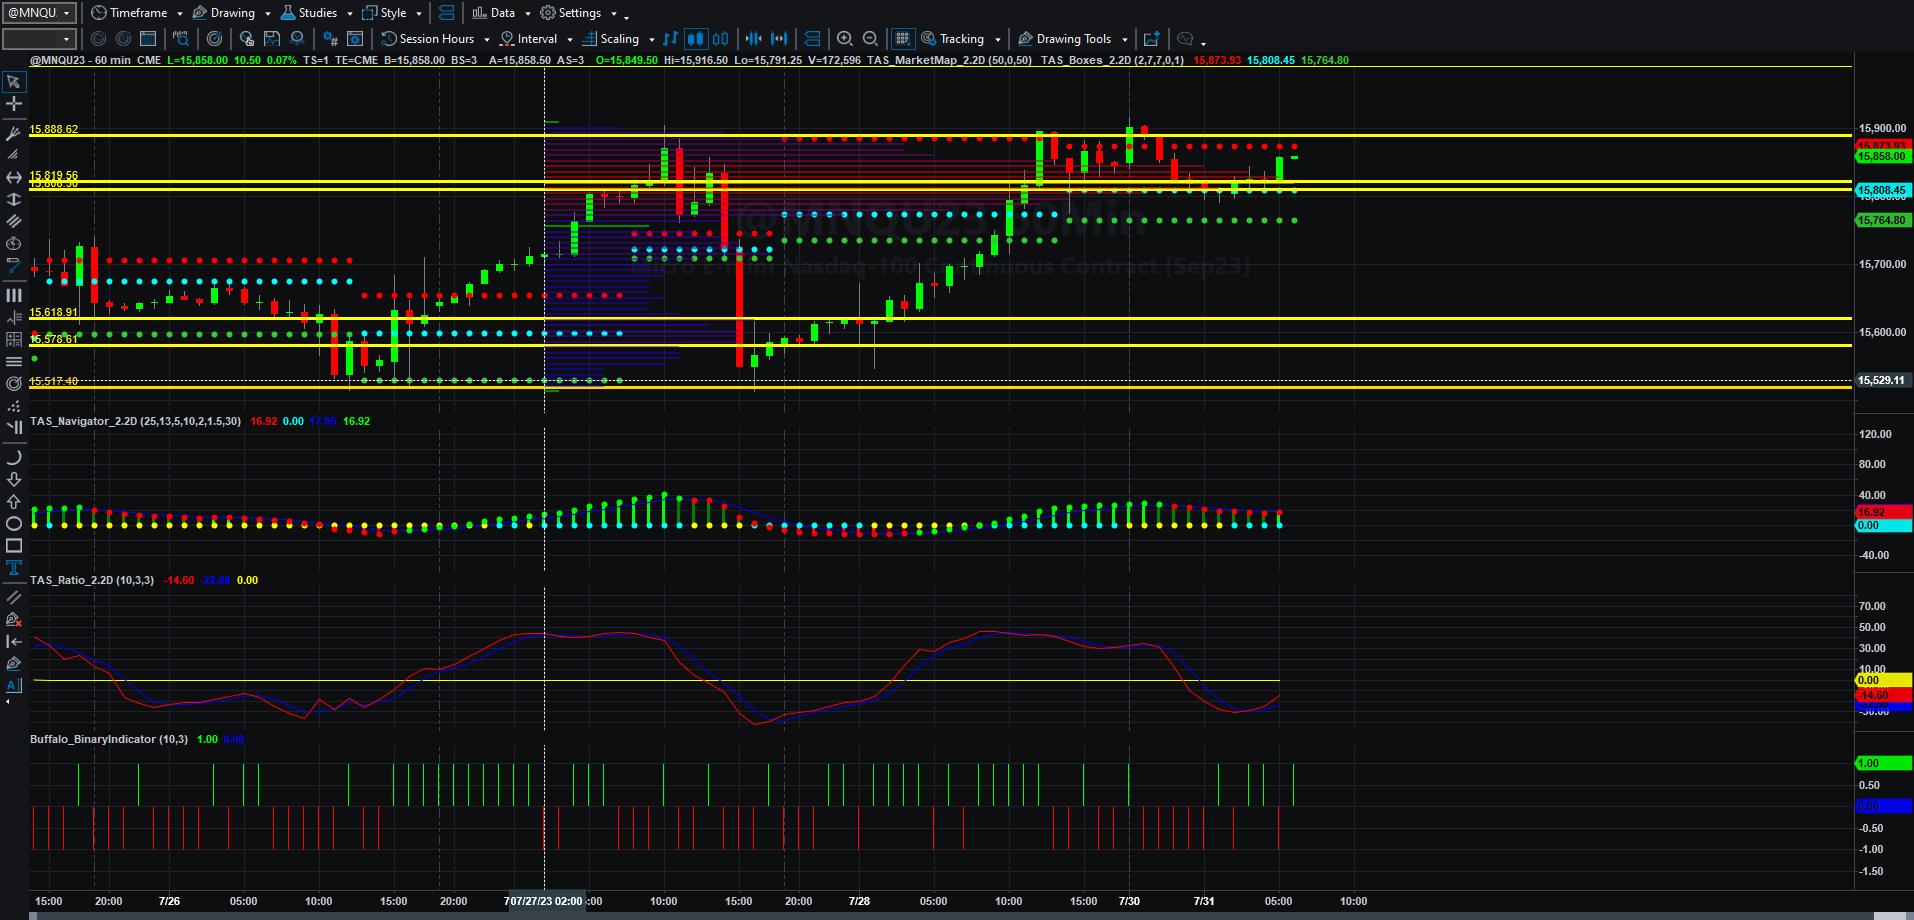
Price and Total Volume With 50-period Moving Volume Average
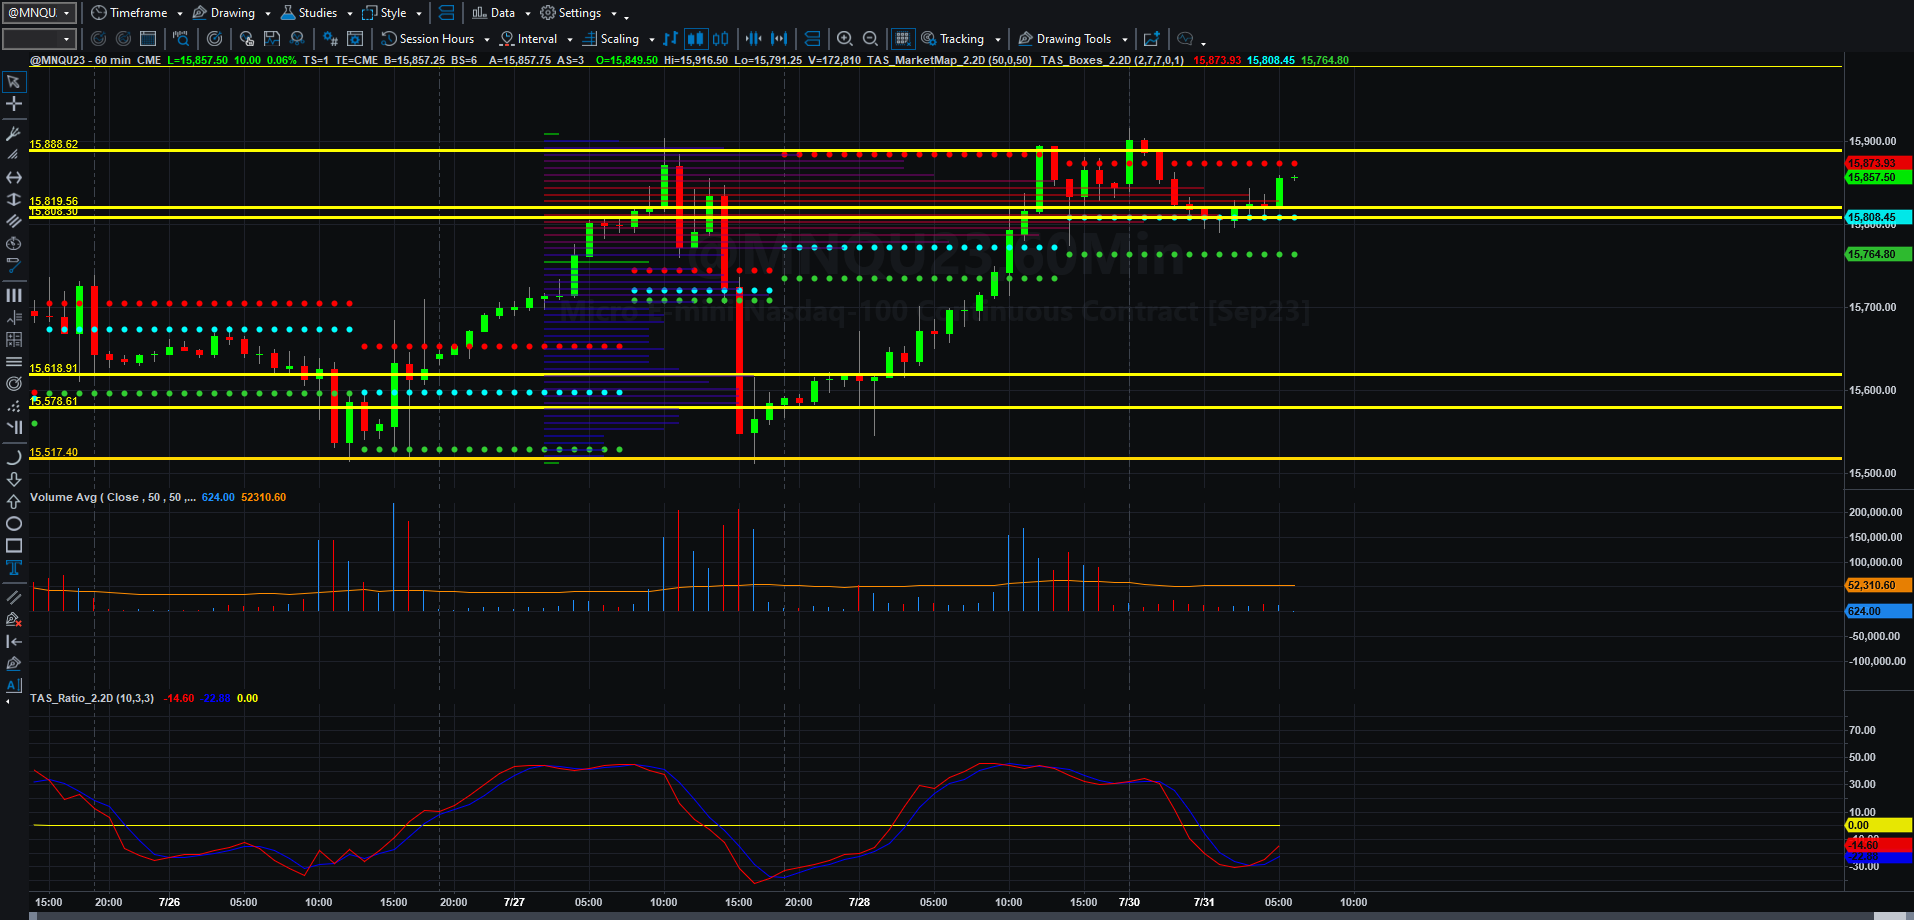
Fibonacci Price Scale With Targets
As I discussed in yesterday’s weekly analysis post (which YOU should have read), there are massive economic dynamics that while looking sufficient to keep the equity markets higher are showing signs of cracking, rolling over, or perhaps being interrupted by geopolitical events (wheat, in the case of the US draughts, and war in Ukraine). The one thing I didn’t mention yesterday that I will explore more fully later is that even though semiconductor inventories are high at the moment, Chairman Xi’s decision to expand the war footing to an invasion of Taiwan would interrupt that and ALL Chinese/American trade. That is NOT a zero probability event if you have read the news lately, particularly with regard to Chinese youth unemployment and the drying up of American investment capital in the PRC. I could come up with a laundry list of tens of items that threaten U.S. economic stability (and stability of corporate earnings), but despite that, the belief that the free money will continue into the stock market casino still seems to hold among individual traders and investors, hedgers, and institutional money managers. In spite of all the inflation drivers that still exist out there that I have discussed ad nauseum, everyone in the mainstream financial press still believes that the economy will heal itself, despite the numerous attempt by American Uniparty elites and world leaders to destroy our and the world economy. De-growth is not a good strategy for geopolitical stability.
I will leave that discussion for now. Let’s look at the charts.
If MNQU23 can remain above 15819.50, and can penetrate the VWAP line at 15880.75, it has an excellent chance, given the lack of institutional trade above it, to rally beyond 15916.50 to 15955 and even 16003 if the last overhead 15990.50 VWAP line is blown out, by Tuesday.
If not, it could be a quick trip back to 15775 and beyond to 15736.50 and 15687.50 by Tuesday. A lot depends on sentiment and world news. It will all depend on who show up to trade.
Friday I eeked out a 9 NQ profit both long and short, having to stop out early on one trade and allowing the other to run 21 NQ to take a profit on the day IN SIMULATION as I am still testing the new stop strategy. It is helping to protect capital, the trader’s first responsibility, and it is leading to better profits overall. As the days progress, I will begin to work on synchronized entries from hourly and 15 minute charts to catch larger profits. Reward to risk ratios are a bit flatter than I am used to, but the addition of letting the trades breathe until the primary driver of volume shifts against it makes leaving trades easier to do when they fail to fully develop.
That’s it for now. Have a pleasant and productive Monday, and put some money in the wallet.
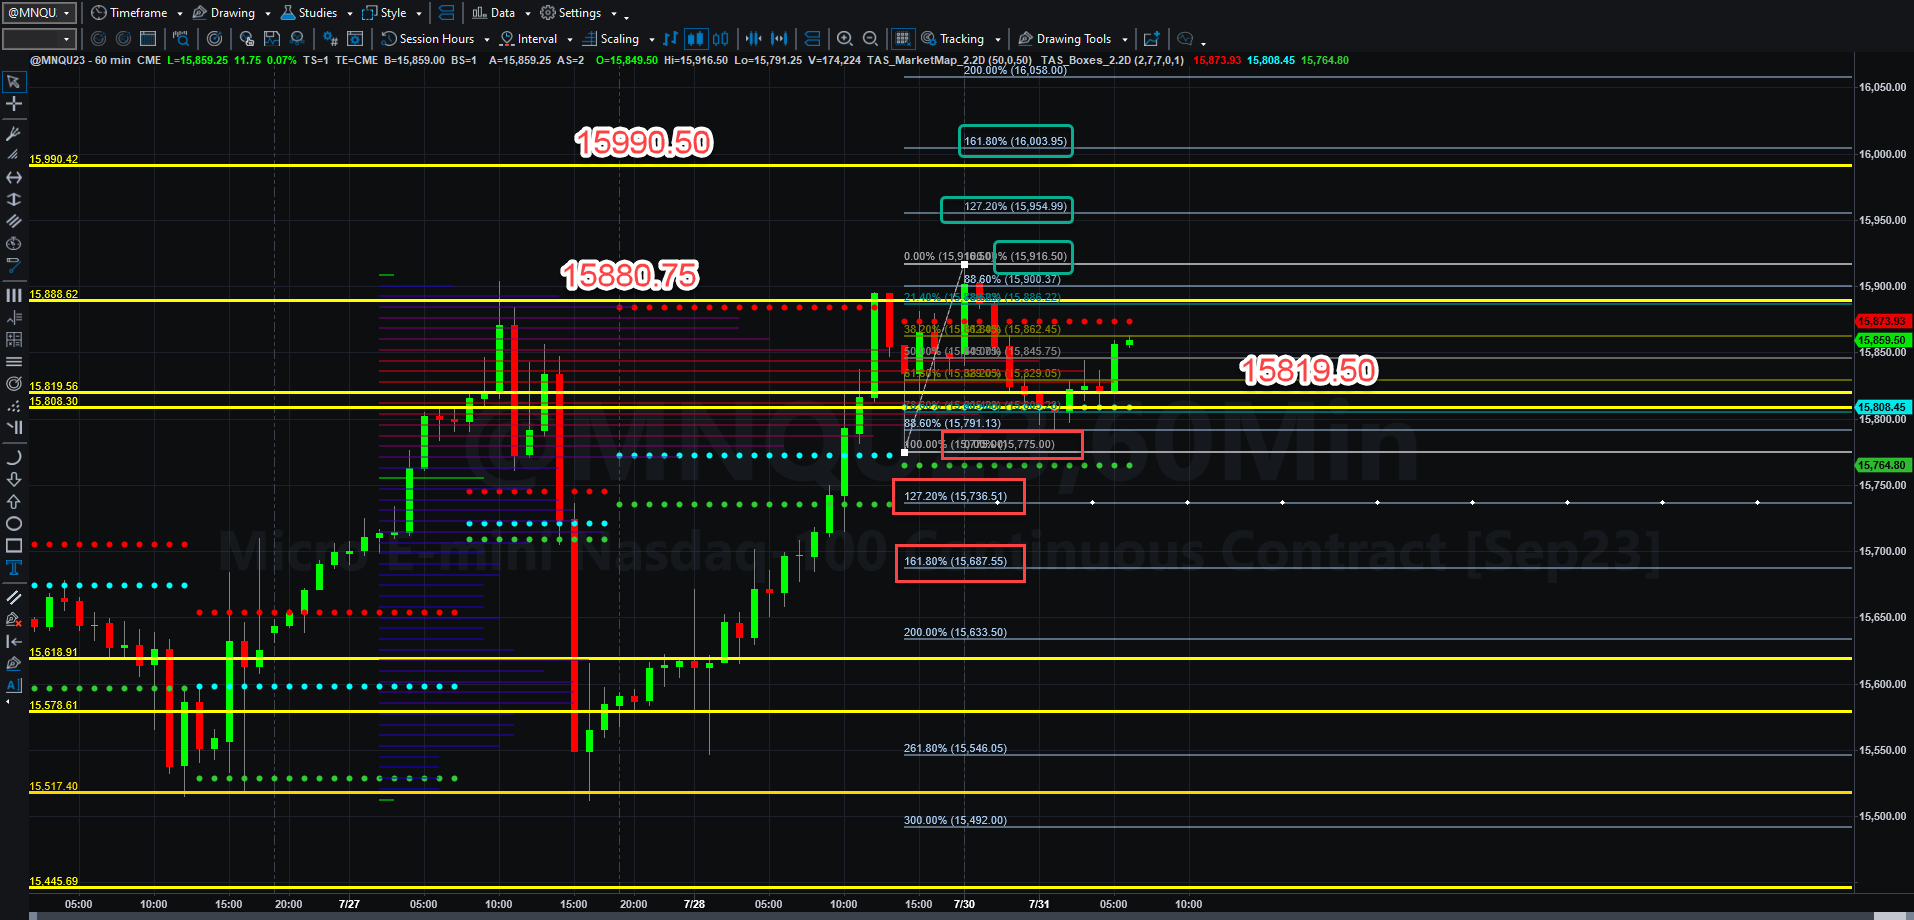
Today’s Economic Data Courtesy of Trading Economics dot com. Be sure to refresh the date at the top left.