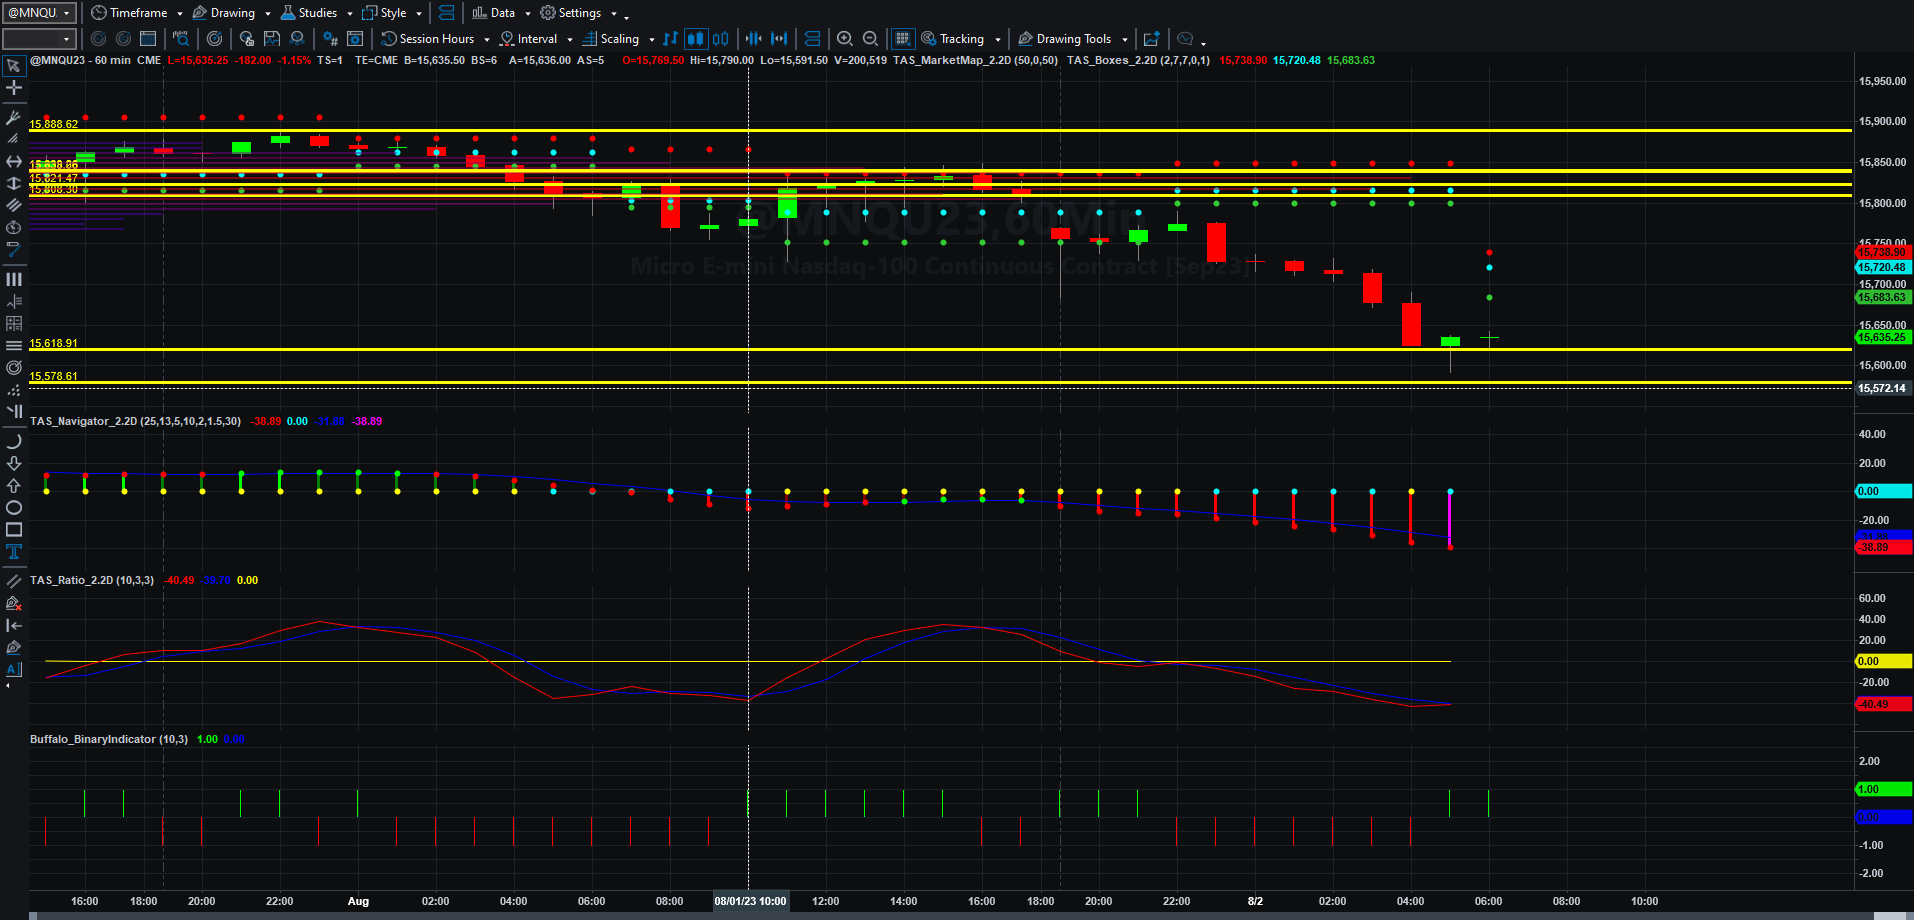
Price, Price Spread, Lagged Price/Volume Spread, and Binary Price/Volume Indicator
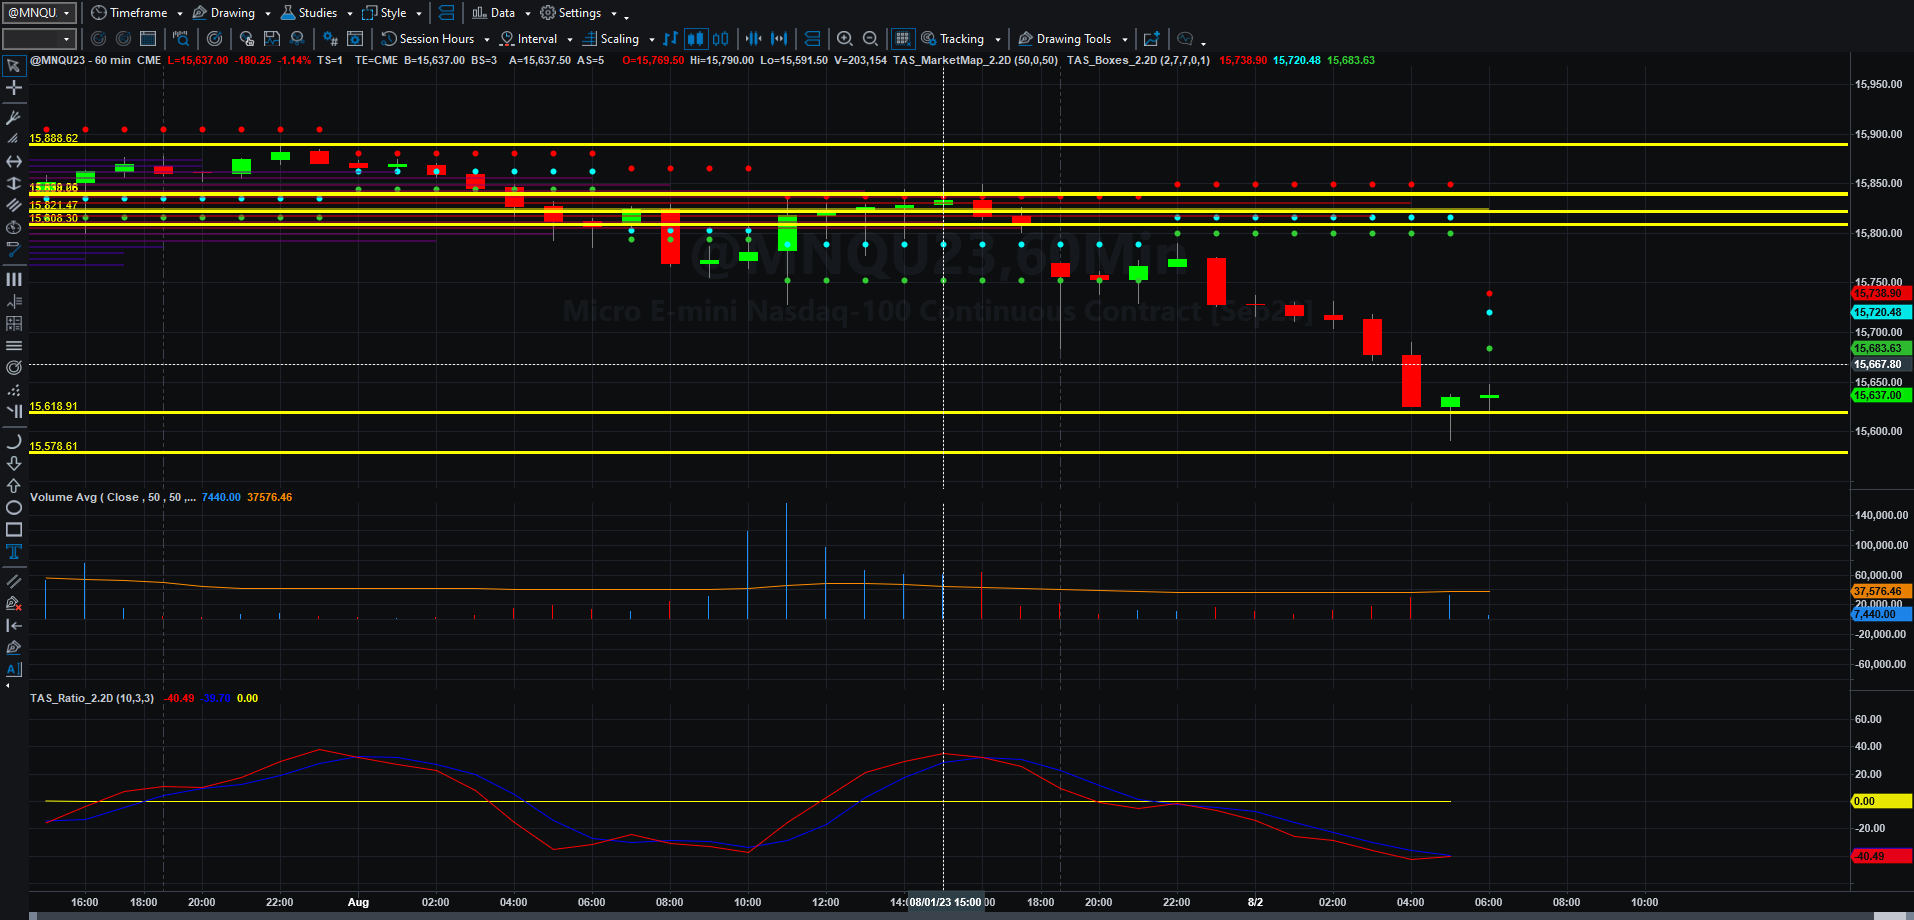
Price and Total Volume With 50-period Moving Volume Average
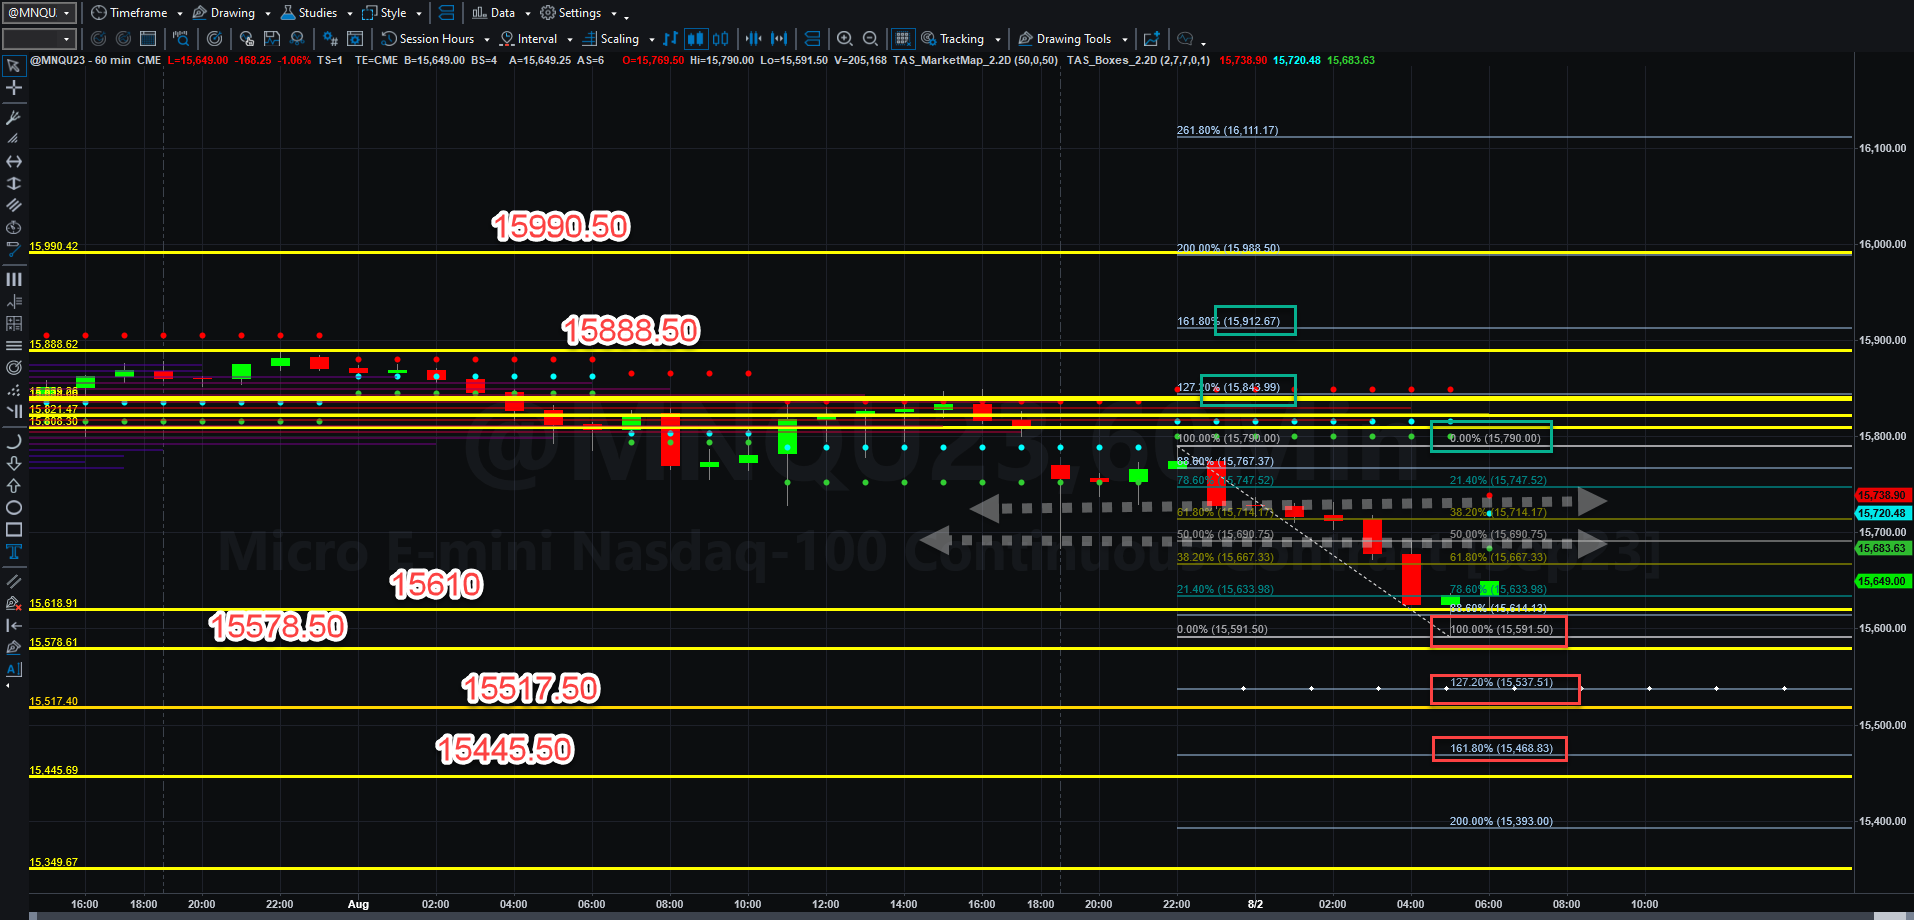
Fibonacci Price Scale With Targets
The Broader Picture of Hourly MNQU23
What suddenly happened to the rally to “infinity and beyond” that many were talking about? Well, a few things did. Fitch cut its rating on U.S. government debt (much like they did in 2008) to AA+ from AAA. John Hussman, noted on Twitter yesterday, a bit of shocking data about Federal insolvency. Just for effect, I will leave the image below.
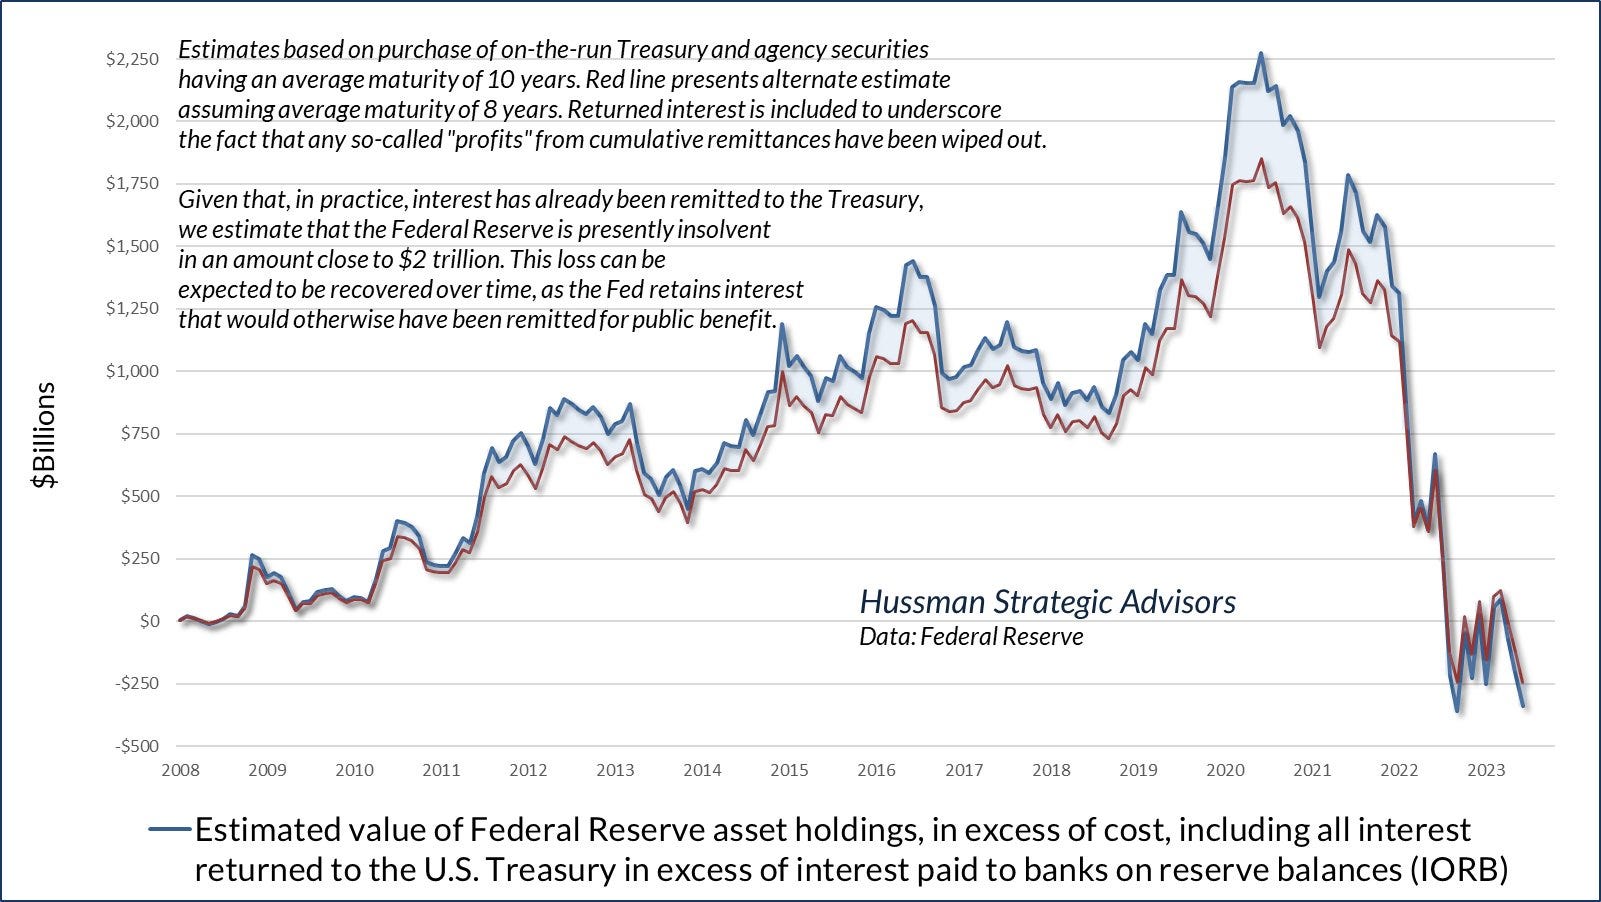
Here is what he said. "We estimate the Fed is insolvent in an amount close to $2 Tn. This loss can be expected to be recovered over time, as the Fed retains interest that would otherwise have been remitted for public benefit." Banks are experiencing this to some extent too. I know you don't care.”
Do y’all now understand just how bankrupt America is now?
What would make one worry even more about such an event? An inflationary spike at the consumer level perhaps? Try this. The financial press finally realizes that U.S. oil inventories are in rather significant deficit, and prices will rise from still robust demand.
All the risks we were all panicked over in March ARE STILL HERE. One can only ignore the coiled rattlesnake so long before it bites. The Fed is still behind the curve, and bank holdings of less expensive debt will be crushed again when rates are forced to inevitably rise.
For now I will leave the continuing dystopian melodrama and look at the charts.
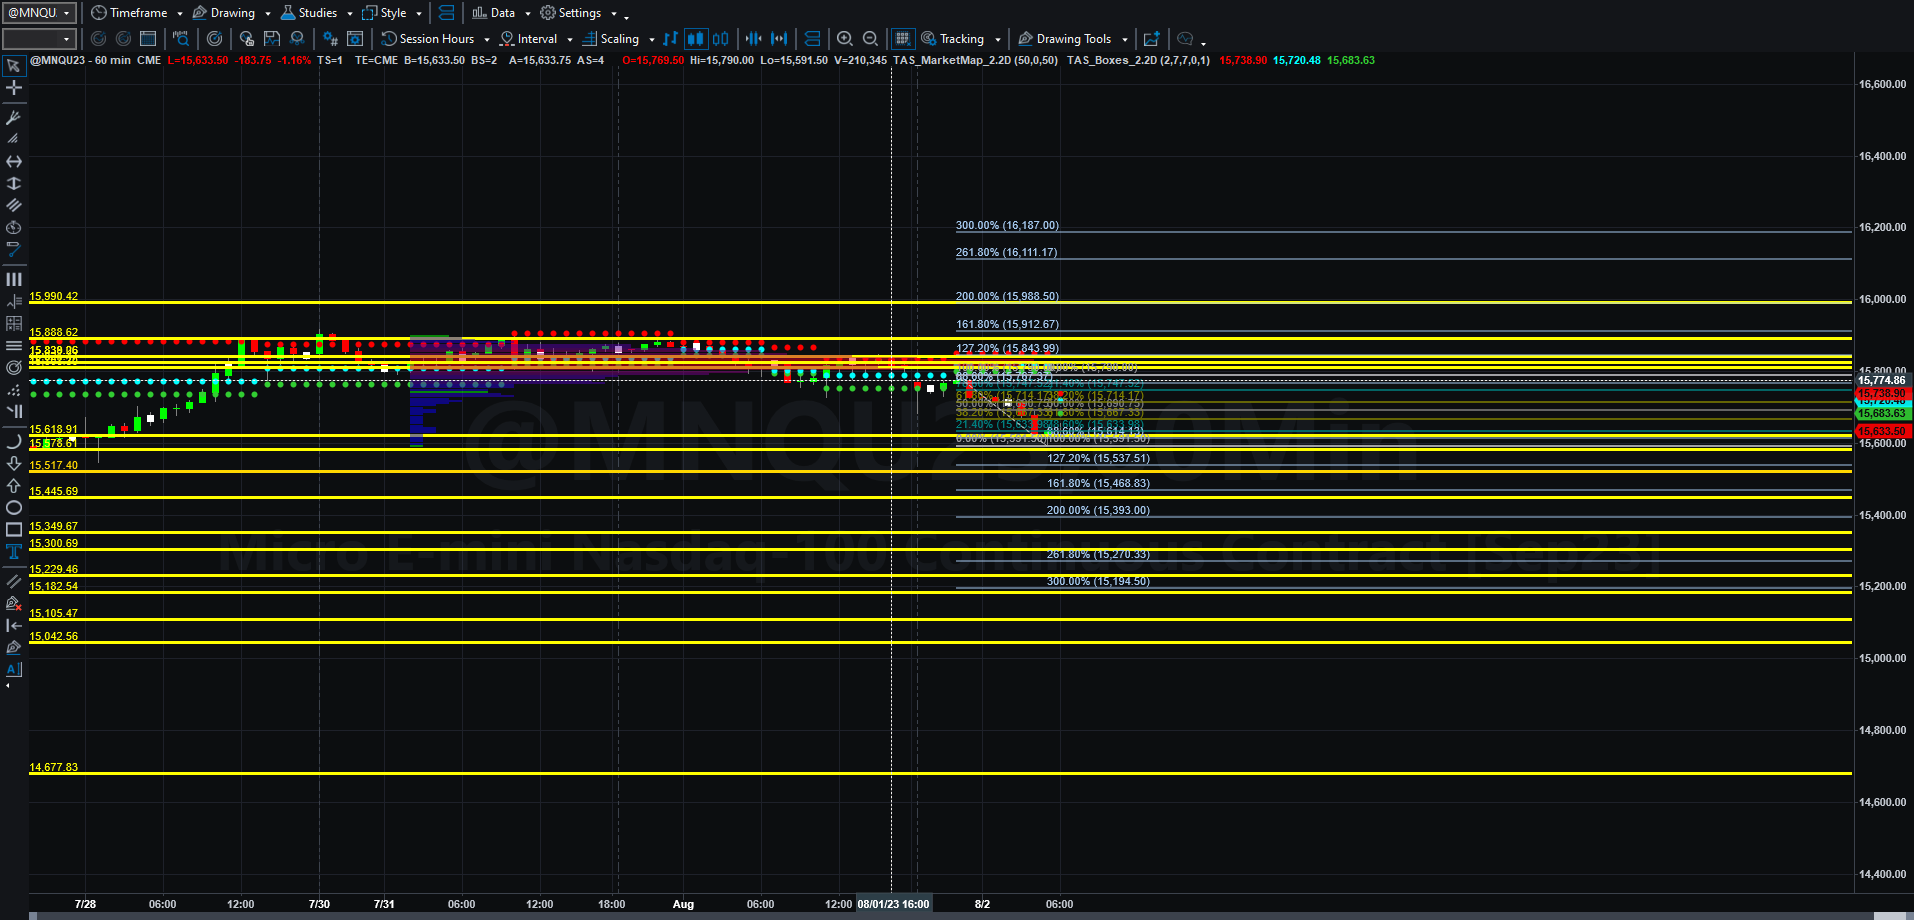
If MNQU23 can remain above 15610, it has a shot at regaining at least 15690.75, and beyond if buyers support this market again, to get back to 15790 by Thursday. If buyers continue to prevail, then 15844 and even 15912.75 are still possible tomorrow. If we cannot take out 15790, however, MNQU23 could very quickly fall back 15591 and even further slip to 15469 by Thursday. As I mentioned yesterday, the gap between VWAP levels down was large, and US and Asian traders made sure that a test of 15610 was in order.
What traders need to determine is whether or not one of those tight VWAP clusters above 15042 will hold. If none of them will, a trip back to the 14-handles is not hard to accomplish. It could also produce a swift rally that could have it chasing all-time highs again. It depends on who shows up to trade. (You can see that in the bottom chart).
Yesterday I picked up only 10 NQ points long on a bounce as volume in early session (the only time I can trade currently) was all over the place. It wasn’t until the afternoon that things got busy. I am still in simulation testing the new method, and so far, it performs better with stops. What I am still studying is how to move from 15 minutes to hourly trading on a permanent basis, as other projects now have a shifted time frame, allowing me to post trades for longer periods. We will see what happens. When I am done, I will attempt to roll out the videos showing how the trades develop, begin and end.
That is all for me at the moment. Have a great Wednesday!
Today’s Economic Data Courtesy of Trading Economics dot com. Be sure to refresh the date at the top left.